How to create a Python custom plugin
Custom plugins can be created for any process that exposes an interface, such as processes that are served over HTTP (for example, databases, applications, and load balancers). To begin, you need to create some Python code and write a JSON file that describes your metrics and how you want to display them. For complete instructions and examples, see how to write your first OneAgent plugin.
OneAgent running the plugins can work in either full-stack or cloud-infrastructure monitoring mode.
Download the DESK Plugin SDK
- Go to Settings > Monitoring > Monitored technologies.
- Click the Add new technology monitoring button.
- In the Monitor any technology section, click the Add OneAgent plugin button.
- You will see a high level overview of the steps required to develop your plugin, along with the Download plugin SDK button.
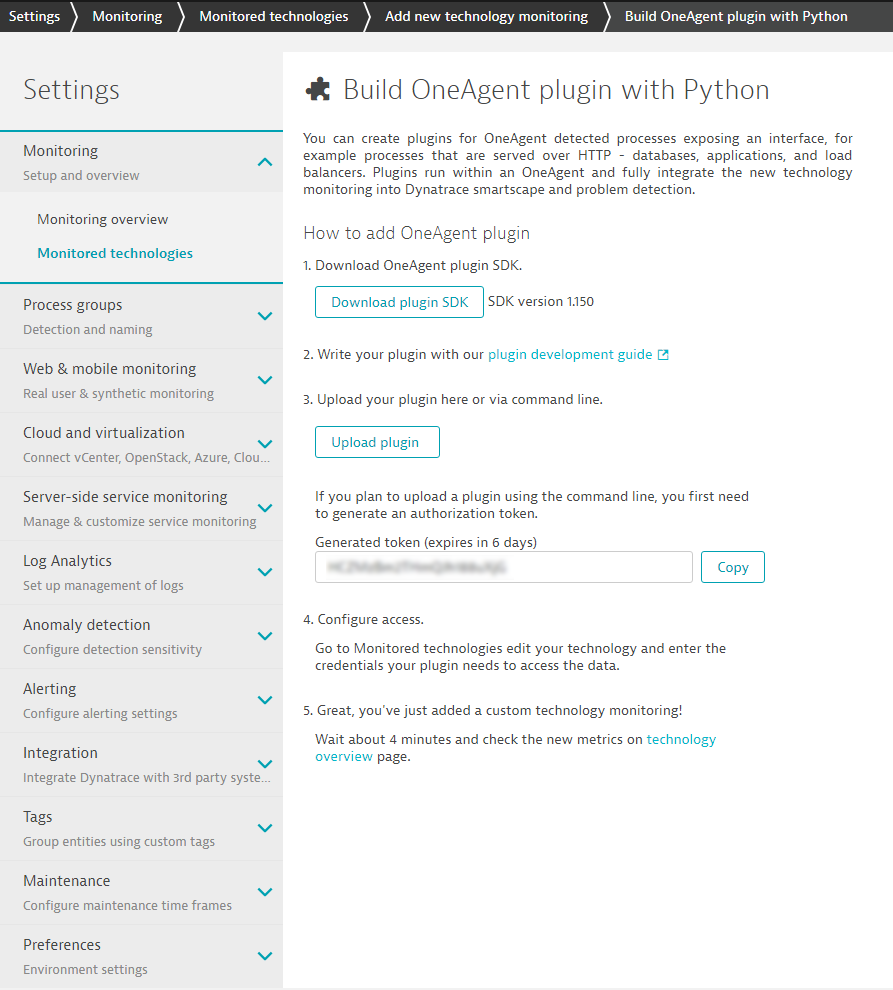
Upload your custom plugin
Once you’ve downloaded the DESK SDK and built your new plugin (as explained in How to write your first OneAgent plugin), it’s time to upload your plugin to your DESK environment.
To upload the plugin, complete the wokrflow you started with downloading the SDK
- Go to Settings > Monitoring > Monitored technologies.
- Click the Add new technology monitoring button.
- In the Monitor any technology section, click the Add OneAgent plugin button.
- You will see a high level overview of the steps required to develop your plugin, along with the Upload plugin button.
Notes:
- Alternatively, the OneAgent upload plugin command line tool can be used to perform the upload.
- If you make changes to your plugin in the future, remember to upload the updated plugin’s ZIP archive to DESK.
View custom plugin metrics
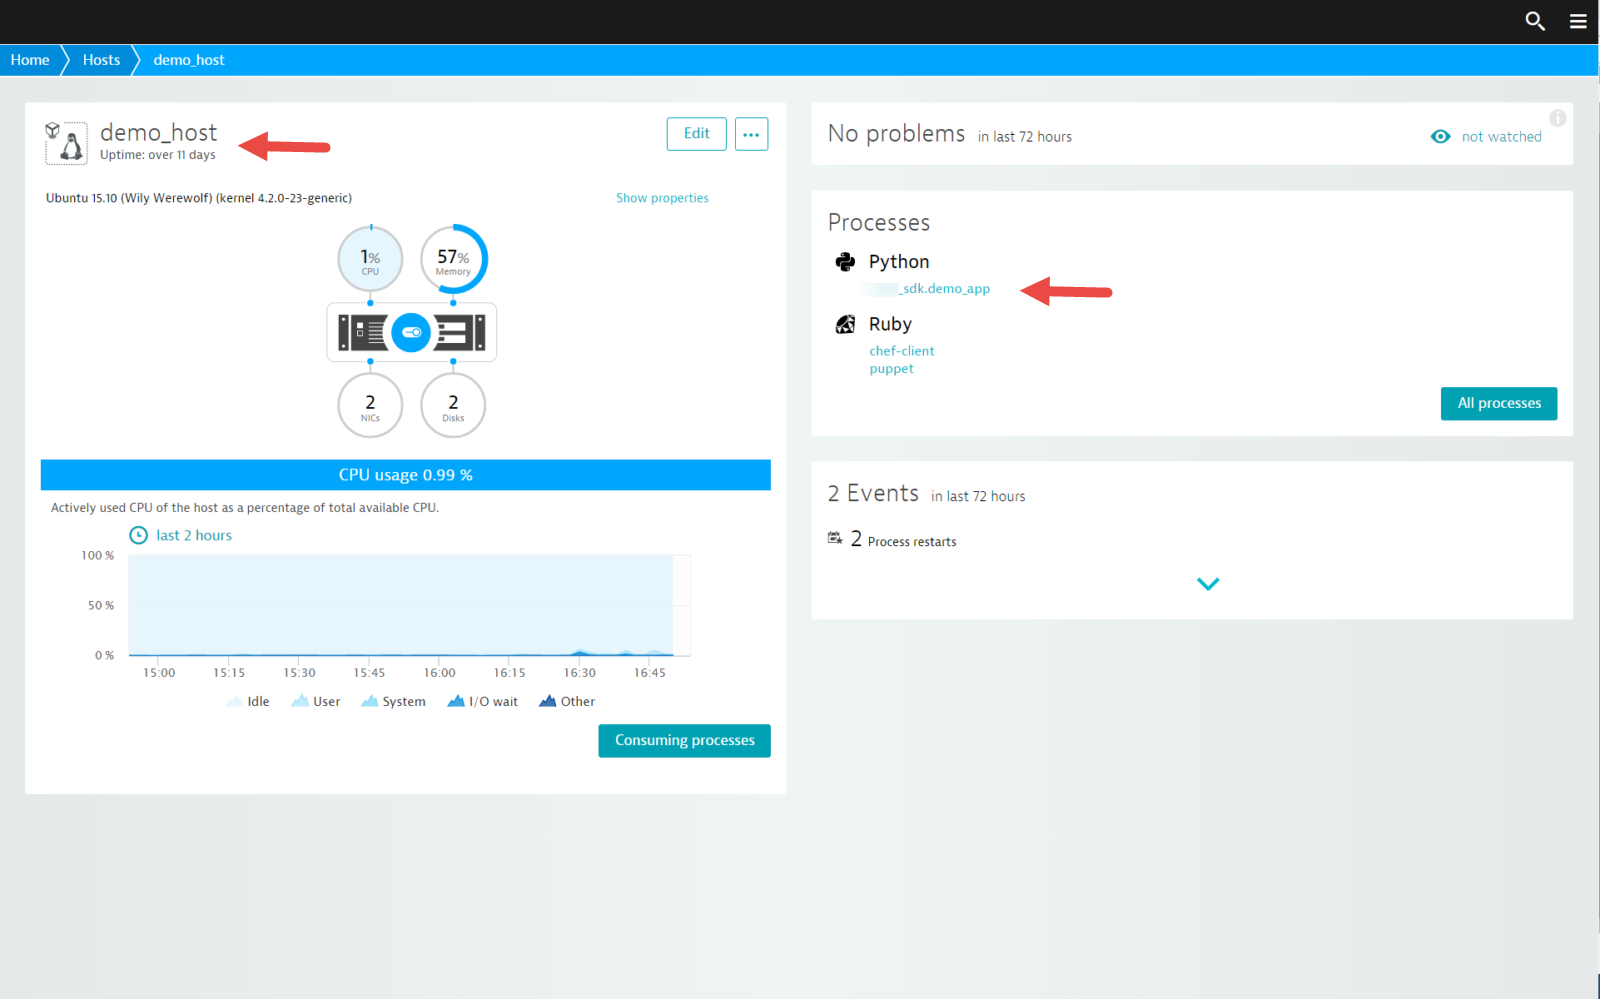
To verify that your new custom plugin works, navigate to your application’s Host page and click the process you’re working on (see example Python process below).
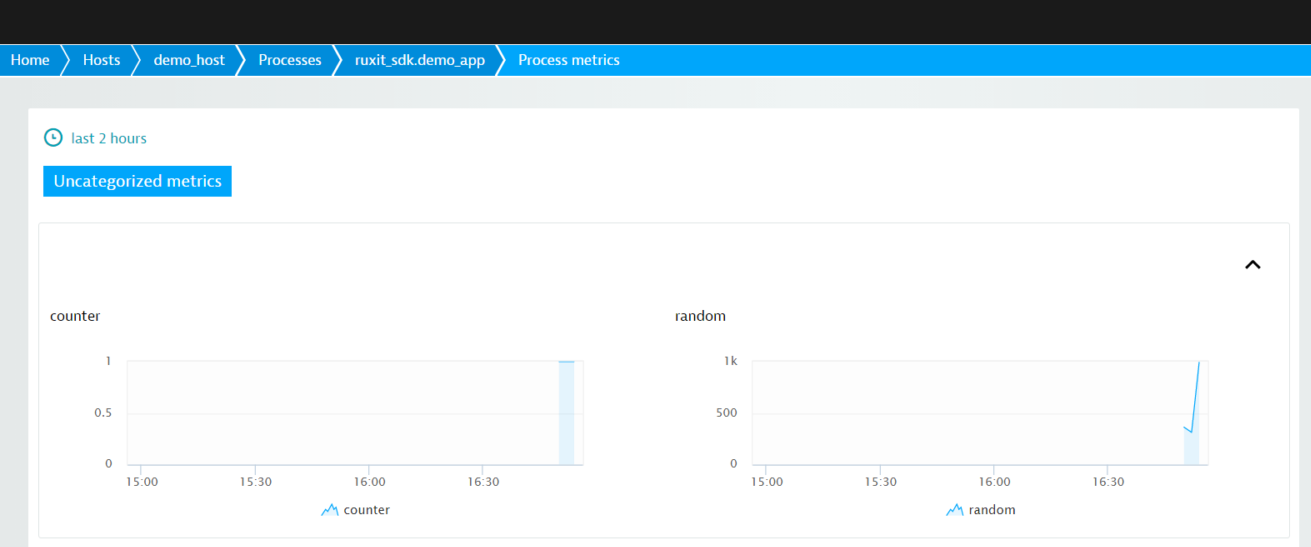
Your custom metrics will appear on the Further details tab (see Uncategorized metrics example below).
Visual display of custom metrics
There are many more options for visual display of custom metrics including the following:
- Presentation of metric data on either the associated process details page or the process’ Further details tab.
- Grouping charts with tabs.
- Presentation of chart dimensions beneath each chart.
- Chart titles, descriptions, and more.
Ready to get started writing your own plugin? Have a look at these useful plugin examples to get started.