User experience score
User experience score in DESK is a single metric that categorizes every session recorded with Real User Monitoring.
With User experience score, you can categorize each session that has been recorded by Real User Monitoring into the following:
- Frustrated
- Satisfied
- Tolerating
To determine these categories, DESK applies performance metrics, error metrics, and usability metrics on each recorded session. These metrics, when combined with the information derived about user flow, are used to calculate User experience score.
It also takes into account issues such as slow performance, rage clicks, errors occurring right at the end of a user session, and other usability problems that can cause the user to abandon the session.
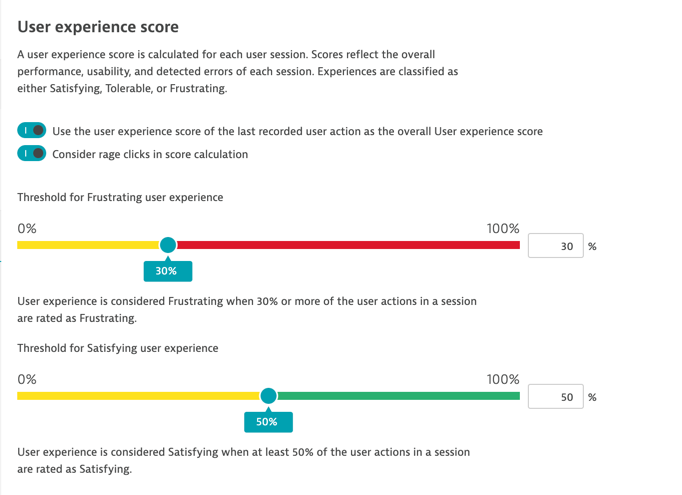
Configure thresholds
- From the navigation menu, go to Settings.
- Click Web & mobile monitoring > User experience score.
-
[Optional] Enable the switches to include the last user action and rage clicks in the score calculation.
-
Use the slider under Threshold for Frustrating user experience to define the percentage of Frustrating user actions beyond which the user session will be considered Frustrated.
-
Use the slider under Threshold for Satisfying user experience to define the minimum percentage of Satisfying user actions required to consider a user session Satisfied.
Calculate the user experience score
To be able to calculate the user experience score, each element that makes up a session is assigned a weight and an element Apdex, as shown in the following table:
| Element | Weight | Element Apdex |
|---|---|---|
| User action | 3 | Frustrated, Satisfied, or Tolerating |
| Error event | 1 | Frustrated |
| Rage event | 2 | Frustrated |
| Crash | 5000 | Frustrated |
As soon as session starts being recorded, the following process is applied to calculate its User experience score:
- Each element of the session is assigned a weight and is classified as Frustrated, Satisfied, or Tolerating. For instance, elements such as crashes, error events, and rage clicks are all classified as Frustrated.
- For each of these categories, the total weight of the elements is calculated. For example, F is the total weight of Frustrated elements, S is the total weight of Satisfied elements, and T is the total weight of Tolerating elements.
- The total weight of all these categories is calculated: Total=F+S+T
- Each of these weights is then divided by this total weight.
- Depending on the thresholds defined on the User experience score screen, the session is marked Frustrated, Satisfied or Tolerating.
Note: A user session is never marked Satisfied if there is even 1 Frustrated element in the session. In such cases, the session is determined either Frustrated or Tolerating.
Example
To understand this assignment better, consider the following example. The following session is made up of 11 elements, including XHR actions, load actions, errors, and other events. The Threshold for Frustrating user experience is set to 30% and the Threshold for Satisfying user experience is set to 50%.
Each element has been assigned an ID to ease the process of calculation.
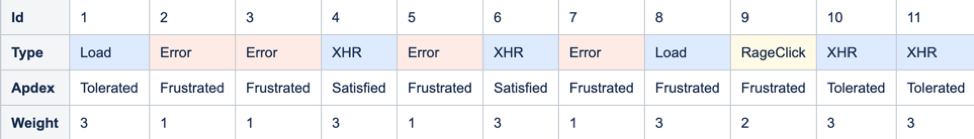
The total weight of Frustrated elements (F) = 9
The total weight of Satisfied elements (S) = 6
The total weight of Tolerating elements (T) = 9
The total weight of all the elements in these categories (Total) = 24
F/Total = 0.375 S/Total = 0.25 T/Total = 0.375
Because F/Total > 0.3, the User experience score of this session is Frustrated.