Analyze individual user actions
User action detail pages provide quick access to all relevant user-action data, giving you all the information you need to understand what contributes to the performance of each of your user actions.
To access user action detail pages
- Select Applications from the navigation menu.
- Select an application.
- Scroll down to the Top user actions section and click View full details.
- Select an action listed under Key user actions or Top 100 user actions.
Depending on which user action you want to analyze, you can alternatively directly select in the Top user actions section one of the actions shown there.
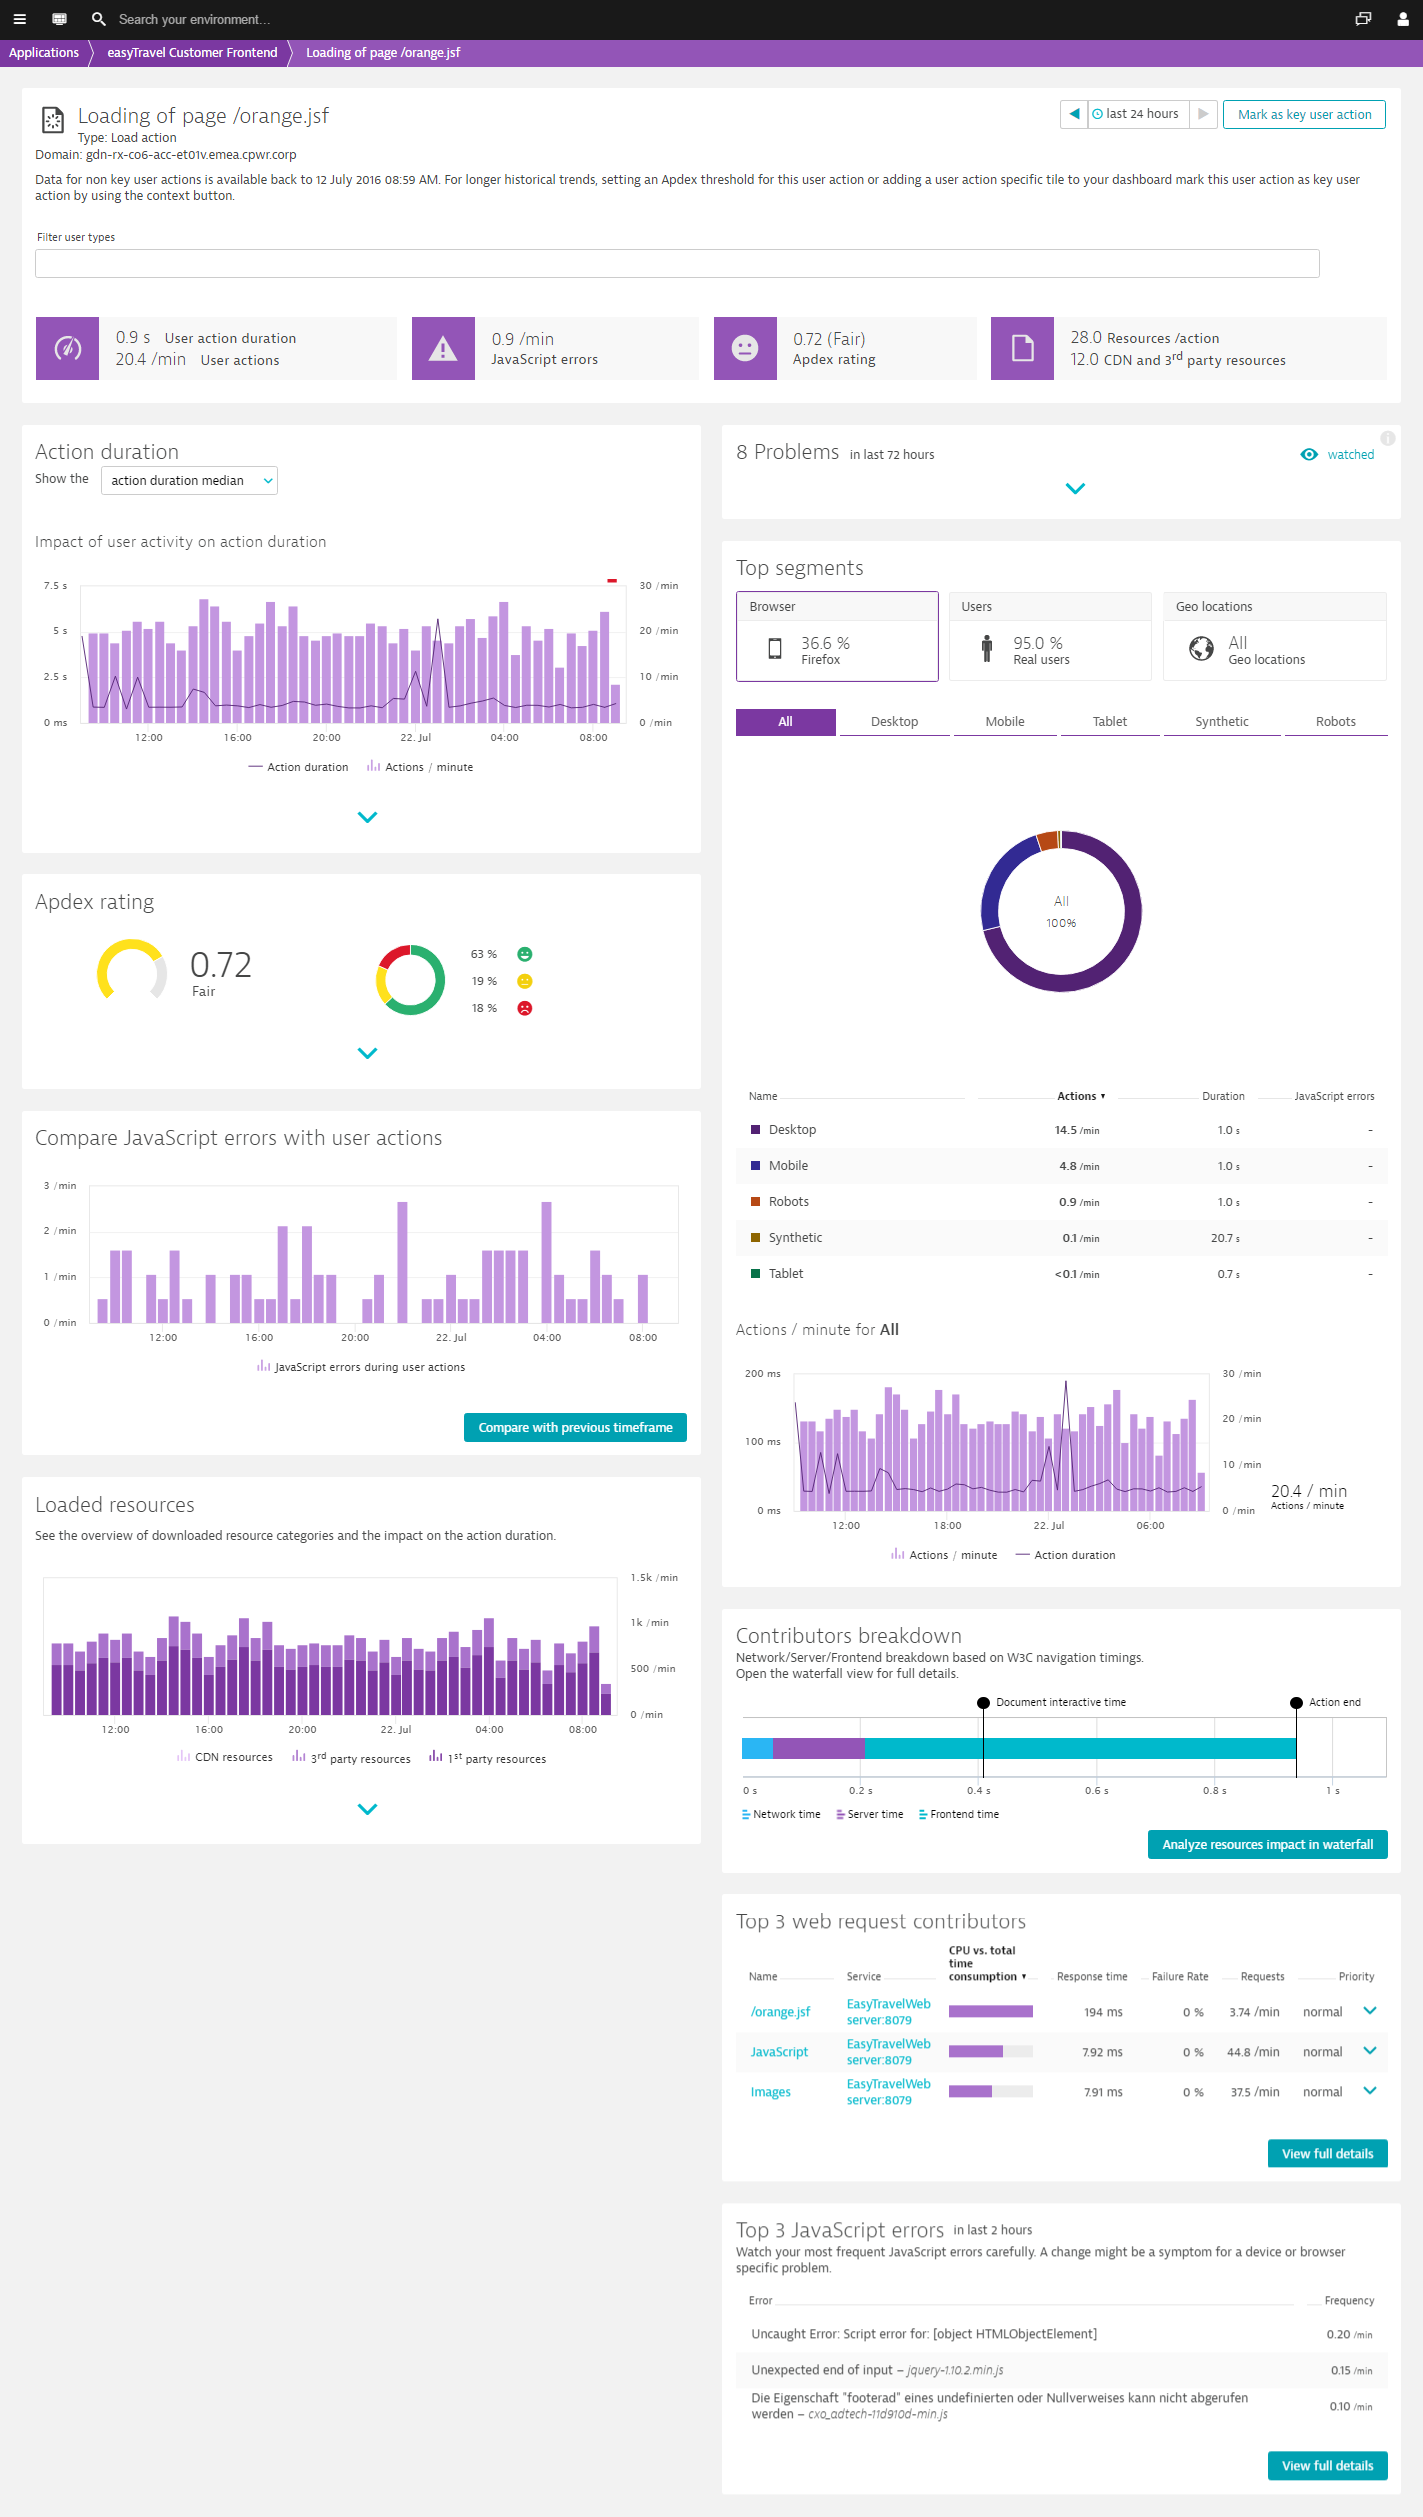
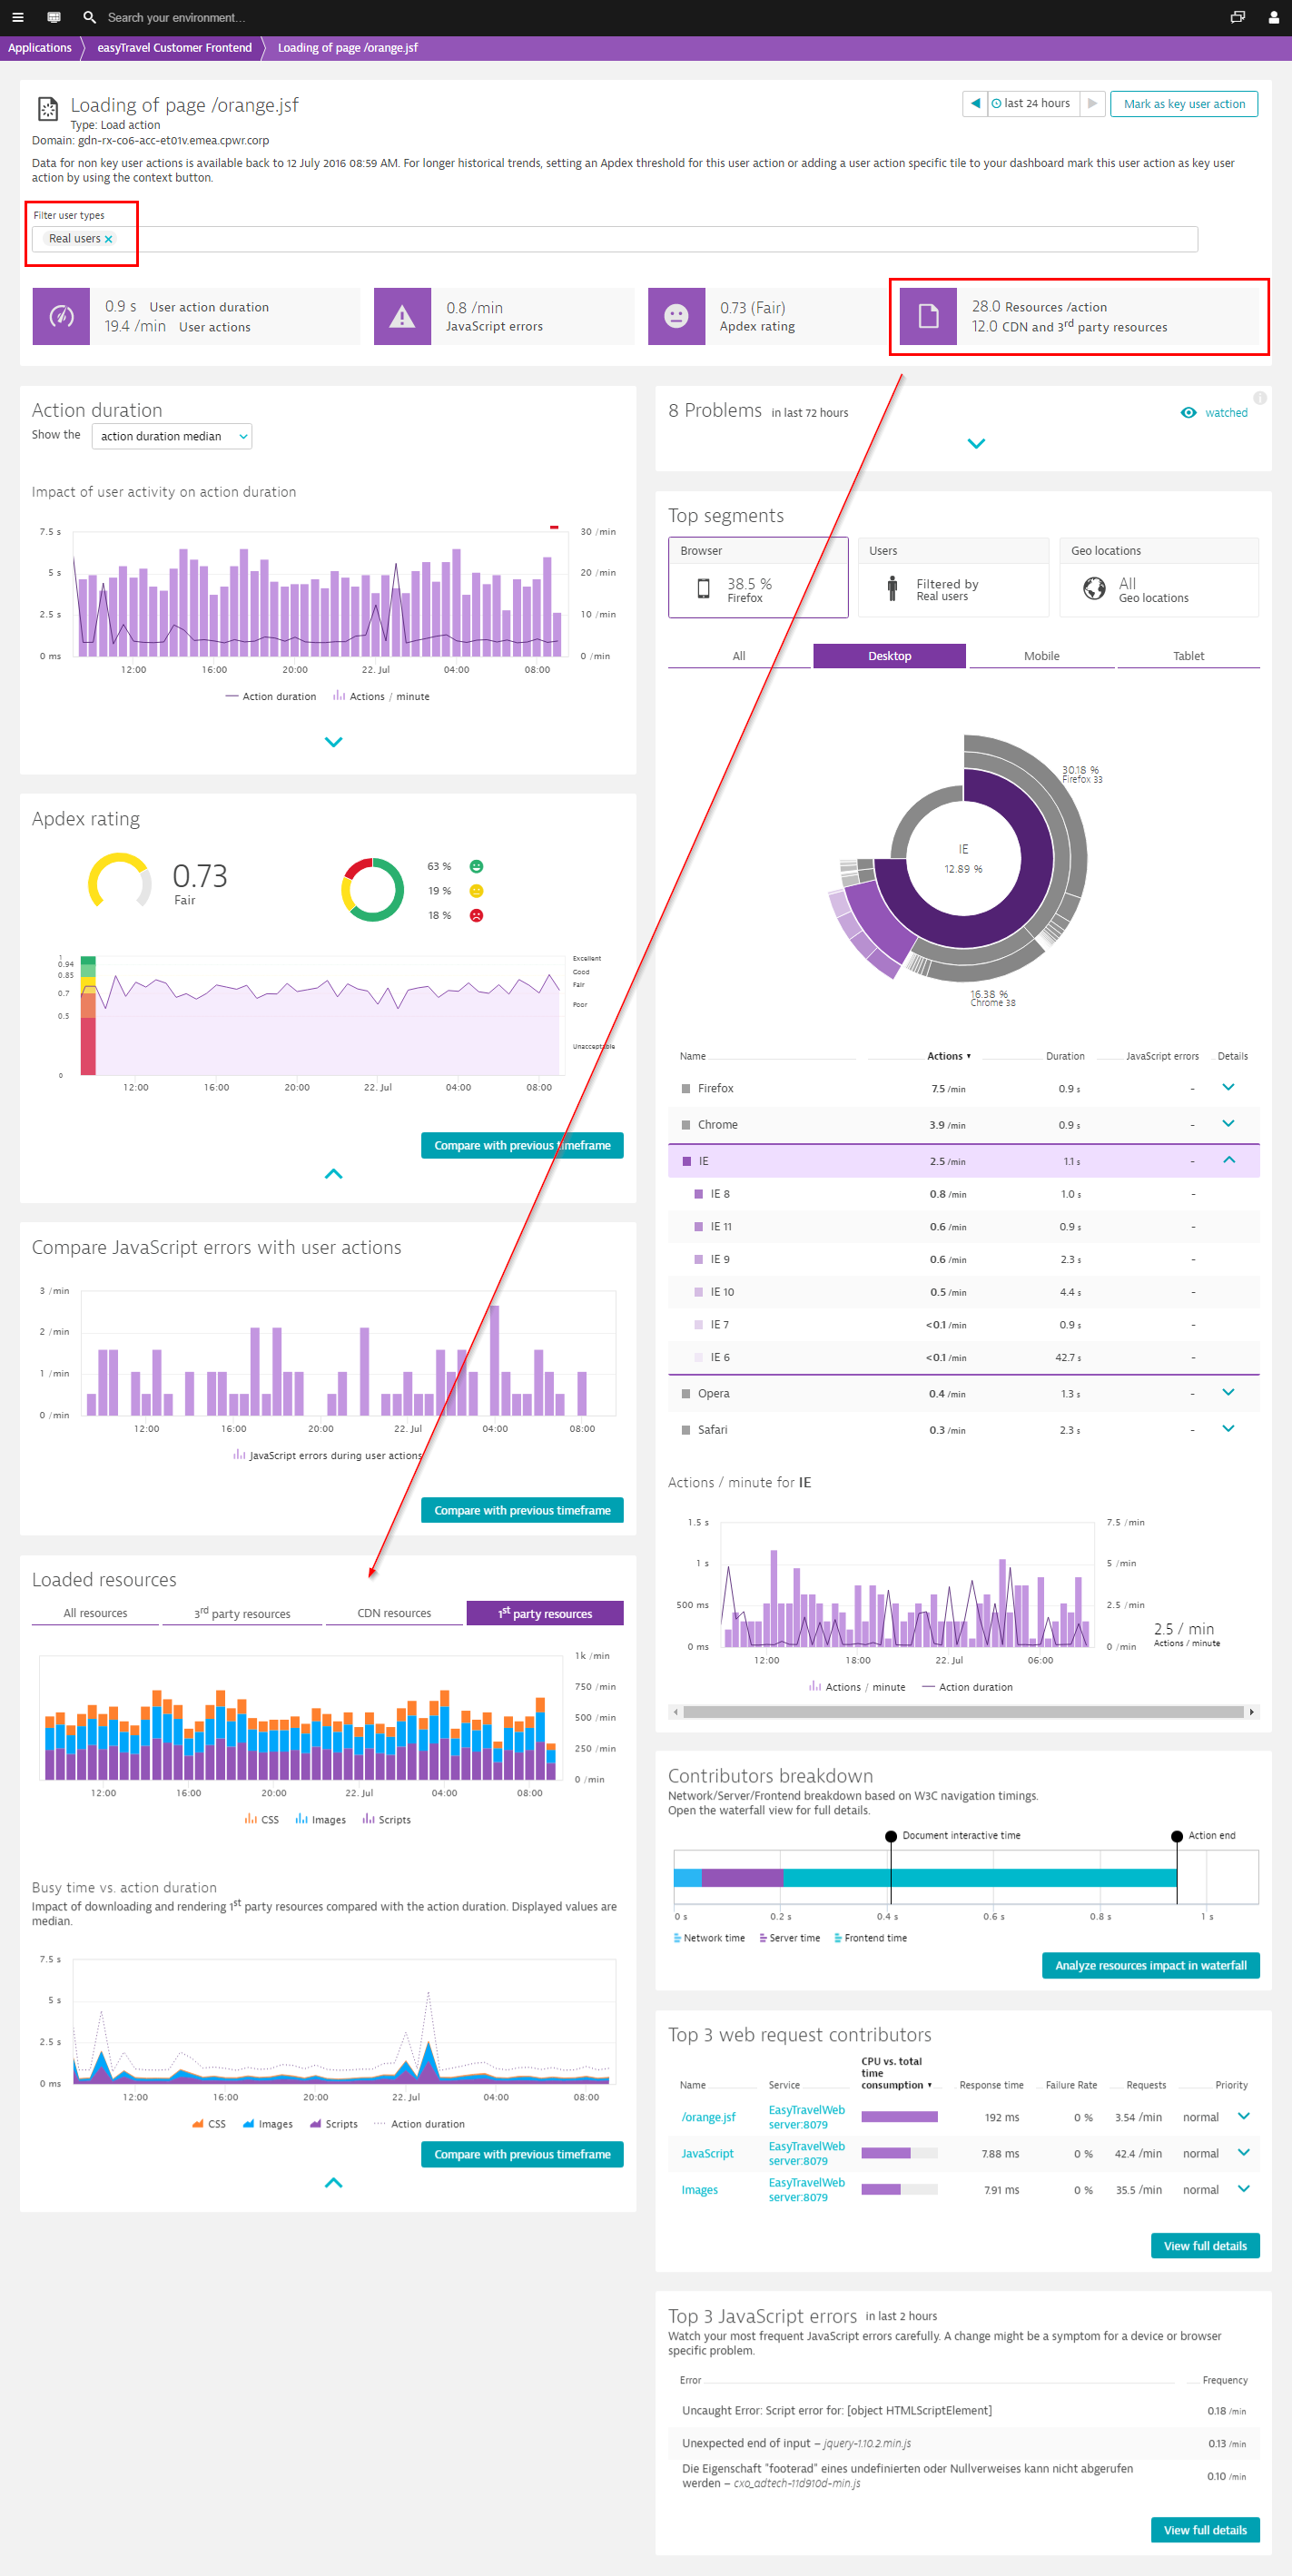
Once on a user action detail page, click areas of the infographic at the top of the page to navigate to the corresponding section on the page related to each summary metric, or type a string into the Filter user types field to view real-user or synthetic-monitoring specific data.
Performance
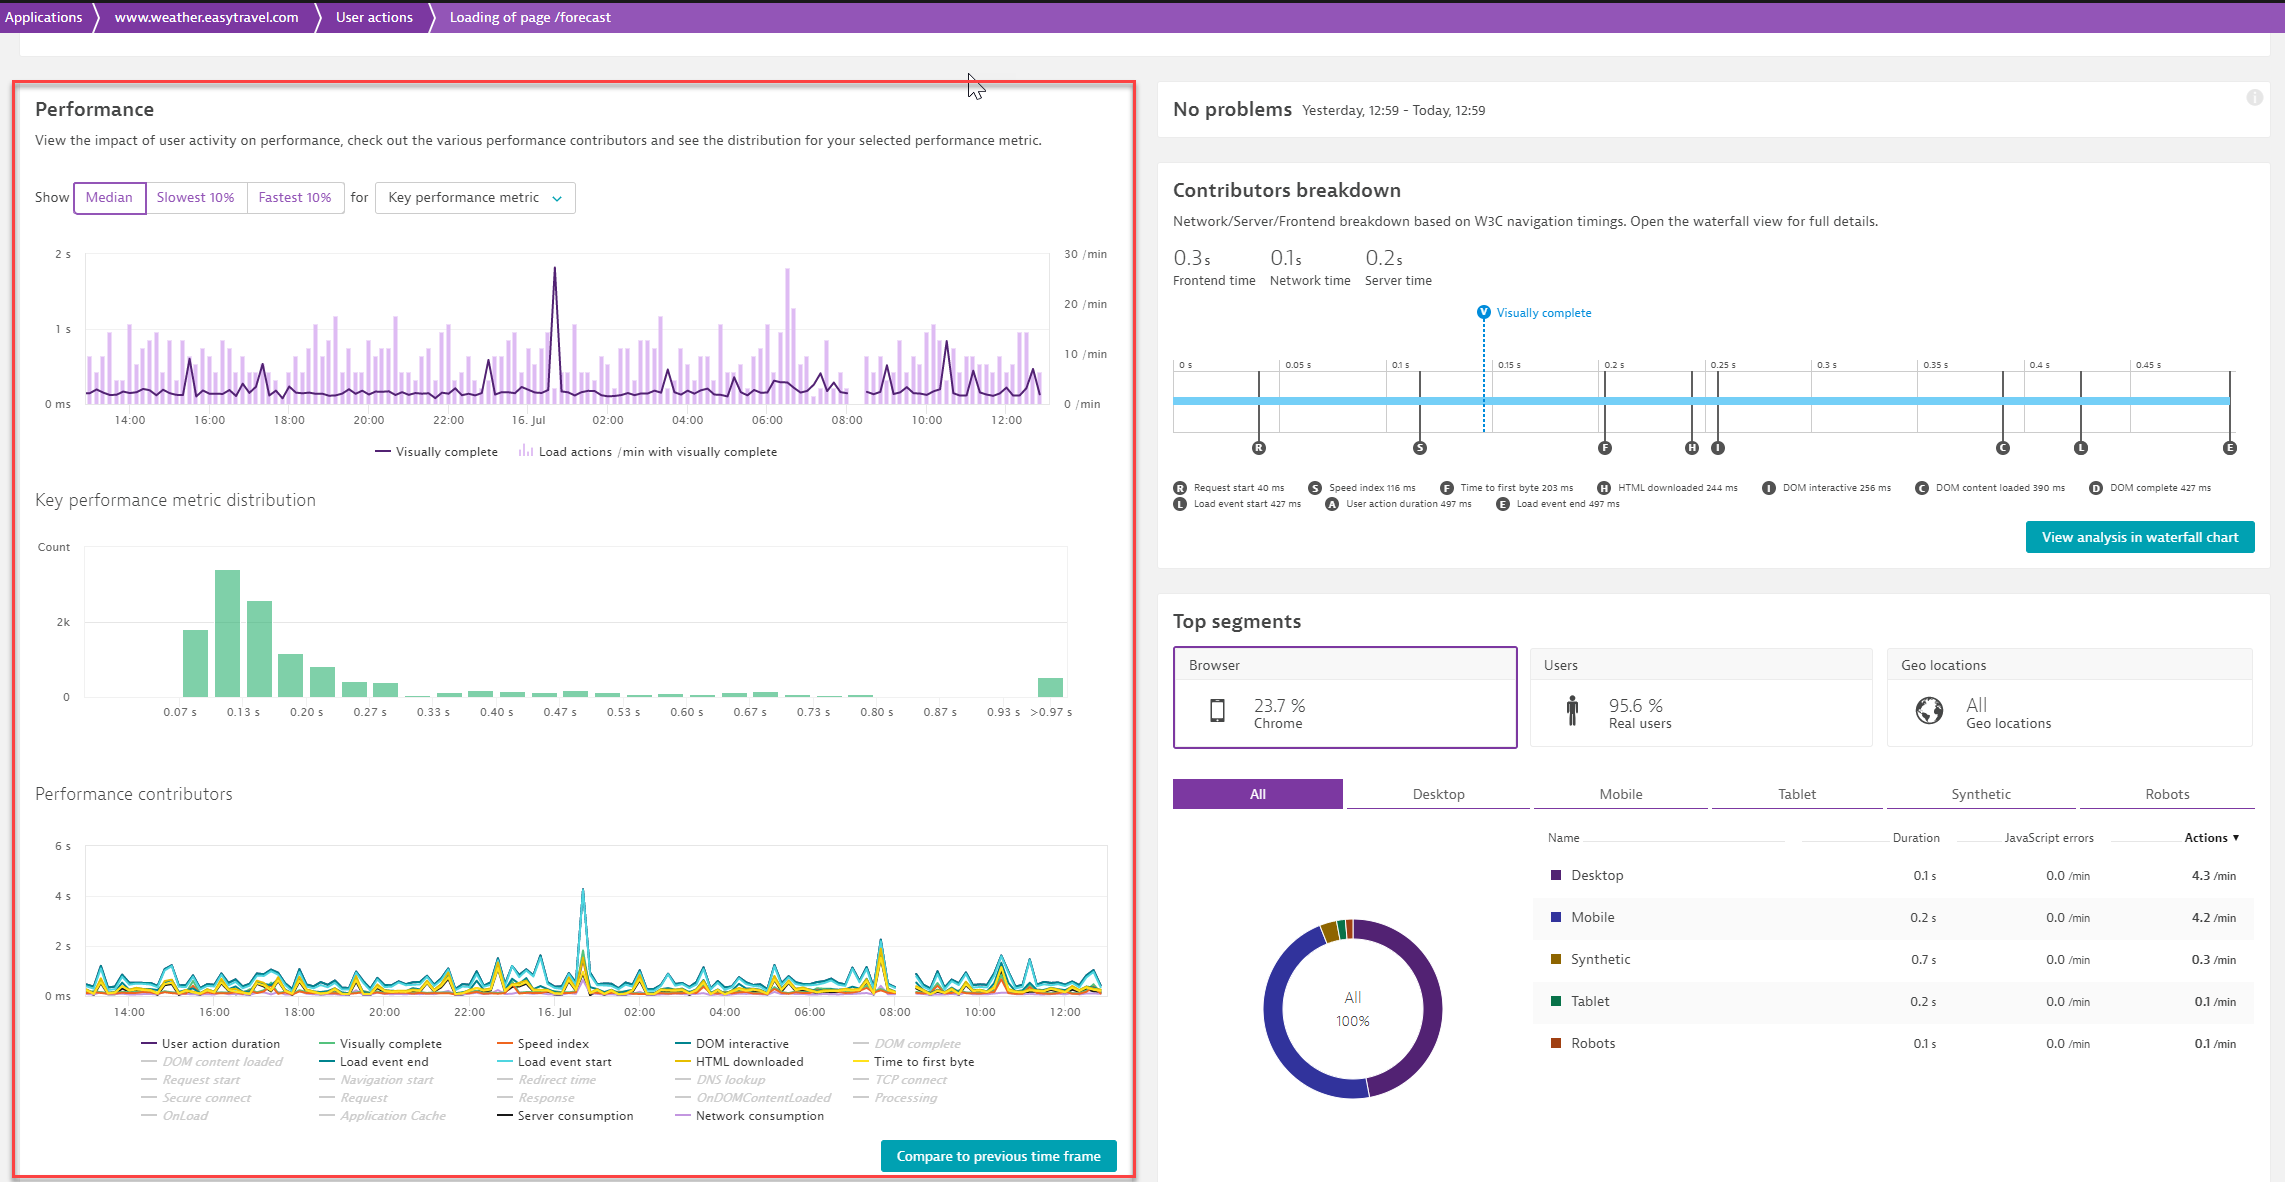
In the Performance section, you can view the impact of user activity on performance, check out the various performance contributors and see the distribution for your selected performance metric.
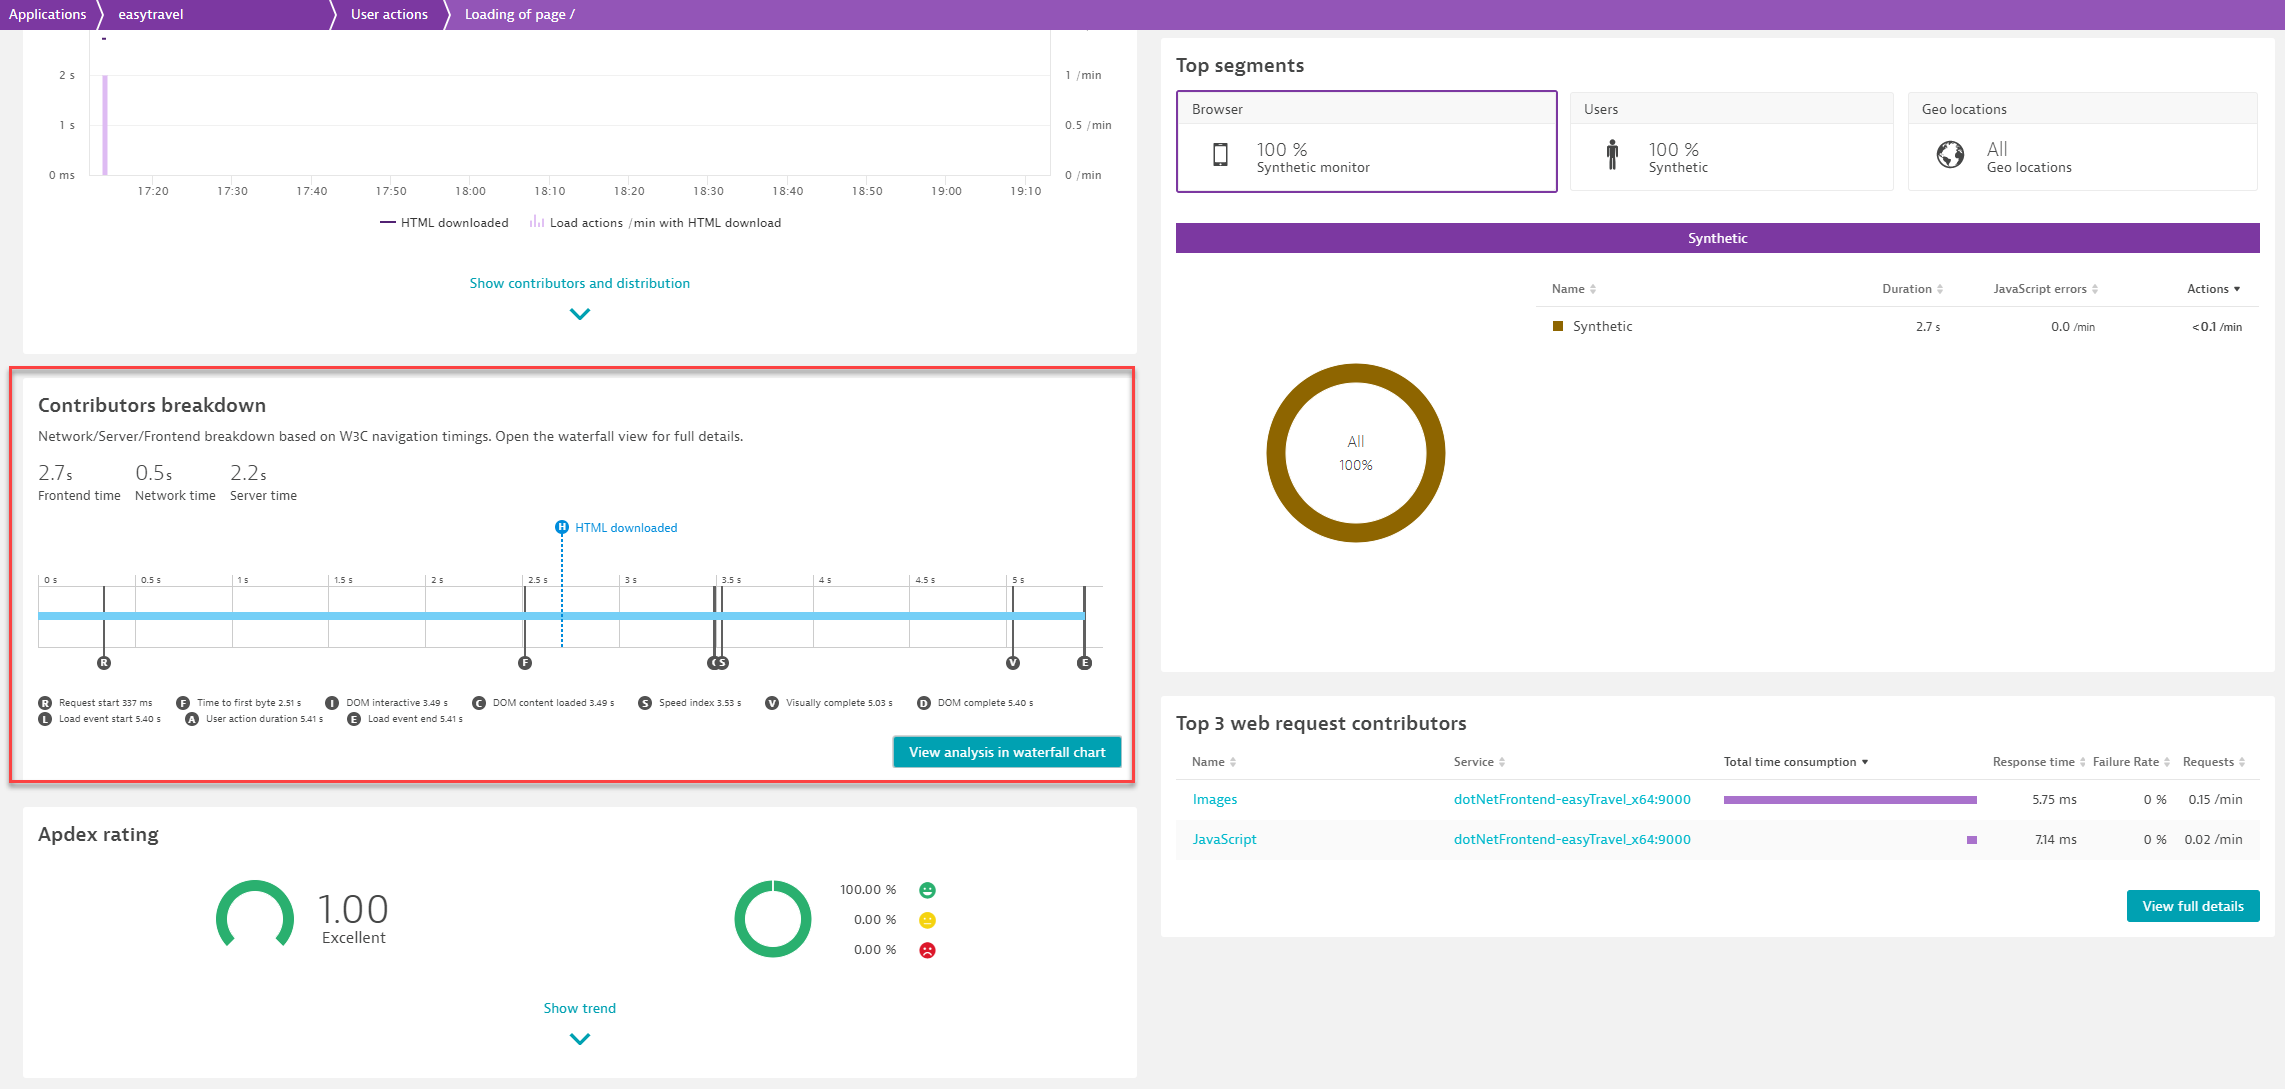
Contributors breakdown chart and waterfall analysis
When it comes to analyzing user actions, one of the main questions to address is on which tier is the most response time consumed? Was more time spent on the frontend (i.e., mainly in the browser), the network, or the server? The Contributor breakdown chart gives you a quick overview of time spent on the frontend, the network, and the server. For complete waterfall analysis of individual user actions, click the View analysis in waterfall chart button to see which resources impact the action duration.
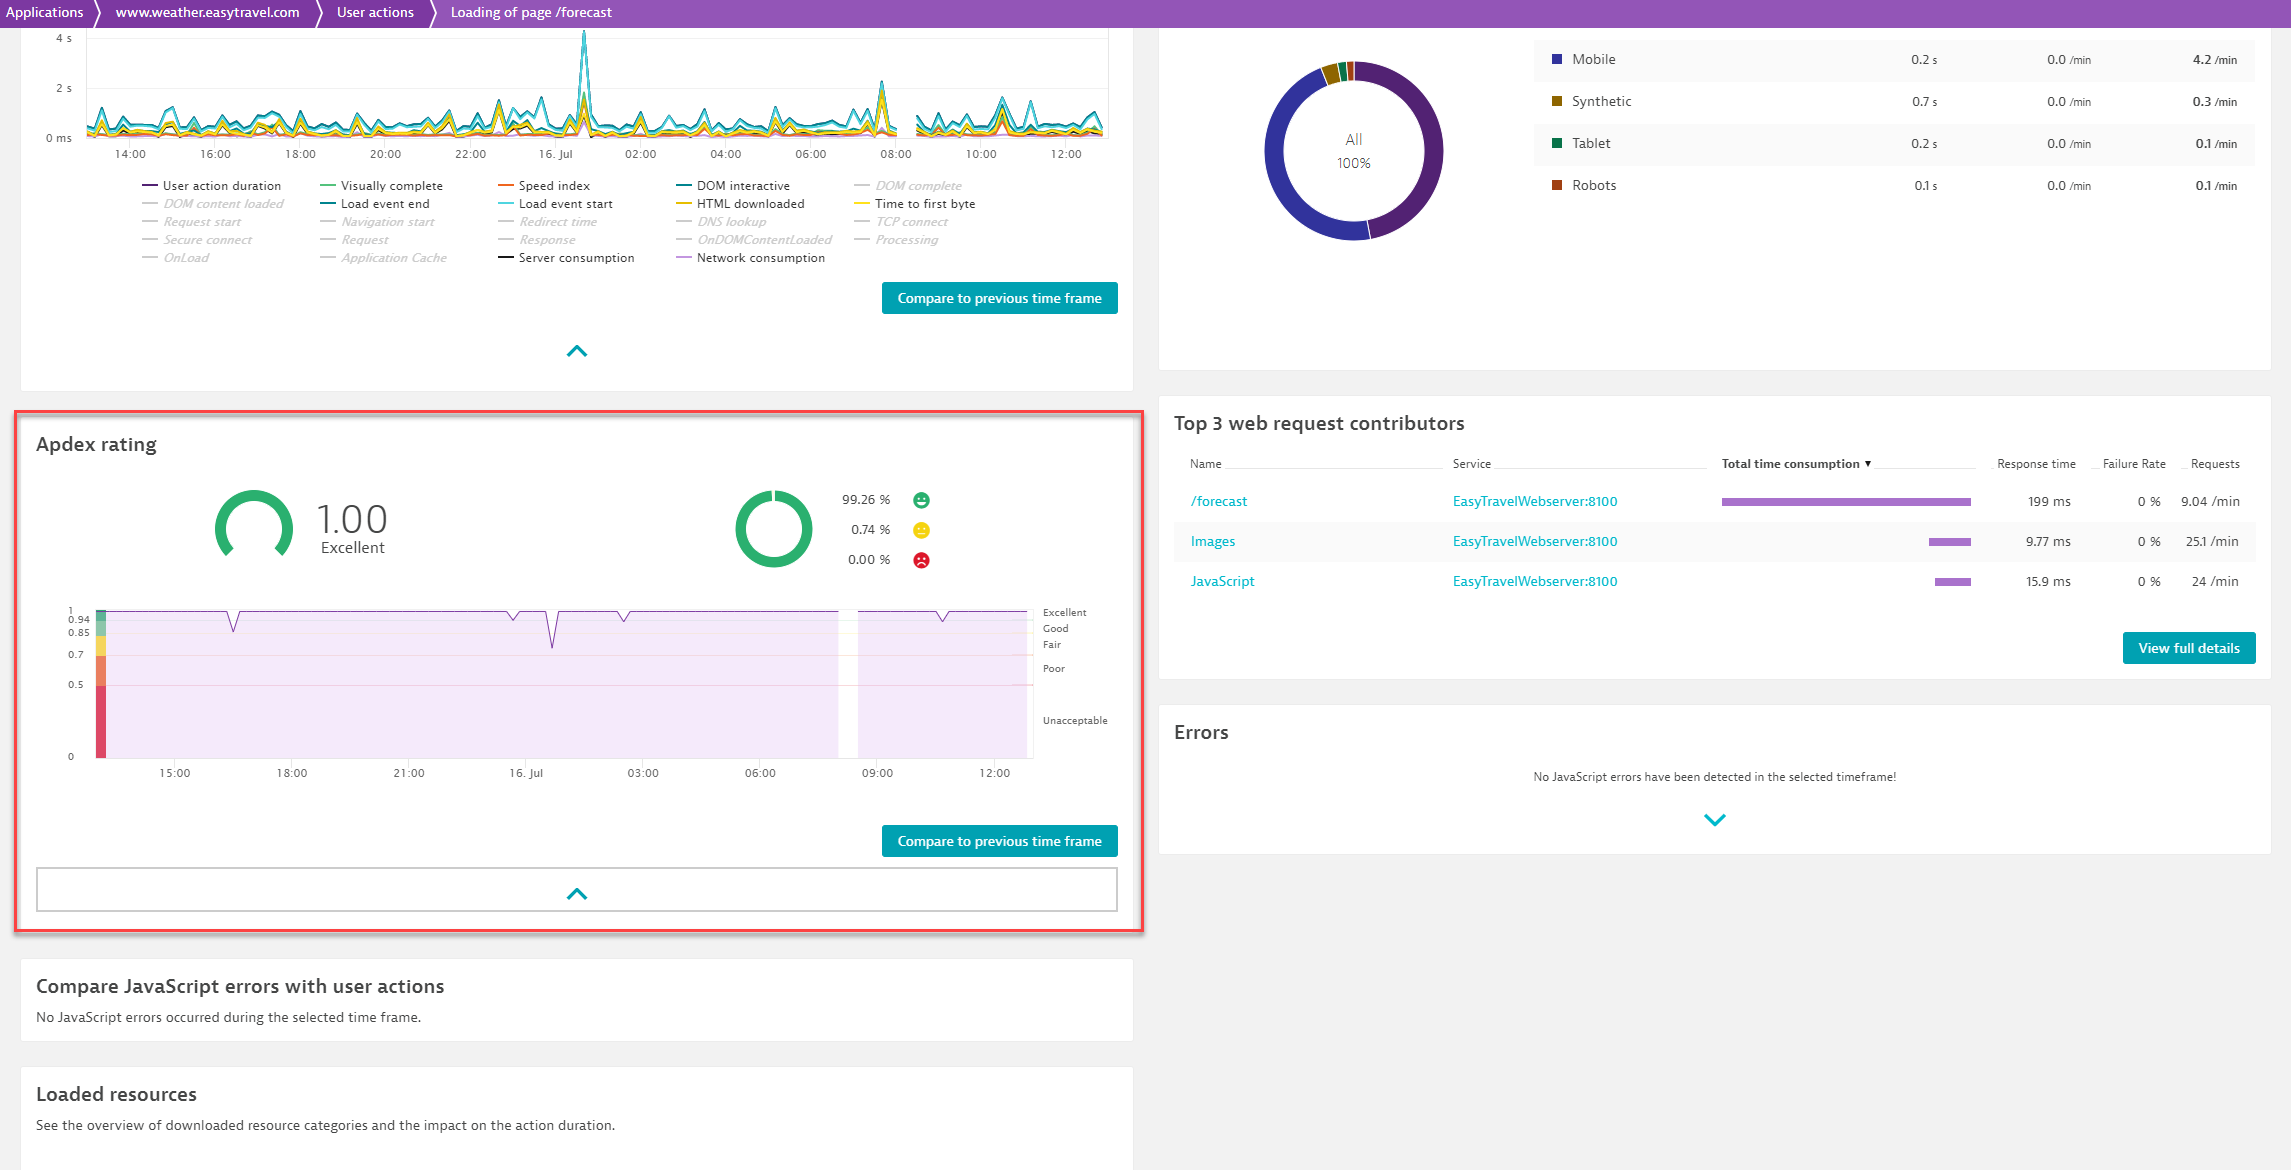
Apdex rating
DESK relies on Apdex ratings to calculate user satisfaction. By selecting Apdex rating, you can view the user satisfaction within the specified time frame for the specific user action.
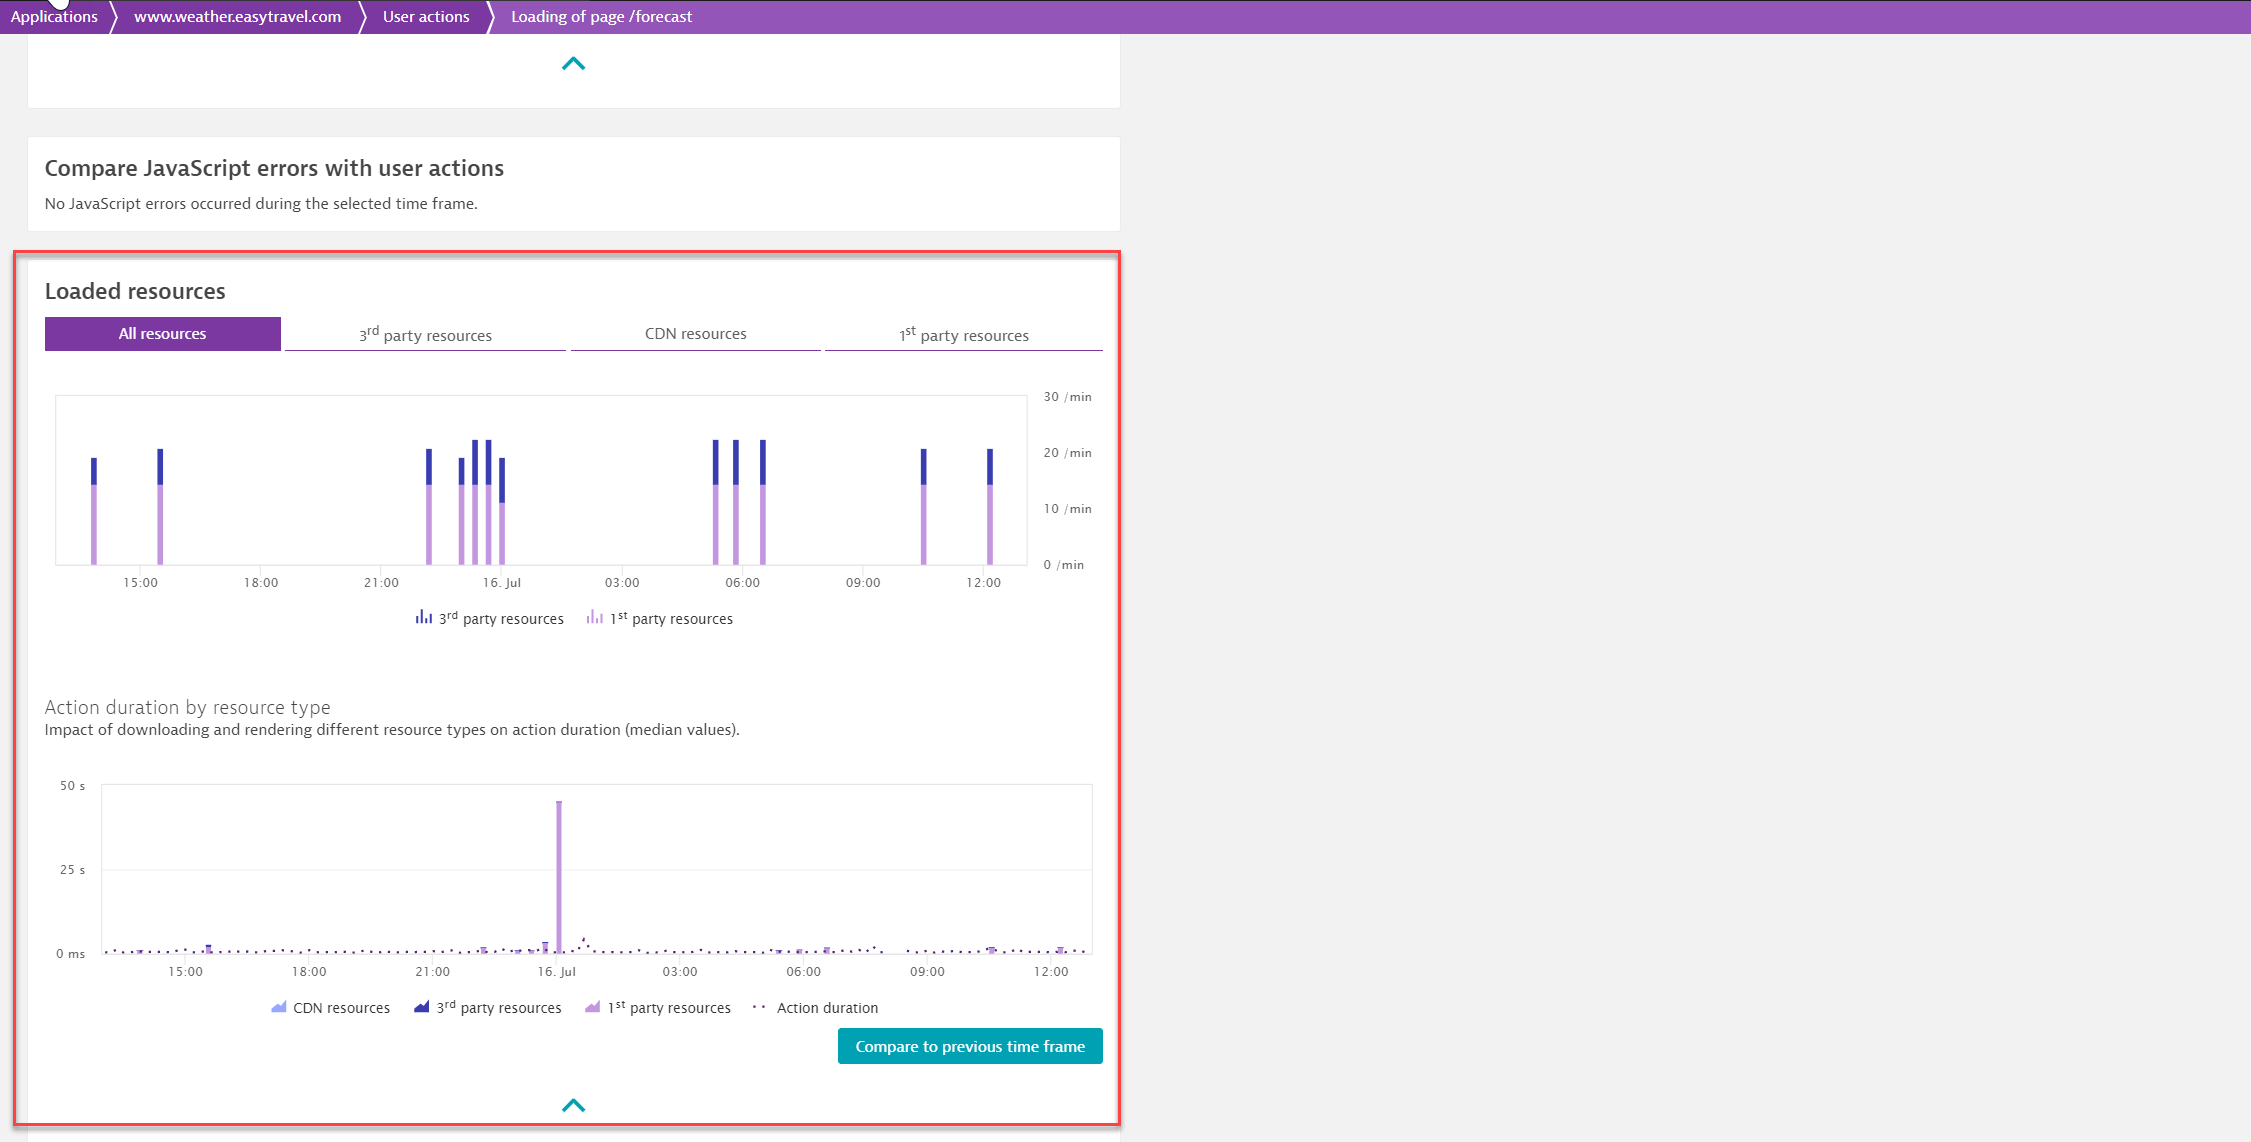
Loaded resources
The Loaded resources section provides an overview of downloaded resource categories and their impact on the action duration.
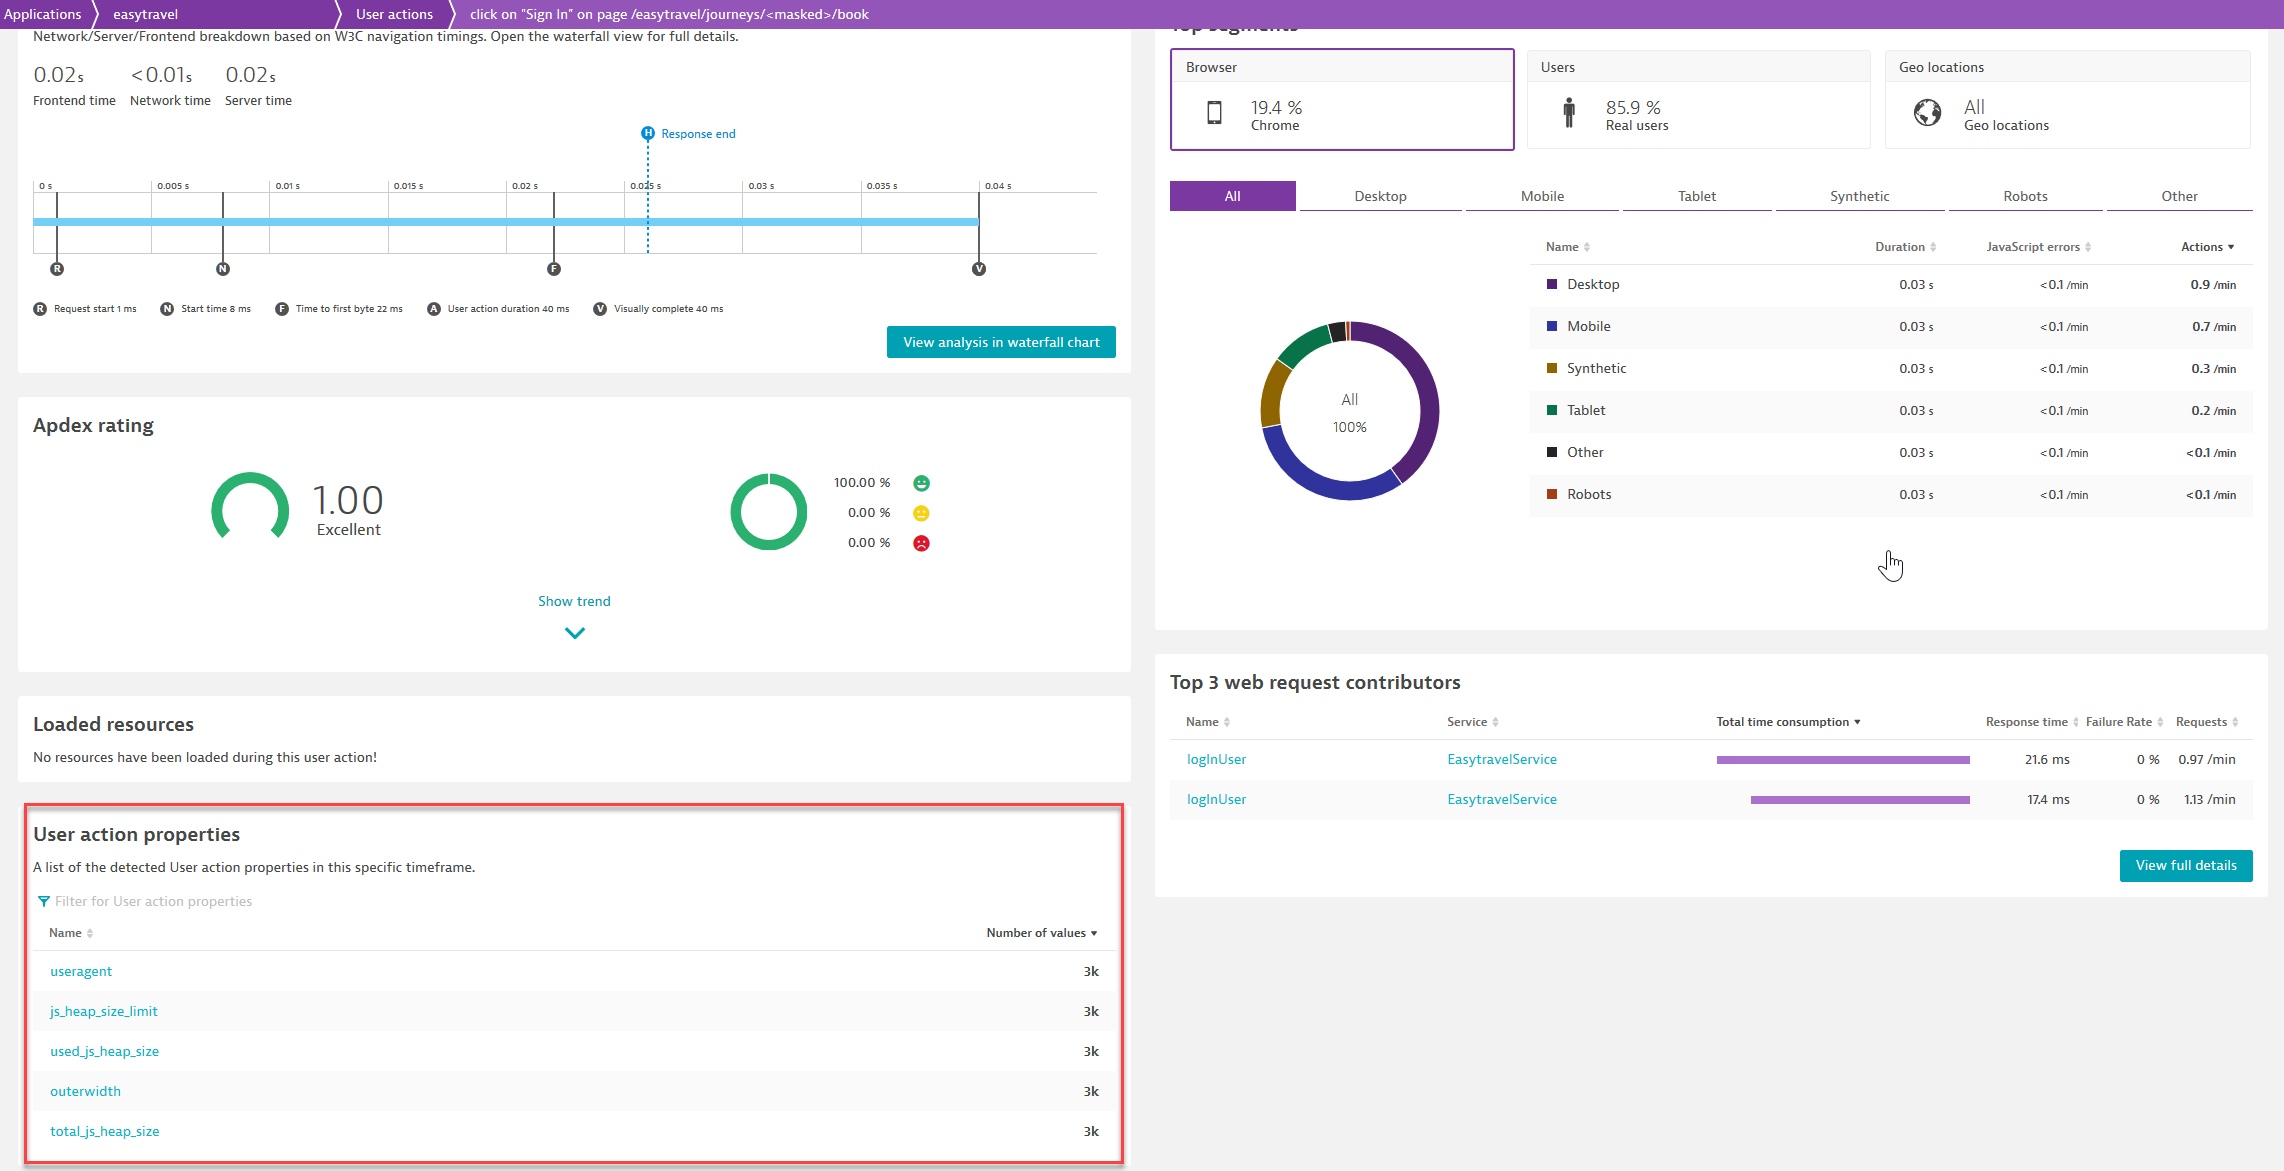
User action properties
This section lists the user action properties that you've defined for the specific user action. By clicking one property, you can view the data that have been captured via this property.
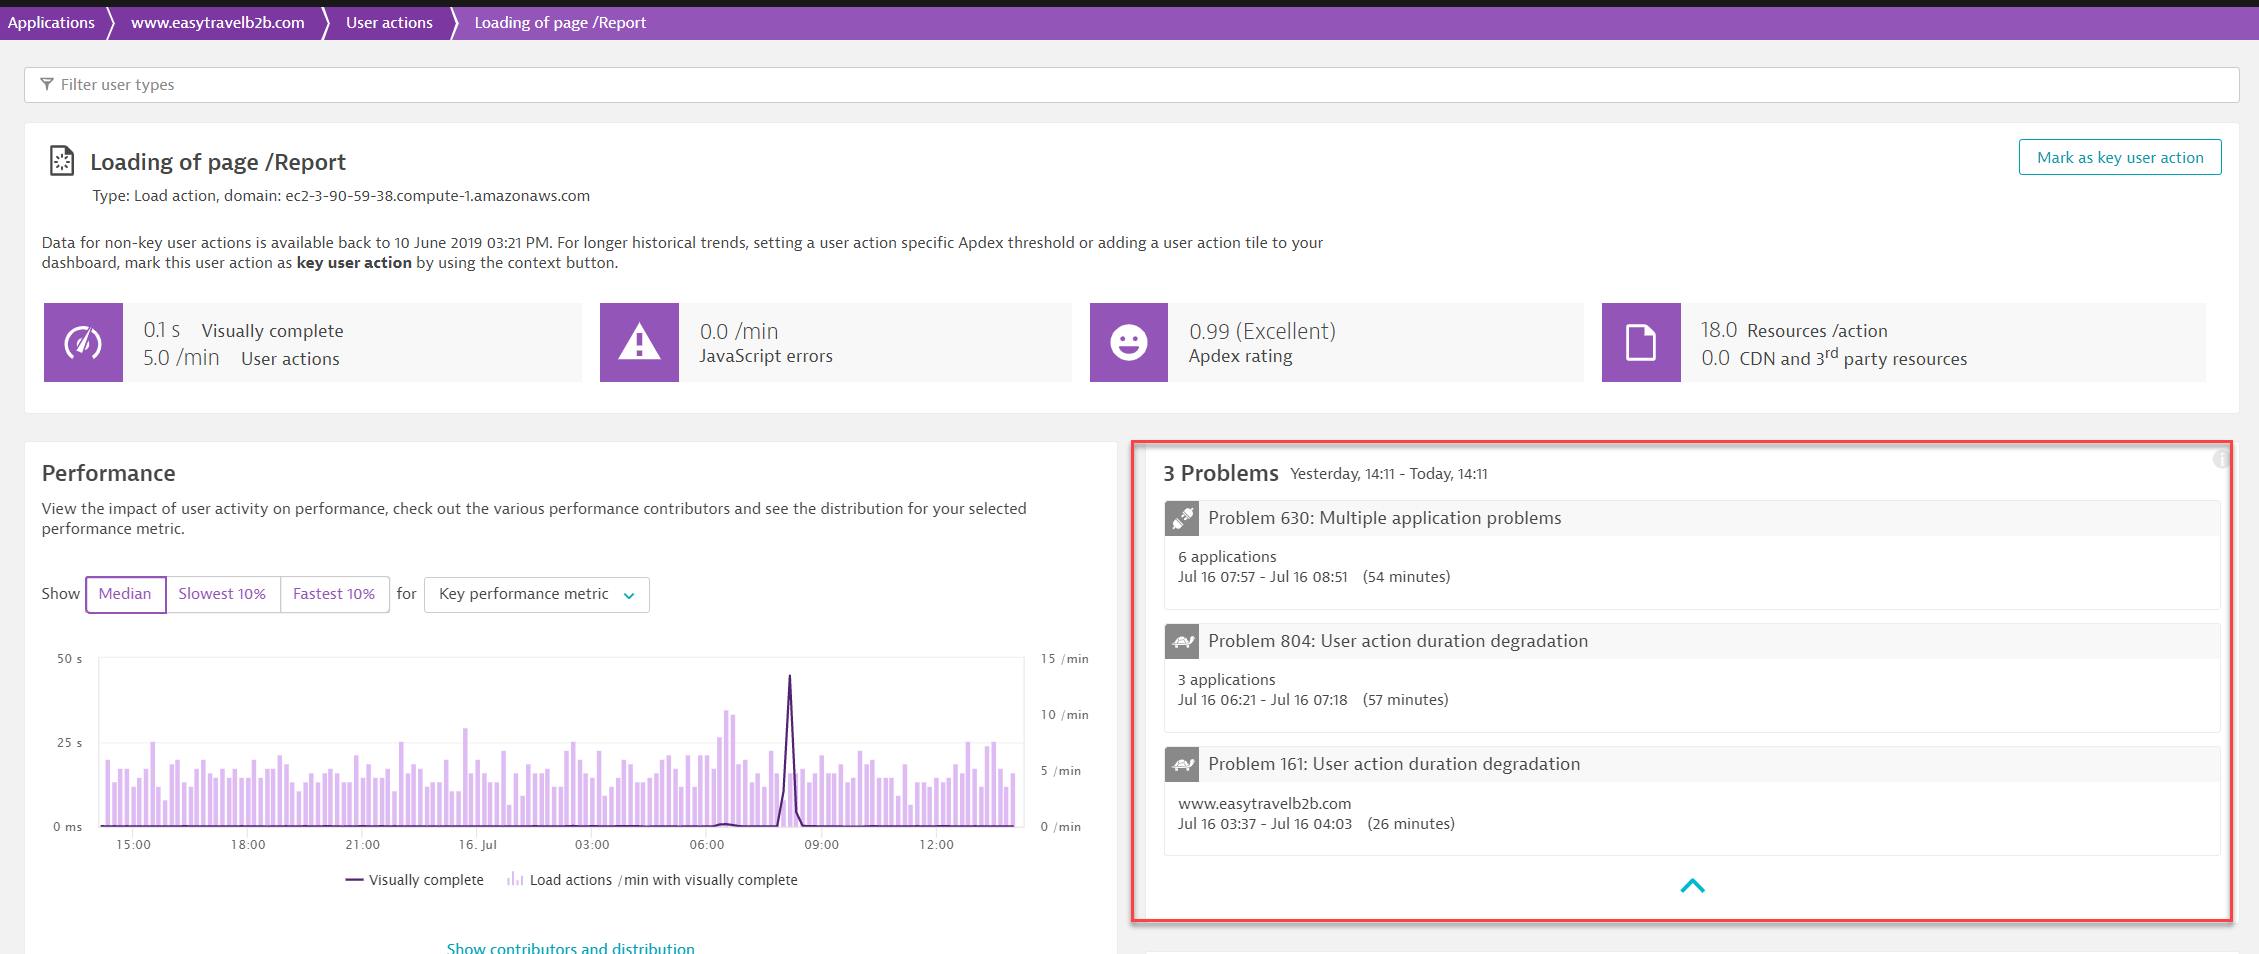
Problems
The Problems section indicates problems that have been automatically detected by Davis, i.e. the DESK AI-driven root-causation engine. Just click on a problem to learn further details.
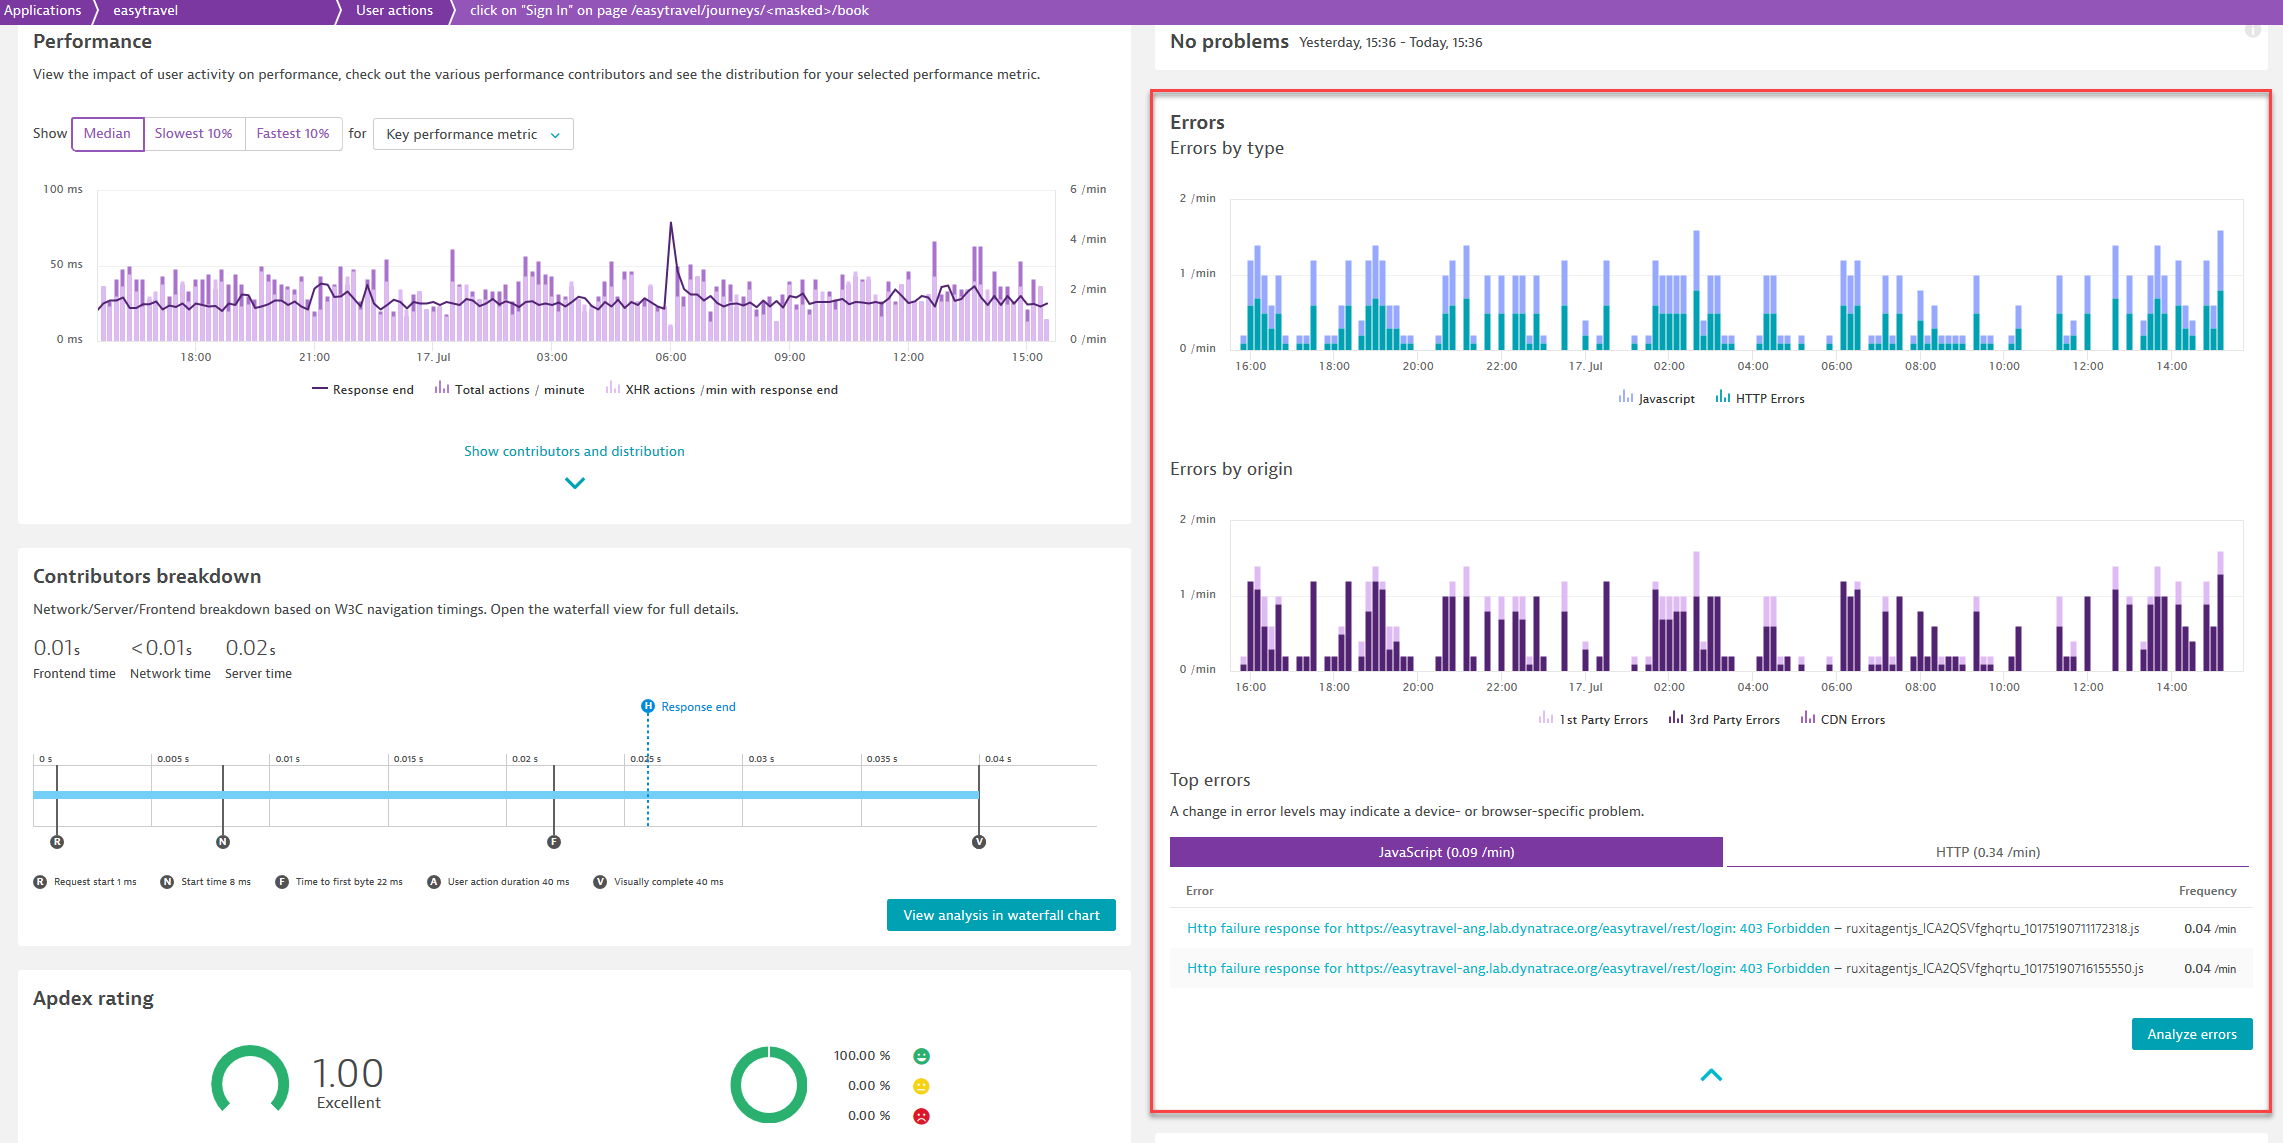
Errors
Select Errors to view error analysis from two different dimensions, error type (JavaScript vs. HTTP errors) and origin (whether they originate from 1st party, 3rd party or CDN).
You can also view the most frequently occurring JavaScript errors that happened on this user action during the specific timeframe. Click Analyze errors to navigate to the multi-dimensional analysis page, where you can perform a multi-dimensional analysis from the Errors perspective, combined with the type, context or origin dimension respectively. On this page, if you select a specific error from the Error list, you access the errors details page.
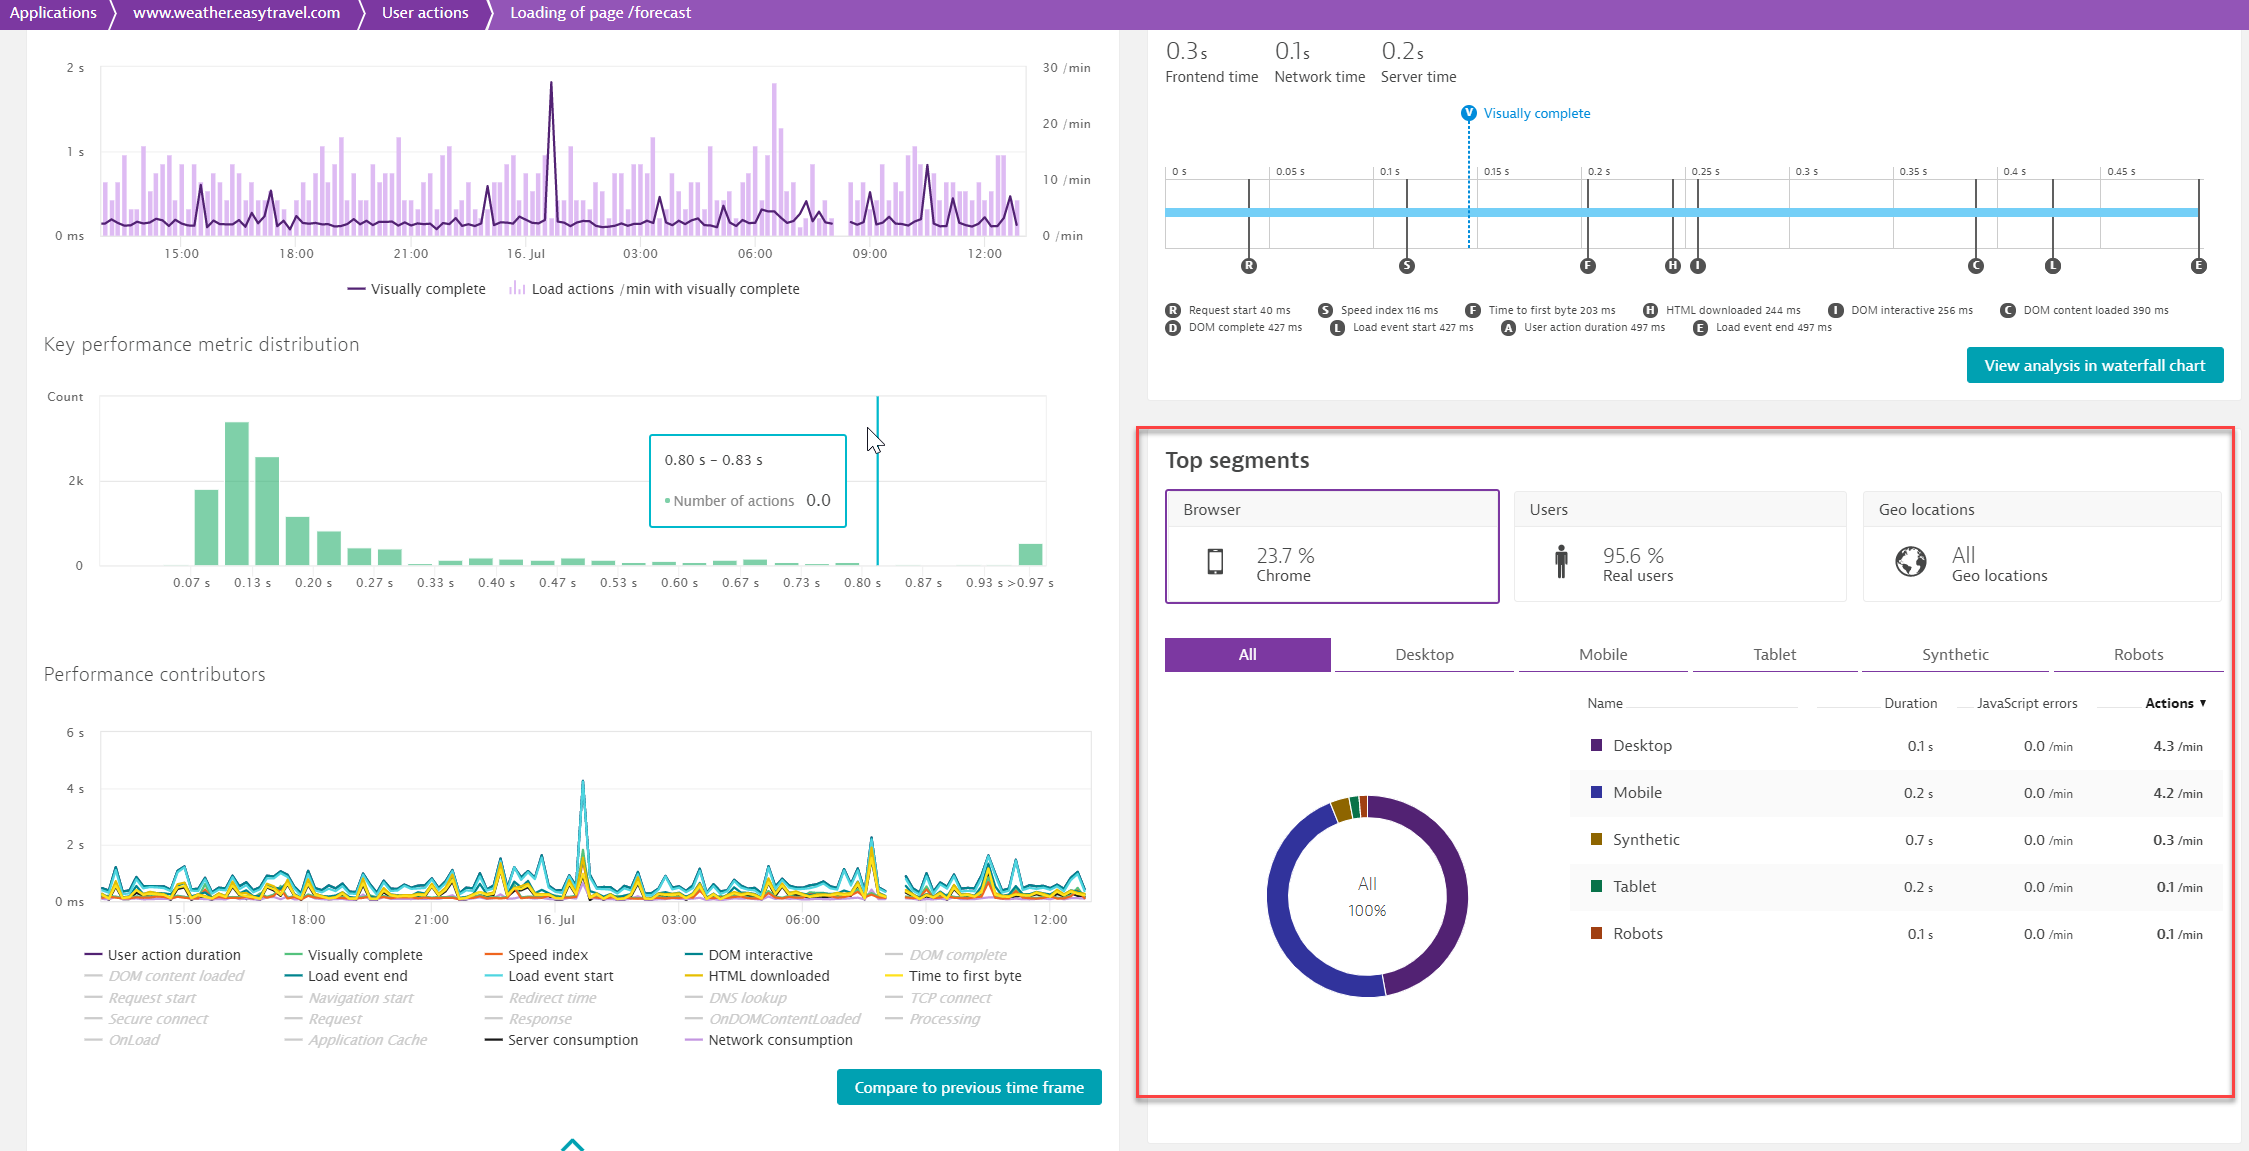
Top segments
This section includes a breakdown of Browsers, Users, and Geolocations and shows metrics for these dimensions for the specific user action.
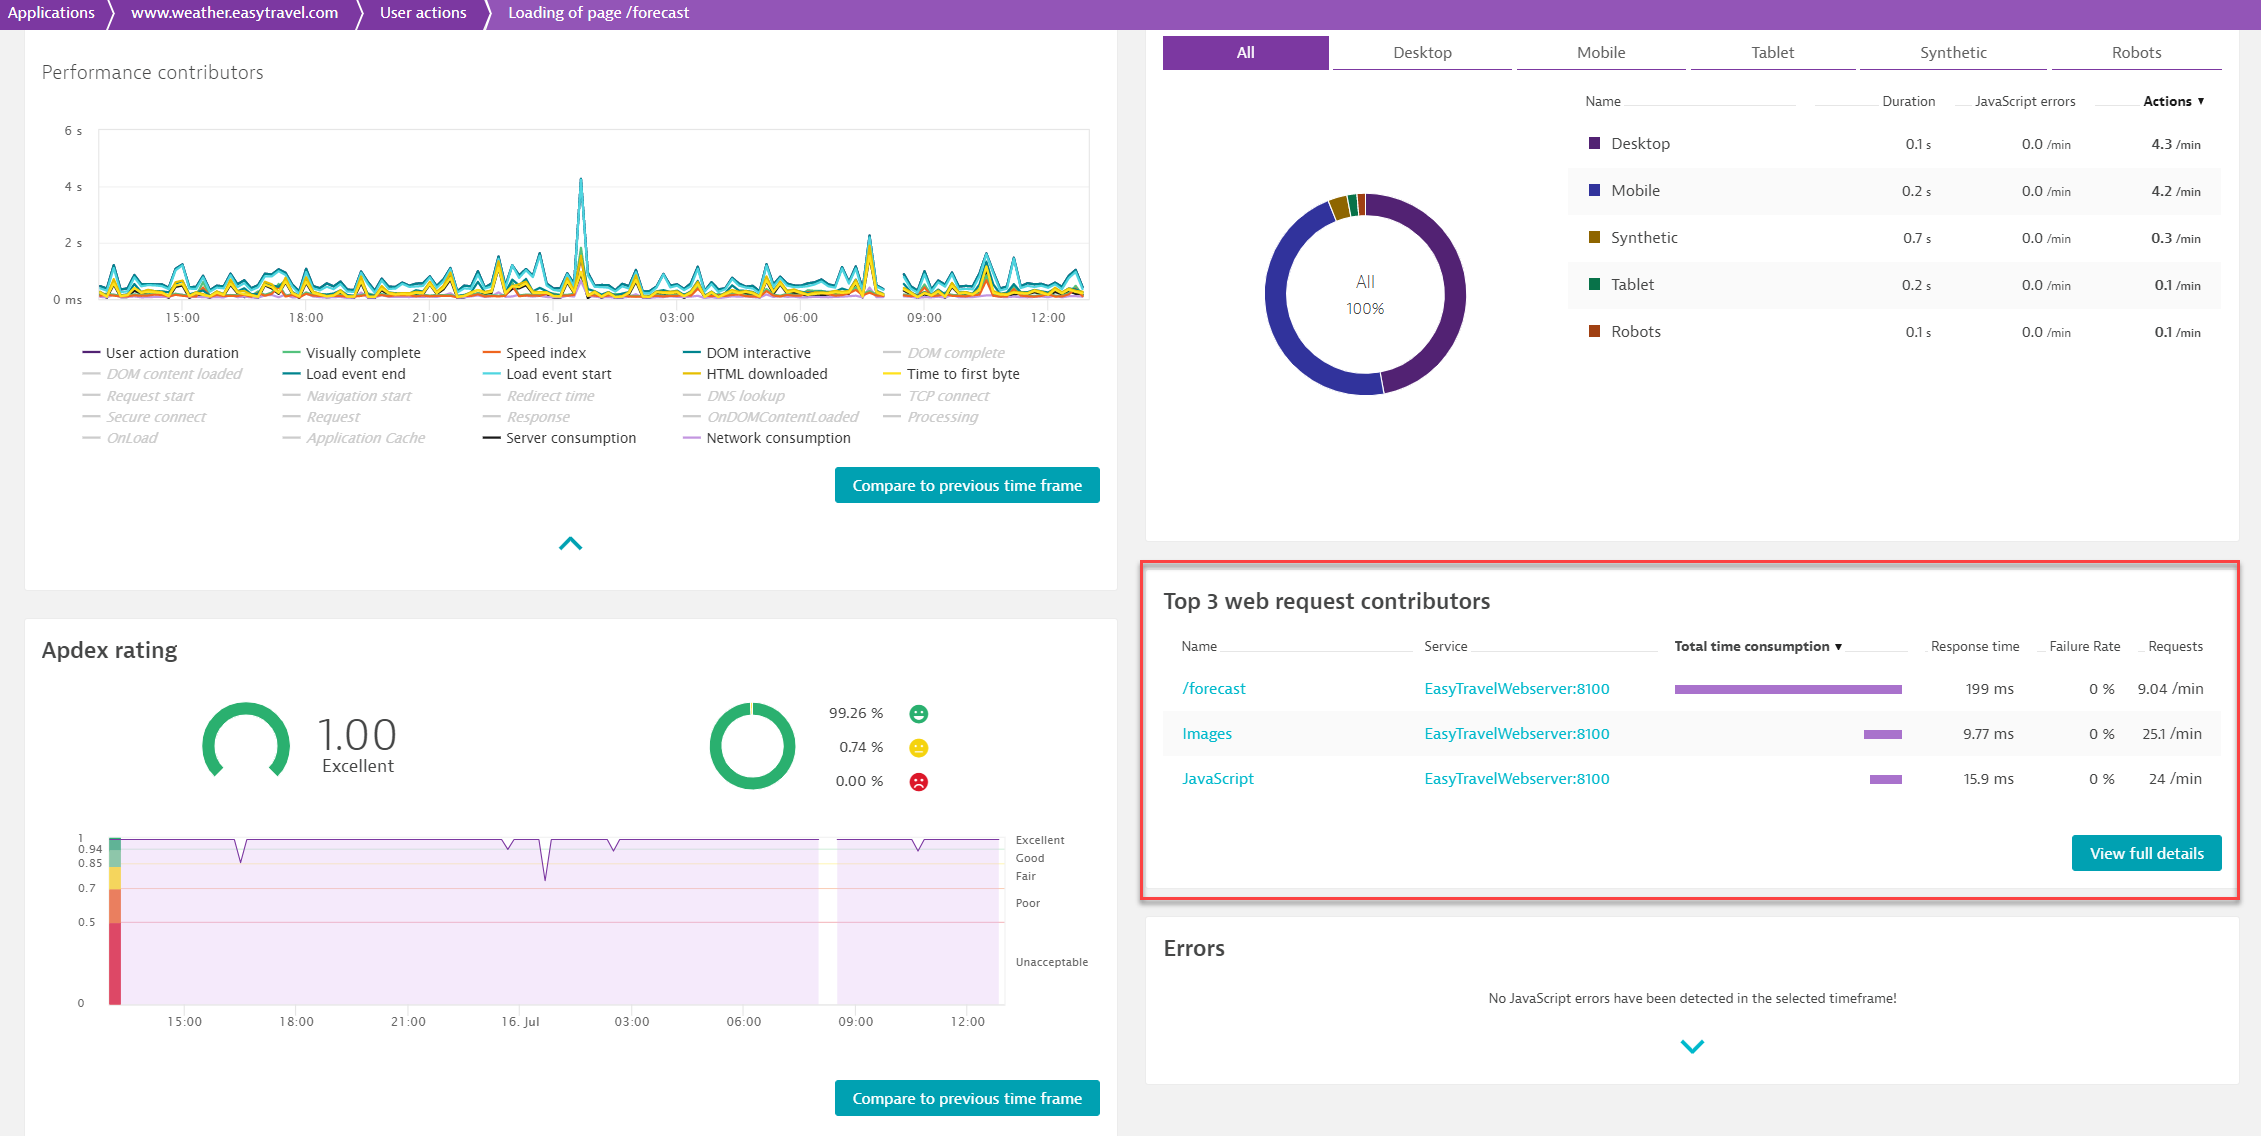
Top 3 web request contributors
This sections shows the three server-side services that consumed the highest total time (i.e., the Top 3 web request contributors). Click View full details to view the full list of web request contributors.
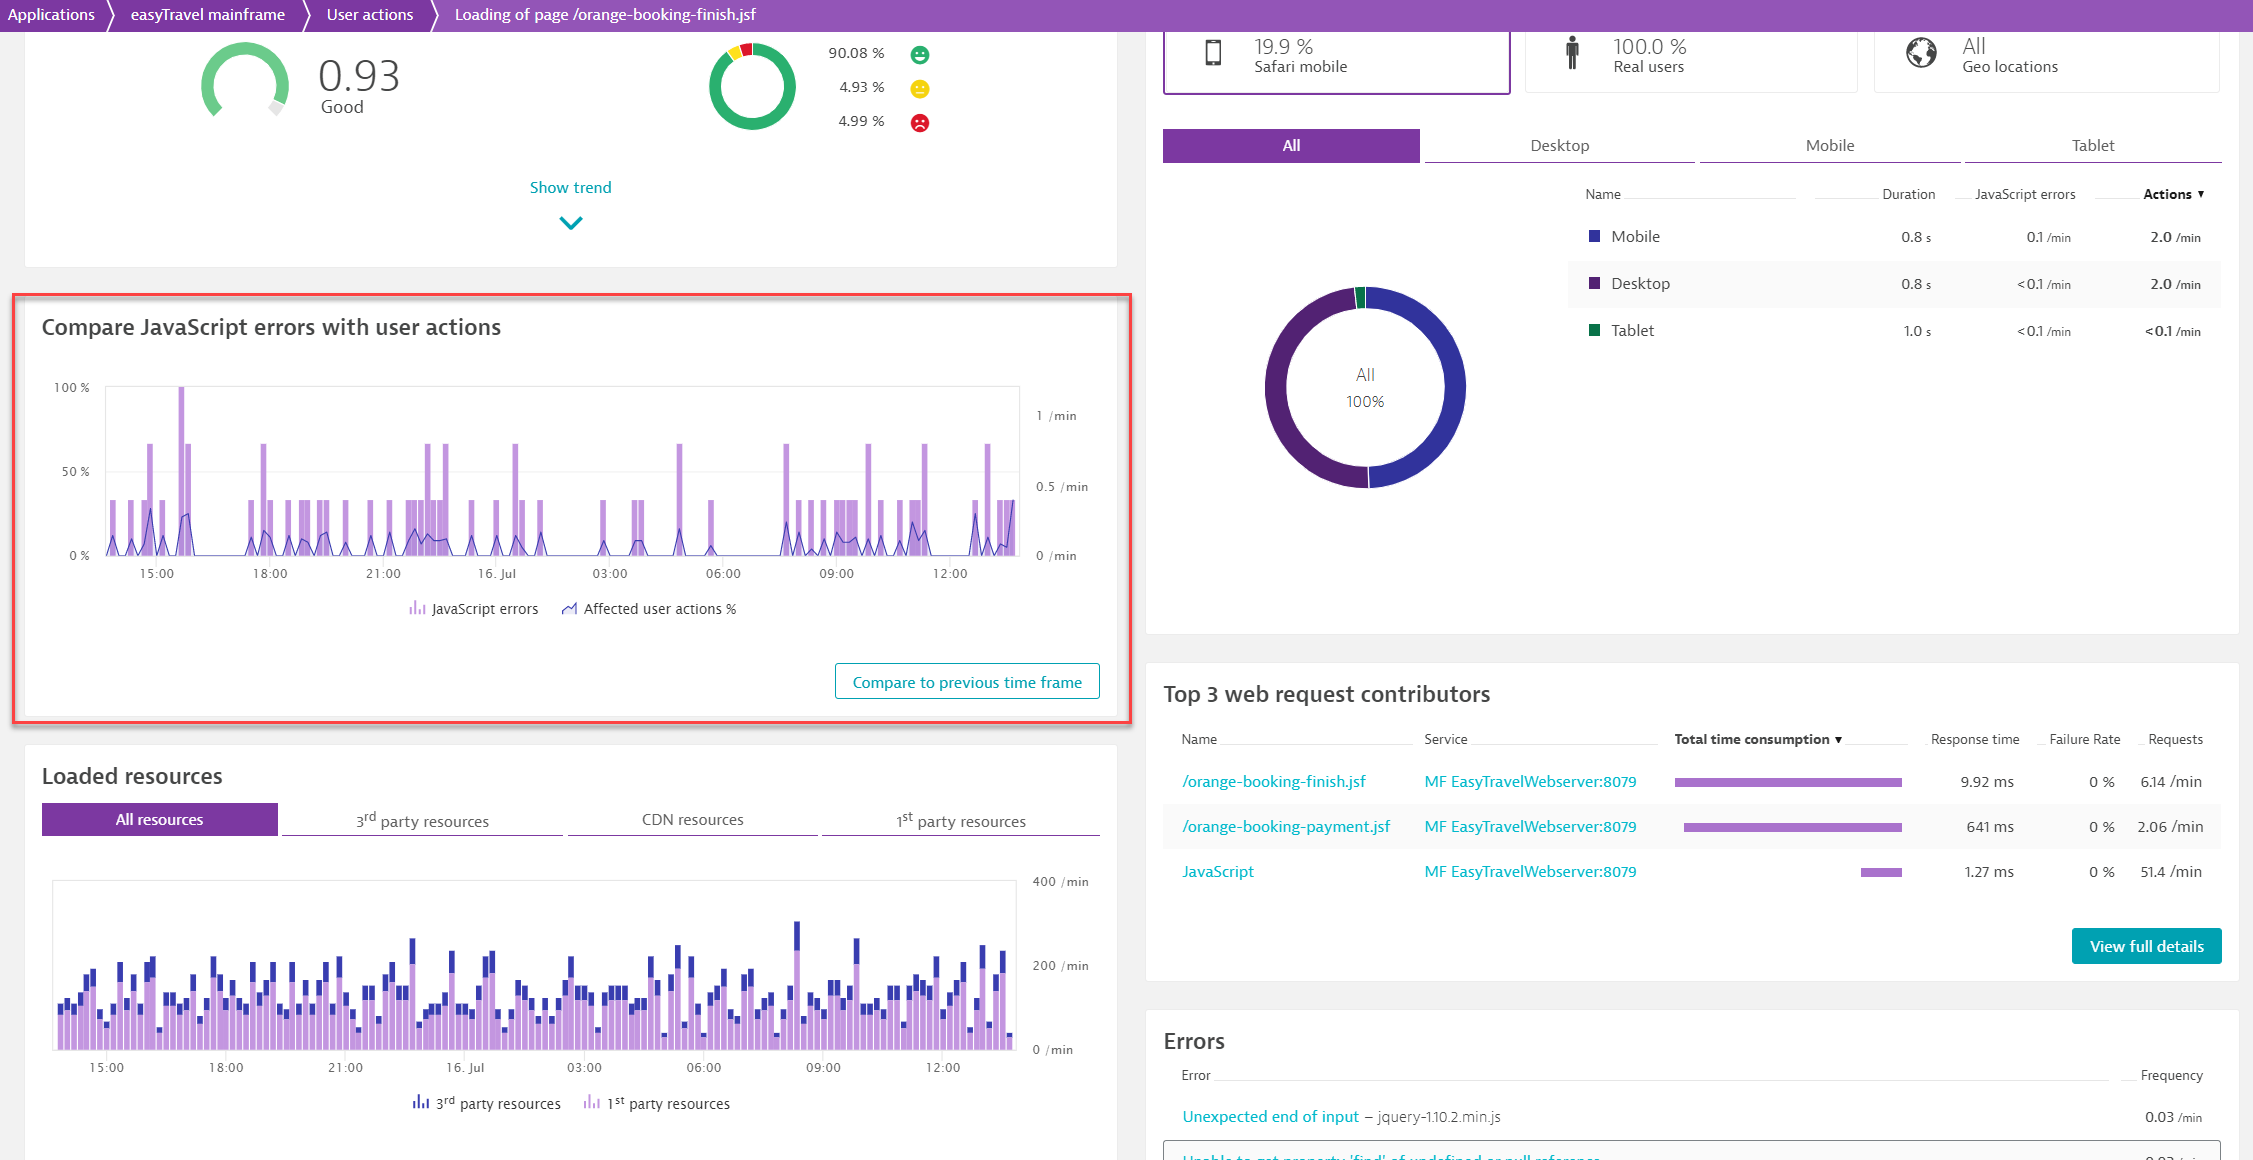
Compare JavaScript errors with user actions
This section shows the percentage of the user actions that were affected by JavaScript errors during the specified timeframe.