Configure HTTP monitors
DESK allows you to easily configure your HTTP monitors when first setting them up and at any time thereafter.
During HTTP monitor creation, configuration settings appear after you have clicked Create an HTTP monitor. These settings are a subset of the full set available in edit mode (described below) after the monitor has been deployed.
If you're creating a new HTTP monitor, see Create an HTTP monitor.
Prerequisites
HTTP monitors can be run from private synthetic locations or, starting with ActiveGate version 1.175, on DESK Managed from cluster-wide locations. See Installing synthetic-enabled ActiveGate for details on using ActiveGate for Synthetic Monitoring.
Starting with ActiveGate version 1.165, synthetic HTTP monitoring is available on all supported Linux distributions and Windows Server 2016. See Supported technologies and versions.
Configure an existing HTTP monitor
To configure an existing HTTP monitor
- Select Synthetic from the navigation menu.
- Select the HTTP monitor you want to configure.
- Click the browse (...) button and select Edit to display all editing categories.
- When you make changes, Discard changes and Save changes buttons are displayed at bottom right. Be sure to save your changes when you're done editing your monitor.
Monitor setup
On the Monitor setup page, you can:
-
Review and change the name of the monitor (up to 500 characters).
-
Assign your HTTP monitor to one or more web applications.
This setting is available in edit mode only.
If this synthetic monitor is associated with one of your monitored web applications, you can assign the monitor to the application so you can track application availability and performance. Detected problems are then automatically associated with your application. If monitor status is unavailable, the associated application is also considered unavailable.
Click Assign monitor to application and select an application from the drop-down list. You can assign a monitor to multiple applications, and an application can have several assigned monitors. Click Connect another application to add an additional application.
HTTP Requests
In the HTTP requests section, you can edit and add HTTP requests that the monitor sends to your website.
- Click Add HTTP request to add another HTTP request to the HTTP monitor.
- Click an existing HTTP request to display editing options for that request.
Basic request settings
Verify the basic request settings:
-
HTTP request URL—In addition to the URL, you can specify values set in scripts.
-
HTTP method—For each request you create or edit, start with the HTTP method of your monitor, because the set of monitor parameters depends on this selection. Supported HTTP methods are:
- GET
- POST
- PUT
- DELETE
- HEAD
- PATCH
- OPTIONS
-
User agent (optional)—The user agent of the request.
The default user agent is in the format
DESKSynthetic/{version}, where{version}is the current version of the ActiveGate the HTTP monitor is executed from. However, even if a custom user agent is defined, DESK always automatically addsDESKSynthetic/{version}to the user agent to make sure that synthetic traffic can be identified.
Additional options
Adjust the Additional options settings as needed.
| Option | Description |
|---|---|
| Enable pre-execution script | If you enable this, an edit box is displayed for you to enter a script that will be executed just before the request is triggered. For more information, see Pre- and post-execution scripts for HTTP monitors. |
| Enable post-execution script | If you enable this, an edit box is displayed for you to enter a script that will be executed just after the request is triggered. For more information, see Pre- and post-execution scripts for HTTP monitors. |
| Authentication | To automate the login process for password-protected sites, set Authentication to Basic authentication and enter your Username and Password.
|
| Add client certificate | Use this option to enable client-side certificate authentication. If you select this, you'll need to browse for and select a certificate file. |
| Set additional HTTP headers | The monitor is created with a bare minimum set of headers required by the protocol. To enable custom headers:
|
| Request body | You can send a payload with your POST, PUT, DELETE, and PATCH requests. Specify the request body format and contents:
|
| Set rules for response validation | Response validation helps you verify that your application loads the expected content by checking if the response contains certain text.
|
| Follow redirects | By default, an HTTP monitor follows up to 10 redirects from an original request until it reaches the final destination. Turn this option off to monitor only the first response of the redirect chain. |
| Accept any SSL certificate | By default, HTTP monitors accept any SSL certificate, regardless of whether they're valid. Turn this option off to have the monitor fail with invalid SSL certificates. |
Frequency and locations
Two factors make up your monitoring schedule:
- Monitor my website every n minutes determines how frequently your HTTP monitor runs from each location: every
1,2,5,10,15,30, or60minutes. - Location selections specify the locations from which the monitor is executed.
Together, these factors determine how often your HTTP monitor runs each hour. For example, if you select three locations and set Monitor my website every n minutes to 15, the result will be 12 monitor executions each hour (4 times per hour from each of 3 locations).
Outage handling
This setting is available in edit mode only.
These options determine what to do in the event of availability outages. You can disable both settings, which may be useful if you're testing a volatile site or you have scheduled downtime that you don't want to be alerted about.
-
Generate a problem and send an alert when this monitor is unavailable at all configured locations
With newly created browser monitors, this is enabled by default. It alerts you of a global availability outage when all locations experience an outage simultaneously. -
Generate a problem and send an alert when this monitor is unavailable for one or more consecutive runs at any location
This allows you to raise a problem when there are consecutive failures at one or more locations.In the example below, a monitor is configured for
4locations, and a problem will be generated if3of those4locations are unable to access your site during two or more consecutive runs.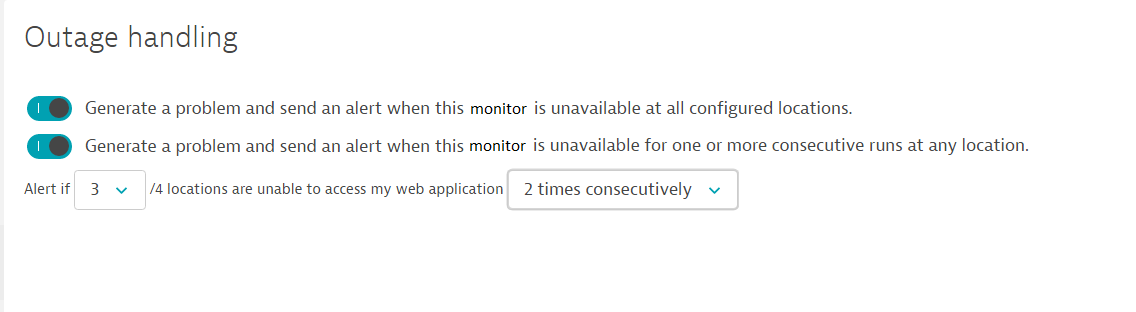
Retry on error is not available for HTTP monitors.
Performance thresholds
Use performance thresholds to receive a notification when the response time is unusually long. This enables you to be proactive about site latency.
- Set Performance thresholds enabled to the On position.
- Set HTTP request to one of the requests in your monitor or to Sum of all requests.
- Set Threshold value to the threshold time in seconds. If the response time exceeds this threshold:
- A problem is generated.
- You are notified as defined in Settings > Integration > Problem notifications.