Measures for host health
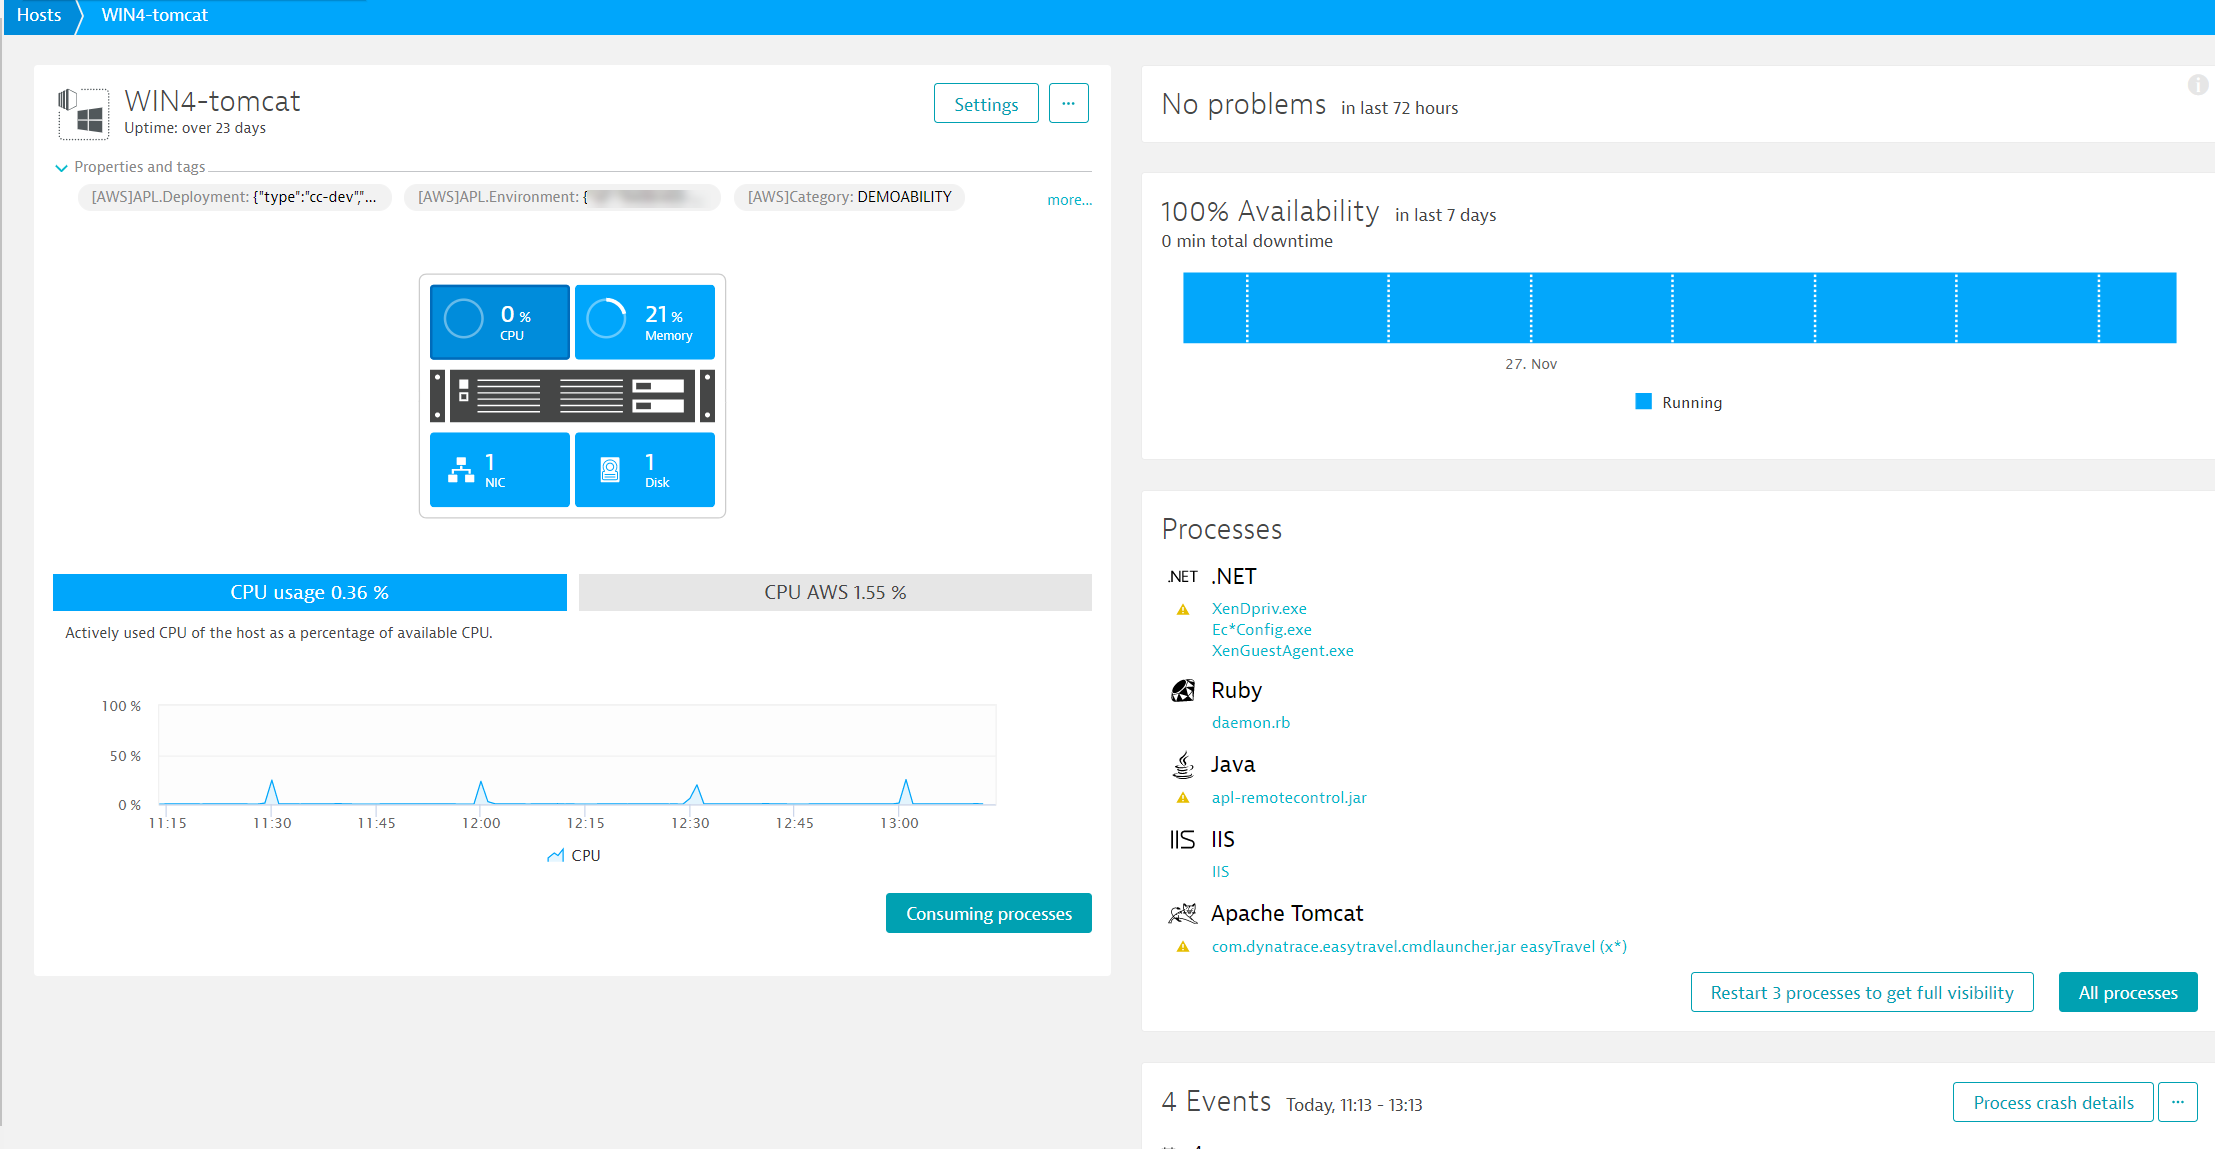
Individual Host pages show problem history, event history, and related processes for each host. To assess health, the following performance metrics are captured for each host and presented on each Host overview page:
- CPU
- Memory
- Disk (storage health)
- NIC (network health)
CPU health
CPU usage is the primary measurement used to calculate CPU health. This is the percentage of time that a CPU is busy processing data (i.e., when it's not idle). This percentage is computed for all available CPU cores and scaled to a range of 0–100%.
The same calculation method is used for both total CPU usage of a system and CPU usage of a specific process group. This means that a process group that's composed of a single threaded process on a 4-core system will reach maximum CPU usage at 25% (4 x 25% = 100%).
A high CPU usage measurement results in a CPU saturation "resource event" and the generation of a problem.
CPU usage measurements are captured every 10 seconds. The average CPU consumption of each 10-second interval is used to calculate total CPU usage. Because DESK averages CPU consumption across 10-second intervals, momentary fluctuations in CPU consumption which happen during the 10-second cycle may be flattened out, but the average CPU consumption over each of the 10-second periods is accurate.
Memory health
Host pages include two memory-related metrics for your hosts, Memory used and Page faults. Both measurements and other factors, are used to correlate and calculate host high memory incidents.
-
Memory used
Percentage of total RAM used by processes. RAM used by system caches and buffers isn't included in this metric. DESK calculates memory usage as:
memory_used = total_memory_size - (free_memory + active_memory + inactive_memory + reclaimamble_memory) -
Page faults
Number of major page faults per second. Major page faults involve loading a page from disk, thereby adding disk latency to the interrupted program’s execution.
Disk health
Disk health includes:
-
Throughput
The total number of bytes read and written to disk per second. -
IOPS
I/O (input/output) operations per second. Operations are counted after operations addressing adjacent disk sectors are merged. -
Disk latency
Time from I/O request submission to I/O request completion. The average delay of disk read and write operations in milliseconds. This metric is used to detect host slow disk incidents. -
Disk space usage
The amount of disk space that's been used. -
Idle time
Amount of time the disk has been idle.
NIC health
NIC health includes:
-
Traffic
The average rate at which data was transmitted during the interval. -
Packets
The number of received and sent packets over the host network interface during the interval. -
Quality
The assessment of the number of dropped packets and errors. -
Connectivity
Percentage of properly established TCP connections compared to TCP connections that were refused or timed out.
Note: The Connectivity measure can be used as an indicator of whether or not there's network traffic on a host. Please note however that 0% connectivity doesn't necessarily indicate that there is a problem with a host. Assuming no TCP errors are present, it may simply mean that no users have attempted to connect to the host process during the selected timeframe.