Service quality reports
Each service quality report summarizes the monitoring insights that DESK has compiled over the past week. Each report offers an overview of your applications, services, infrastructure utilization, performance problems, and the impact of performance problems on your customers.
While DESK itself is an ideal tool for day-to-day monitoring purposes, reports give you insights into hot spots in your environment and make it easy to share insights with others.
To view service quality reports, select Reports from the navigation menu and then click Service quality from the left-hand menu. Service quality reports are chronologically arranged, with the most recent report appearing first. Select any report you're interested in to view further details.
Reports are structured in such a way that even non-technical team members can understand them. Reports include four sections: overall environment, applications, services, and infrastructure. For each report section we calculate a score to show you how well your monitoring stack components have performed over the past week.
Note: Service quality reports address service quality across the entire environment. Therefore, you need to have access to the entire environment to view these reports. Analyzing and persisting the required aggregated data per Management zone isn't possible.
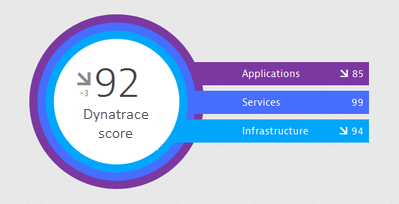
Overall DESK score
Your overall DESK score is an average of the application, services, and infrastructure scores for your environment. For example if your individual scores are Applications: 85, Services: 99, and Infrastructure: 94, then your DESK score is 92 (278/3).
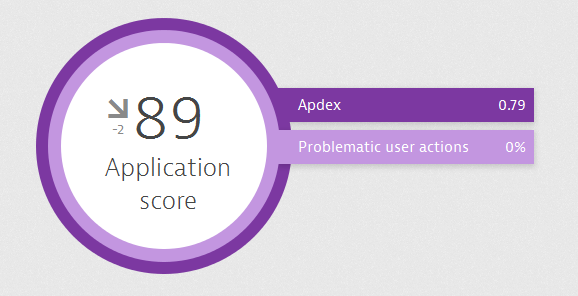
Application score
Application scores are based on application Apdex ratings. In brief, the Application score is the average of your application Apdex value and the percentage of user actions that are not affected by problems.
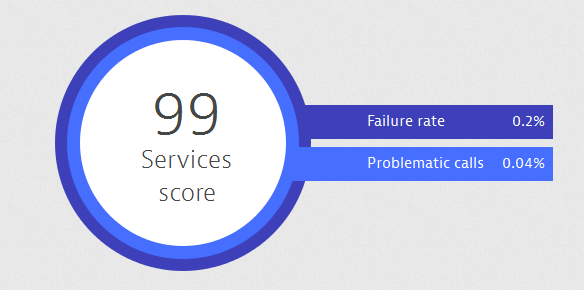
Services score
This score represents the percentage of service calls that were successful and unaffected by problems.
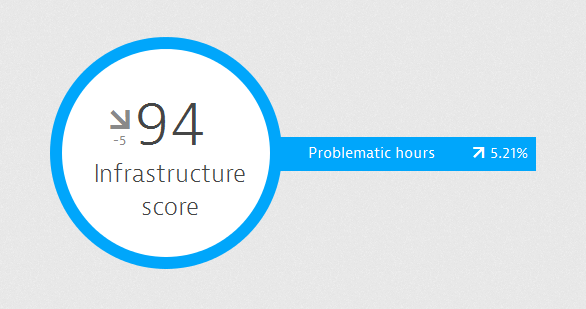
Infrastructure score
This score is the percentage of host time during which no problems were encountered.
How often are reports generated?
Service quality reports are generated each week on Sundays at midnight so that when you start your work week each Monday morning you'll find a new report ready for your review.
To subscribe to weekly service quality report emails
- Select Reports from the navigation menu.
- Click a Service quality report to open the report.
- Click the Browse (...) button.
- Click Subscribe.
If you're unsure if you've already viewed a report for a given week, select Reports from the navigation menu. Then click the Unread filter to display all unread reports.
How do I share reports?
You can share service quality reports with anyone, including both registered DESK users and non-users.
To share a service quality report using email
- Select Reports from the navigation menu.
- Click a Service quality report to open the report.
- Click the Browse (...) button.
- Click Share to display the sharable link for the report.
- Click Copy to copy the URL to your clipboard.
- Paste the sharable URL into an email to the recipient.
When you share a report with a non-DESK user, the user receives a message with a private link that allows them to view the report without logging into DESK.