Waterfall analysis
DESK captures user experience and performance data by monitoring individual user actions. Typically a user action begins with a click on an HTML control (for example, a button or link). The browser then loads the requested data, either by navigating to a new page or via an XHR/fetch call. JavaScript callbacks are then executed, the DOM tree is built or changed, and the web application is then once again ready for a new user action. DESK Waterfall analysis view is the perfect tool for analyzing all such user action monitoring data in detail.
To access waterfall analysis for a user action
-
Select Applications from the navigation menu.
-
Select the application that provides the user action you want to analyze.
-
Scroll down to the Top 3 user actions section of the Application page.
-
Select a user action (or click View full details to access additional user actions).
-
On the User action page, click the View analysis in waterfall chart button to open Waterfall analysis.
What data is displayed in the Waterfall analysis view?
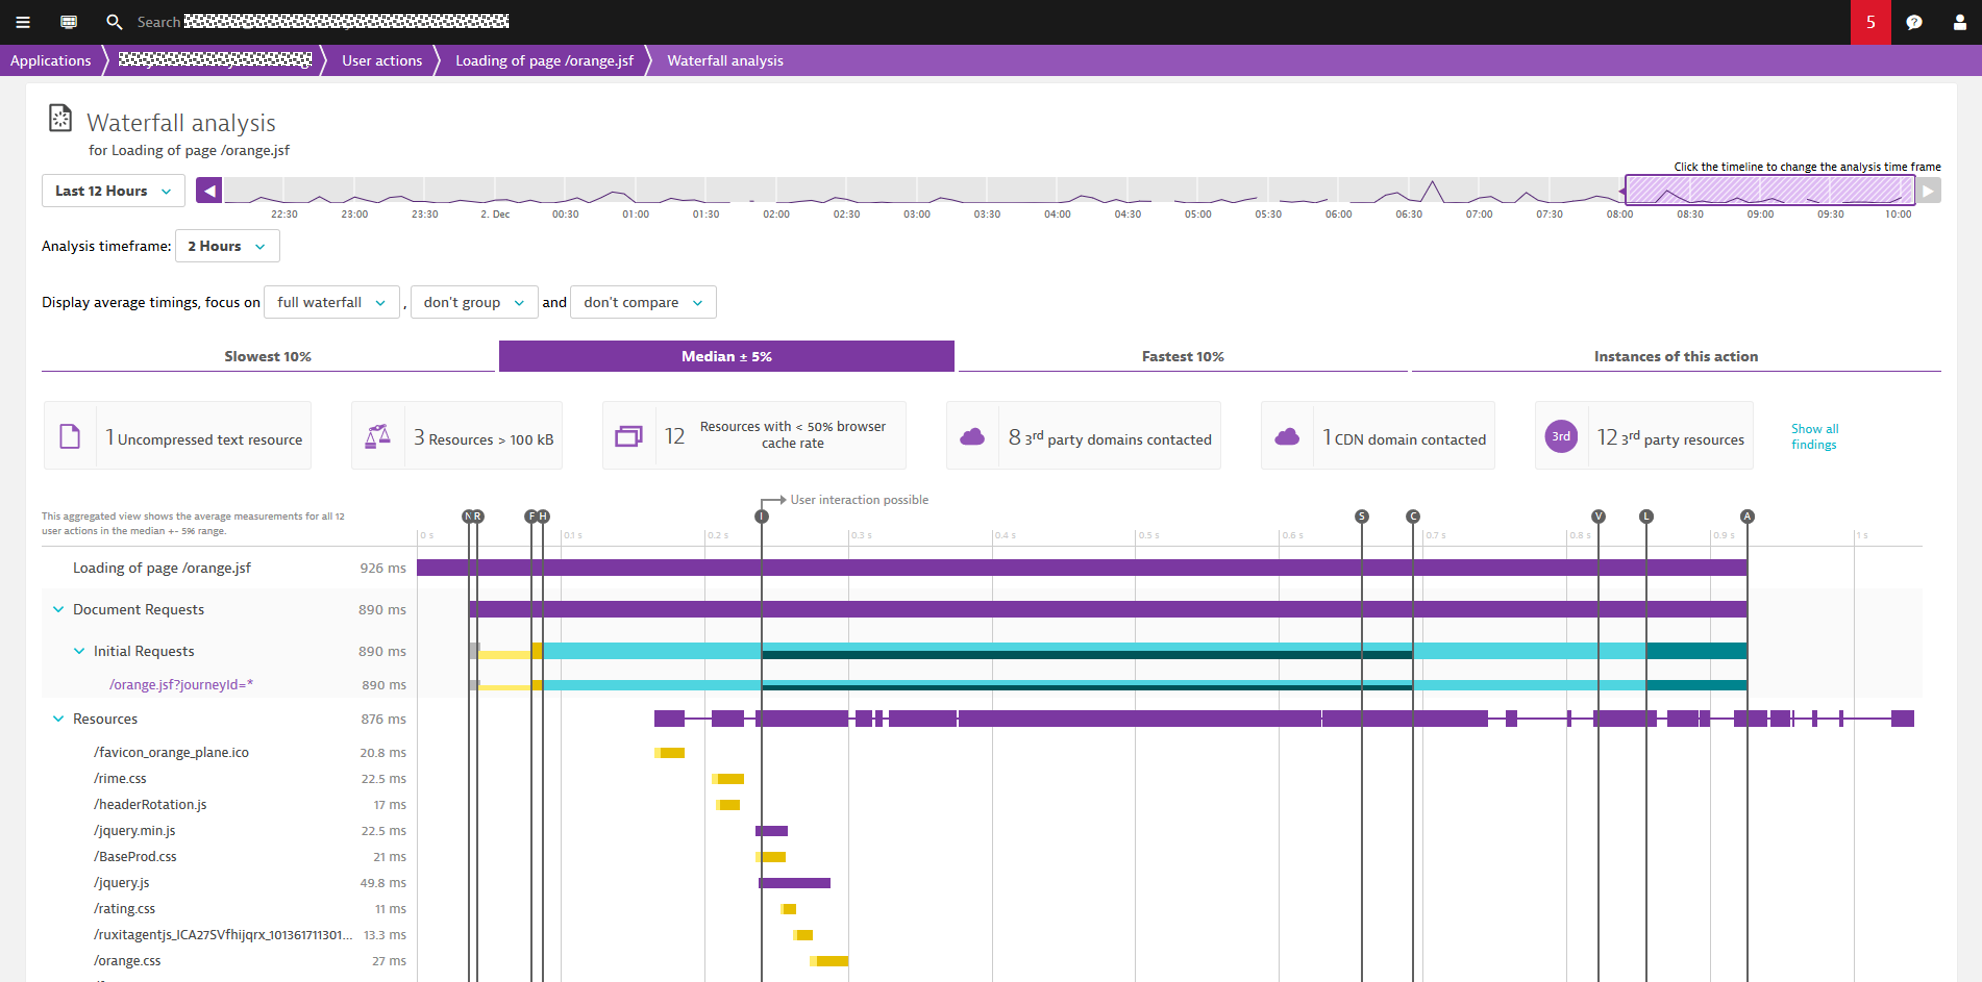
Waterfall analysis view is primarily built around W3C timings. The view organizes the waterfall entries into three sections:
Document requests – Displays all content that is identified as the page load of the user action. This includes the initial HTML, as well as any other content that’s displayed in frames. Each entry contains the details that are captured by W3C navigation timings.
XHR requests – Displays all resources that were sent via XHR or fetch(). These entries contain all the details that are accessible through the W3C resource timings, in addition to the JavaScript callback execution time.
Resources – Displays all W3C timing details for all resources.
A user action may contain more than a single page load or XHR. Therefore, the initial request is highlighted in purple. The timings of the initial request are displayed as vertical event lines above the chart.
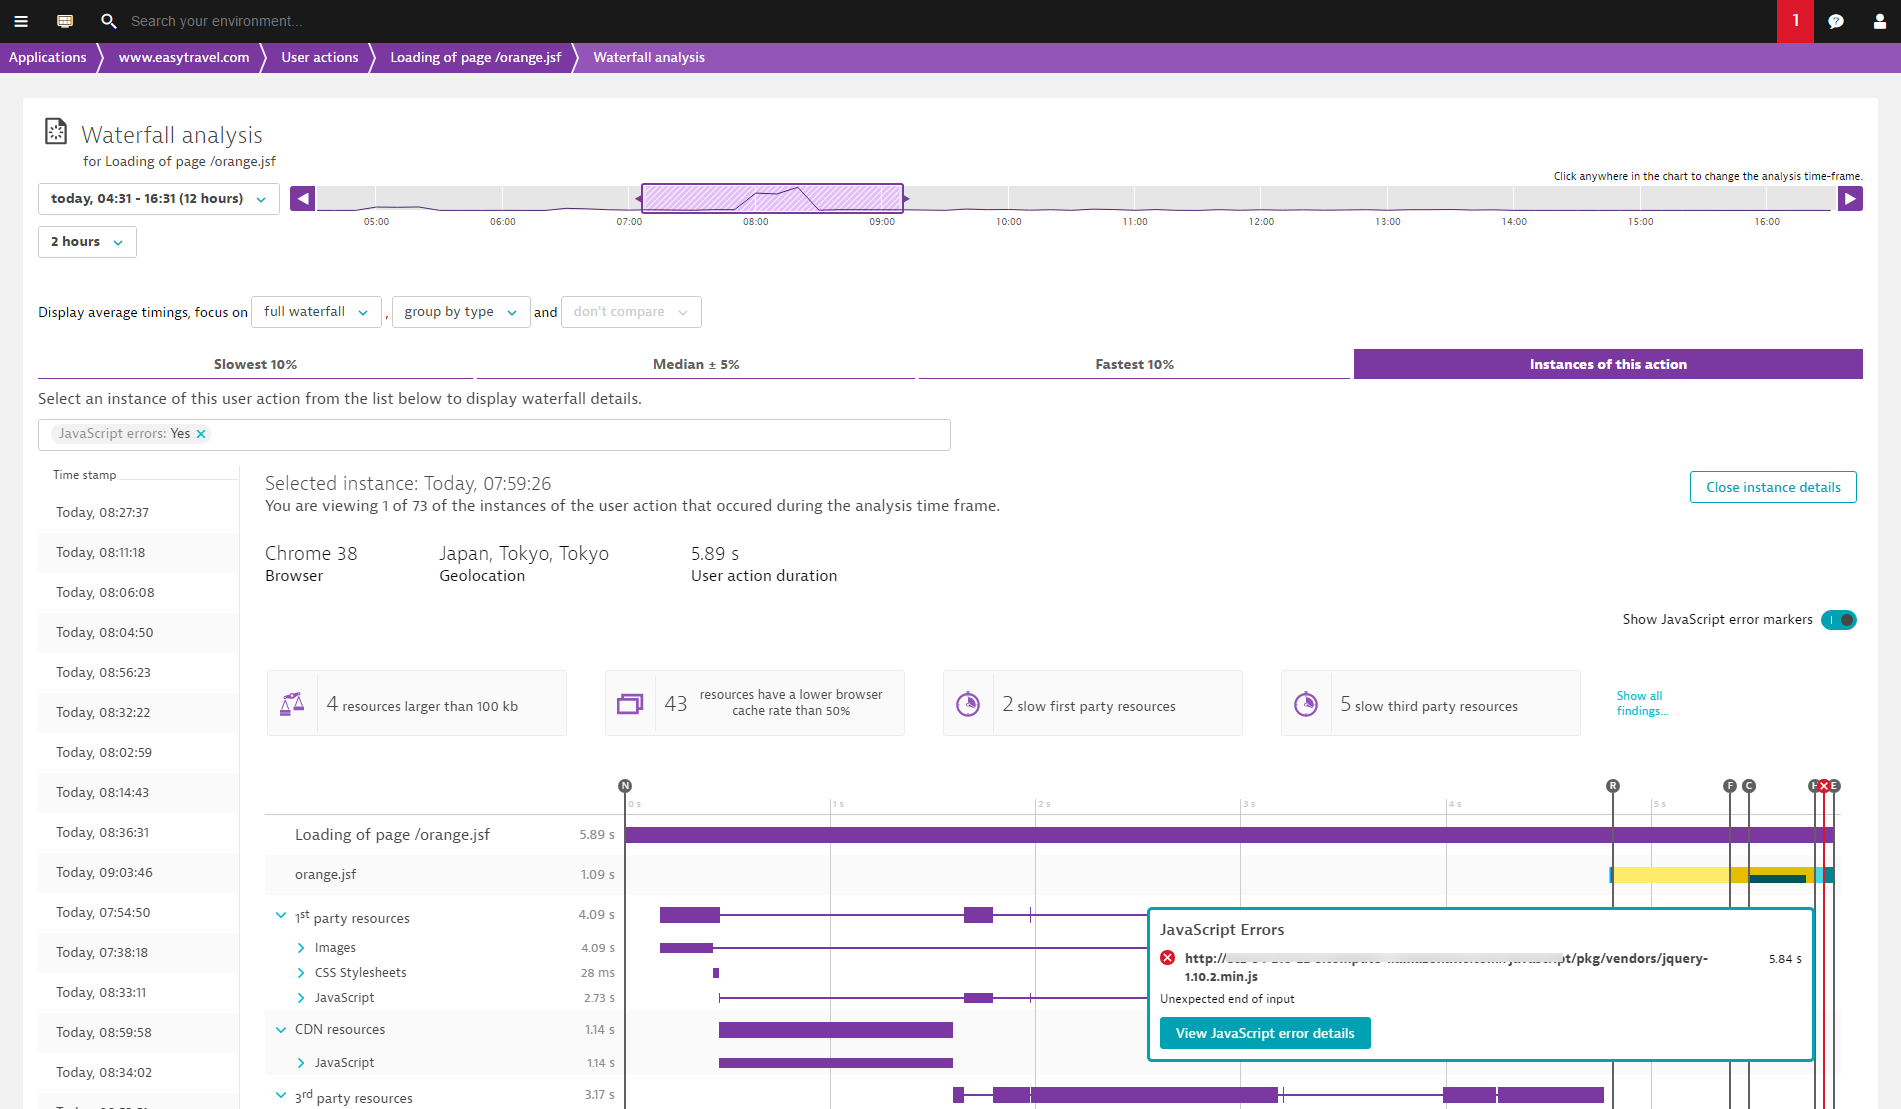
Top findings
Top findings for waterfalls help you understand the above-the-fold user experience of your real users. Initial page loads drive the first impressions of new visitors to your web application. Further, top findings provide an easy way of understanding which web requests impact key performance metrics and are therefore potential candidates for optimization.
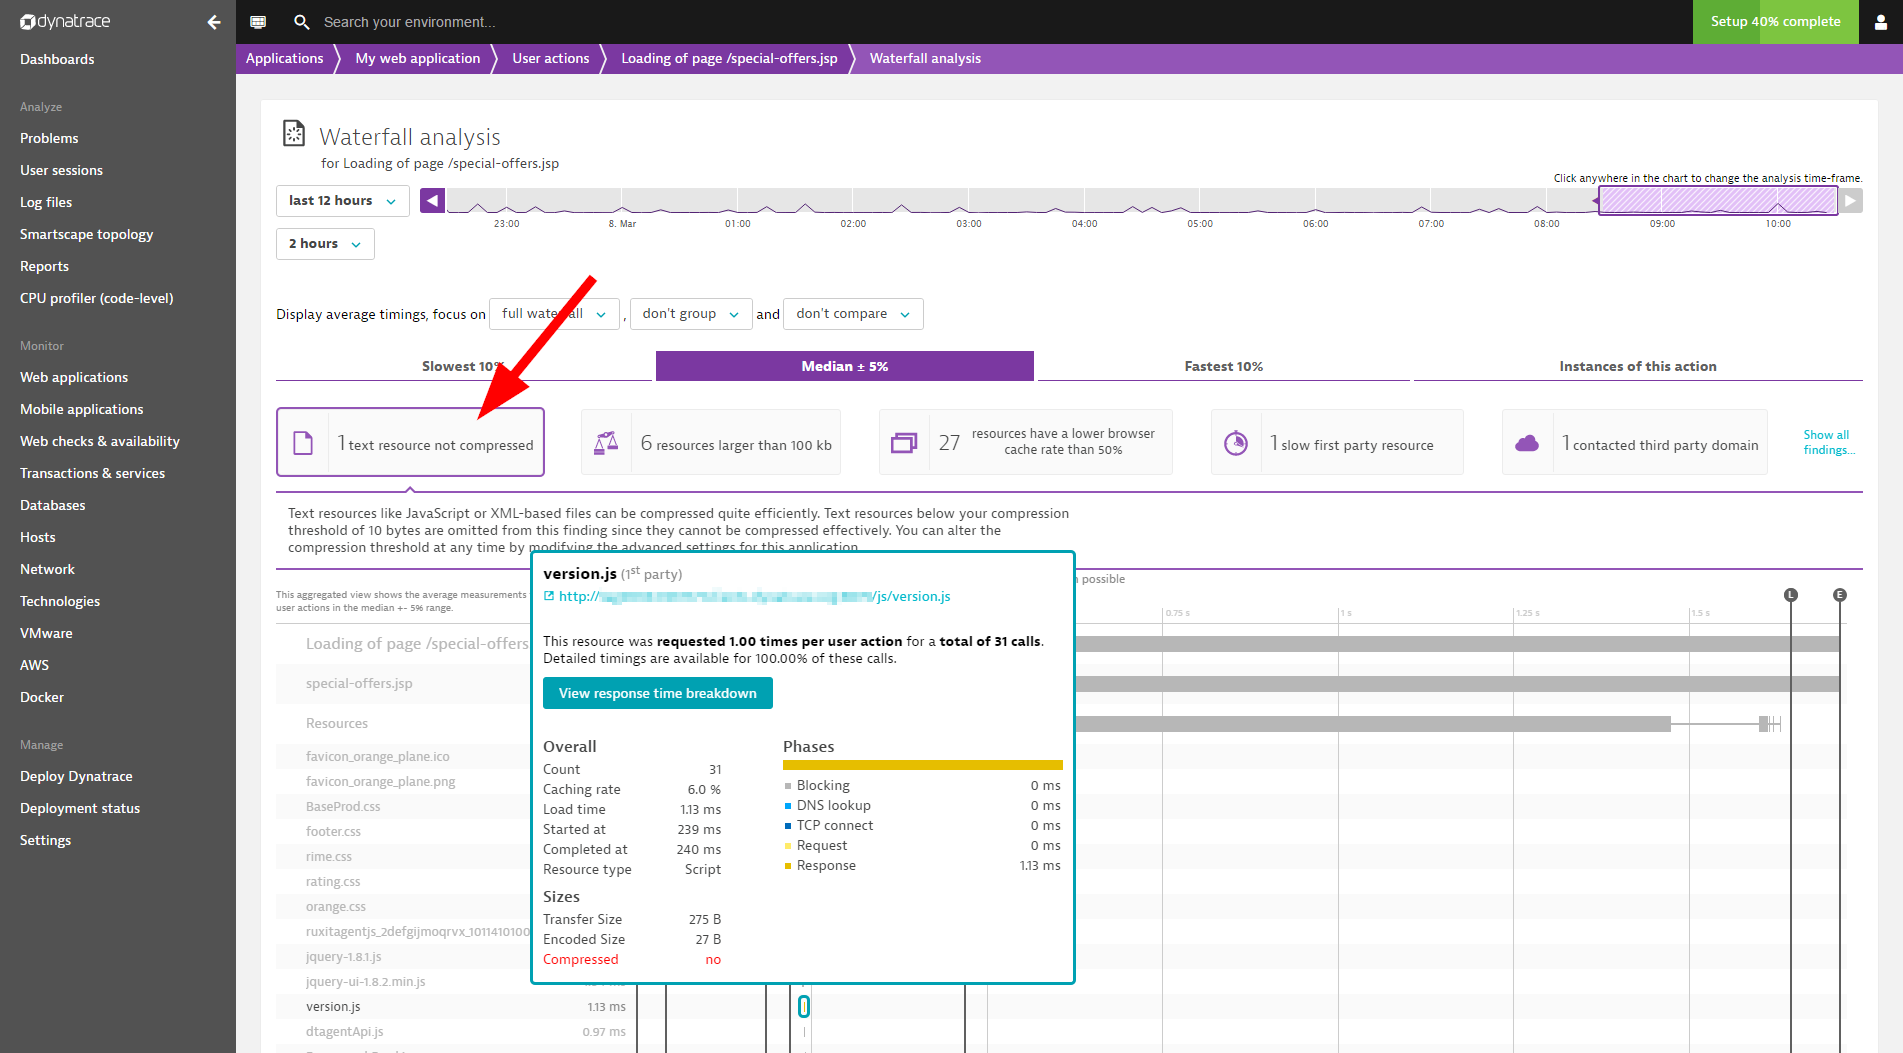
For each user action viewed in Waterfall analysis, the following top findings are automatically identified and presented (see example below):
- Uncompressed text resources
- Resources larger than 100kb
- Resources that have a browser cache rate lower than 50%
- Slow first party, third party, or CDN resources (> 200 ms)
- Contacted third party and CDN domains
- First party, third party, and CDN resources
In the example below, an uncompressed text resource has been detected. By selecting this finding tile, the affected resource is automatically highlighted below in the Resources list.
Aggregated view
While with the browser developer tools you always have to look at single executions, the DESK aggregated waterfall allows you to get a collective view of multiple executions of the same user actions from various real users. These aggregations are calculated from the user action executions within the analysis timeframe and are bucketized into 3 aggregated waterfalls; You can select between the aggregated waterfall view displaying the slowest 10%, the fastest 10% and +-5% of the median. This helps you identify requests and patterns that relate to either high or low performance.
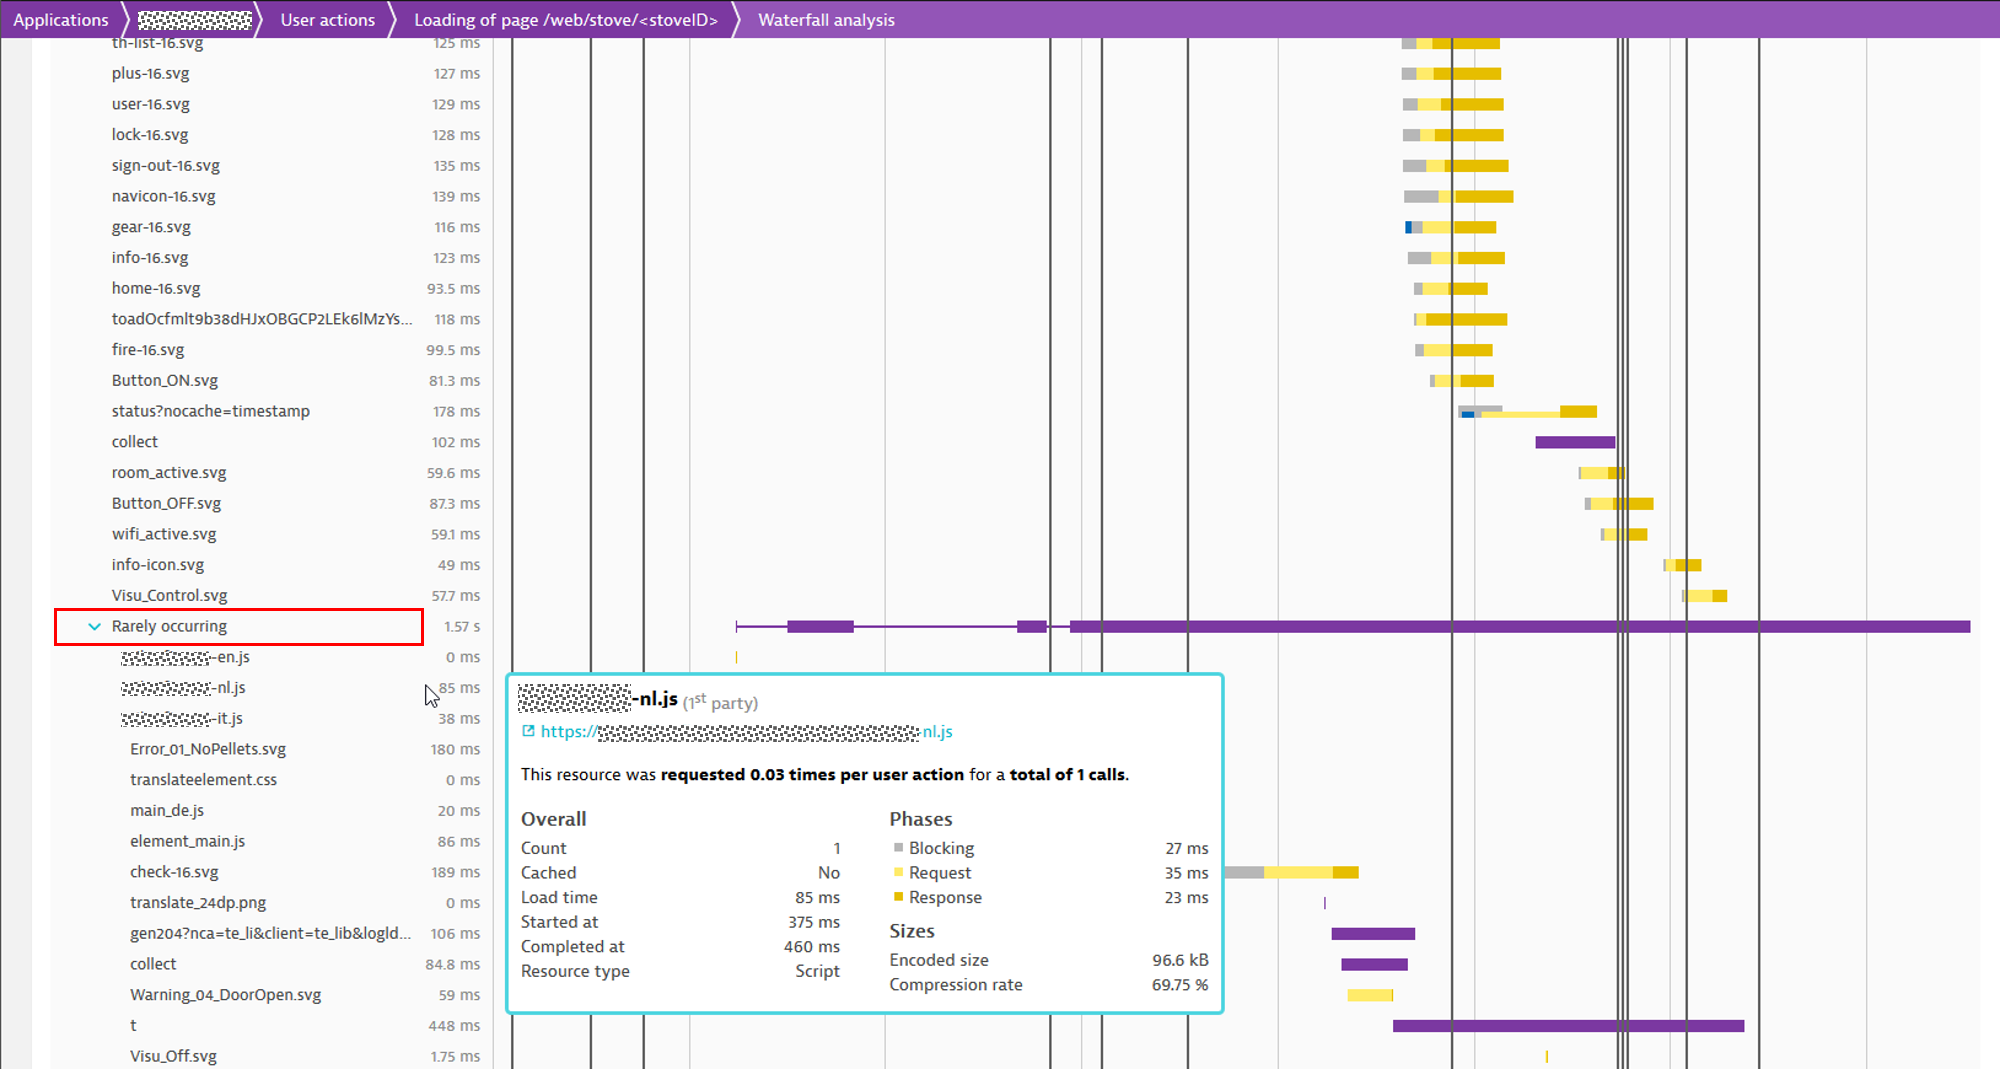
Rarely occurring resources
To keep the aggregated Waterfall analysis view down to a reasonable and readable size, resources that occur in less than 30% of user action instances are moved to a Rarely occurring resource group. You can expand this group to view the rarely occurring resources. Note all the detail that’s returned in the roll-over highlight pane.
Single instance view
While automated findings are a great way to get started with waterfall analysis of user actions and to discover ways of improving the customer experience of your application, sometimes you need to be able to dig deeper into the performance data of your user actions.
While the aggregated information is helpful for gaining an overview of user action processing steps and resource usage, it’s sometimes necessary to analyze individual instances of specific user actions to understand the impact of certain browsers, geolocations, or other variables. Therefore, it’s possible to view waterfall analysis of individual user-action instances. Individual user action instances are listed on the Instances of this action tab.
Filter user action instances
You can filter and sort user action instances based on various criteria. Note in the example below that instances of the user action Loading of page /orange.jsf are filtered based on Browser family, User type, Action duration, and Country.
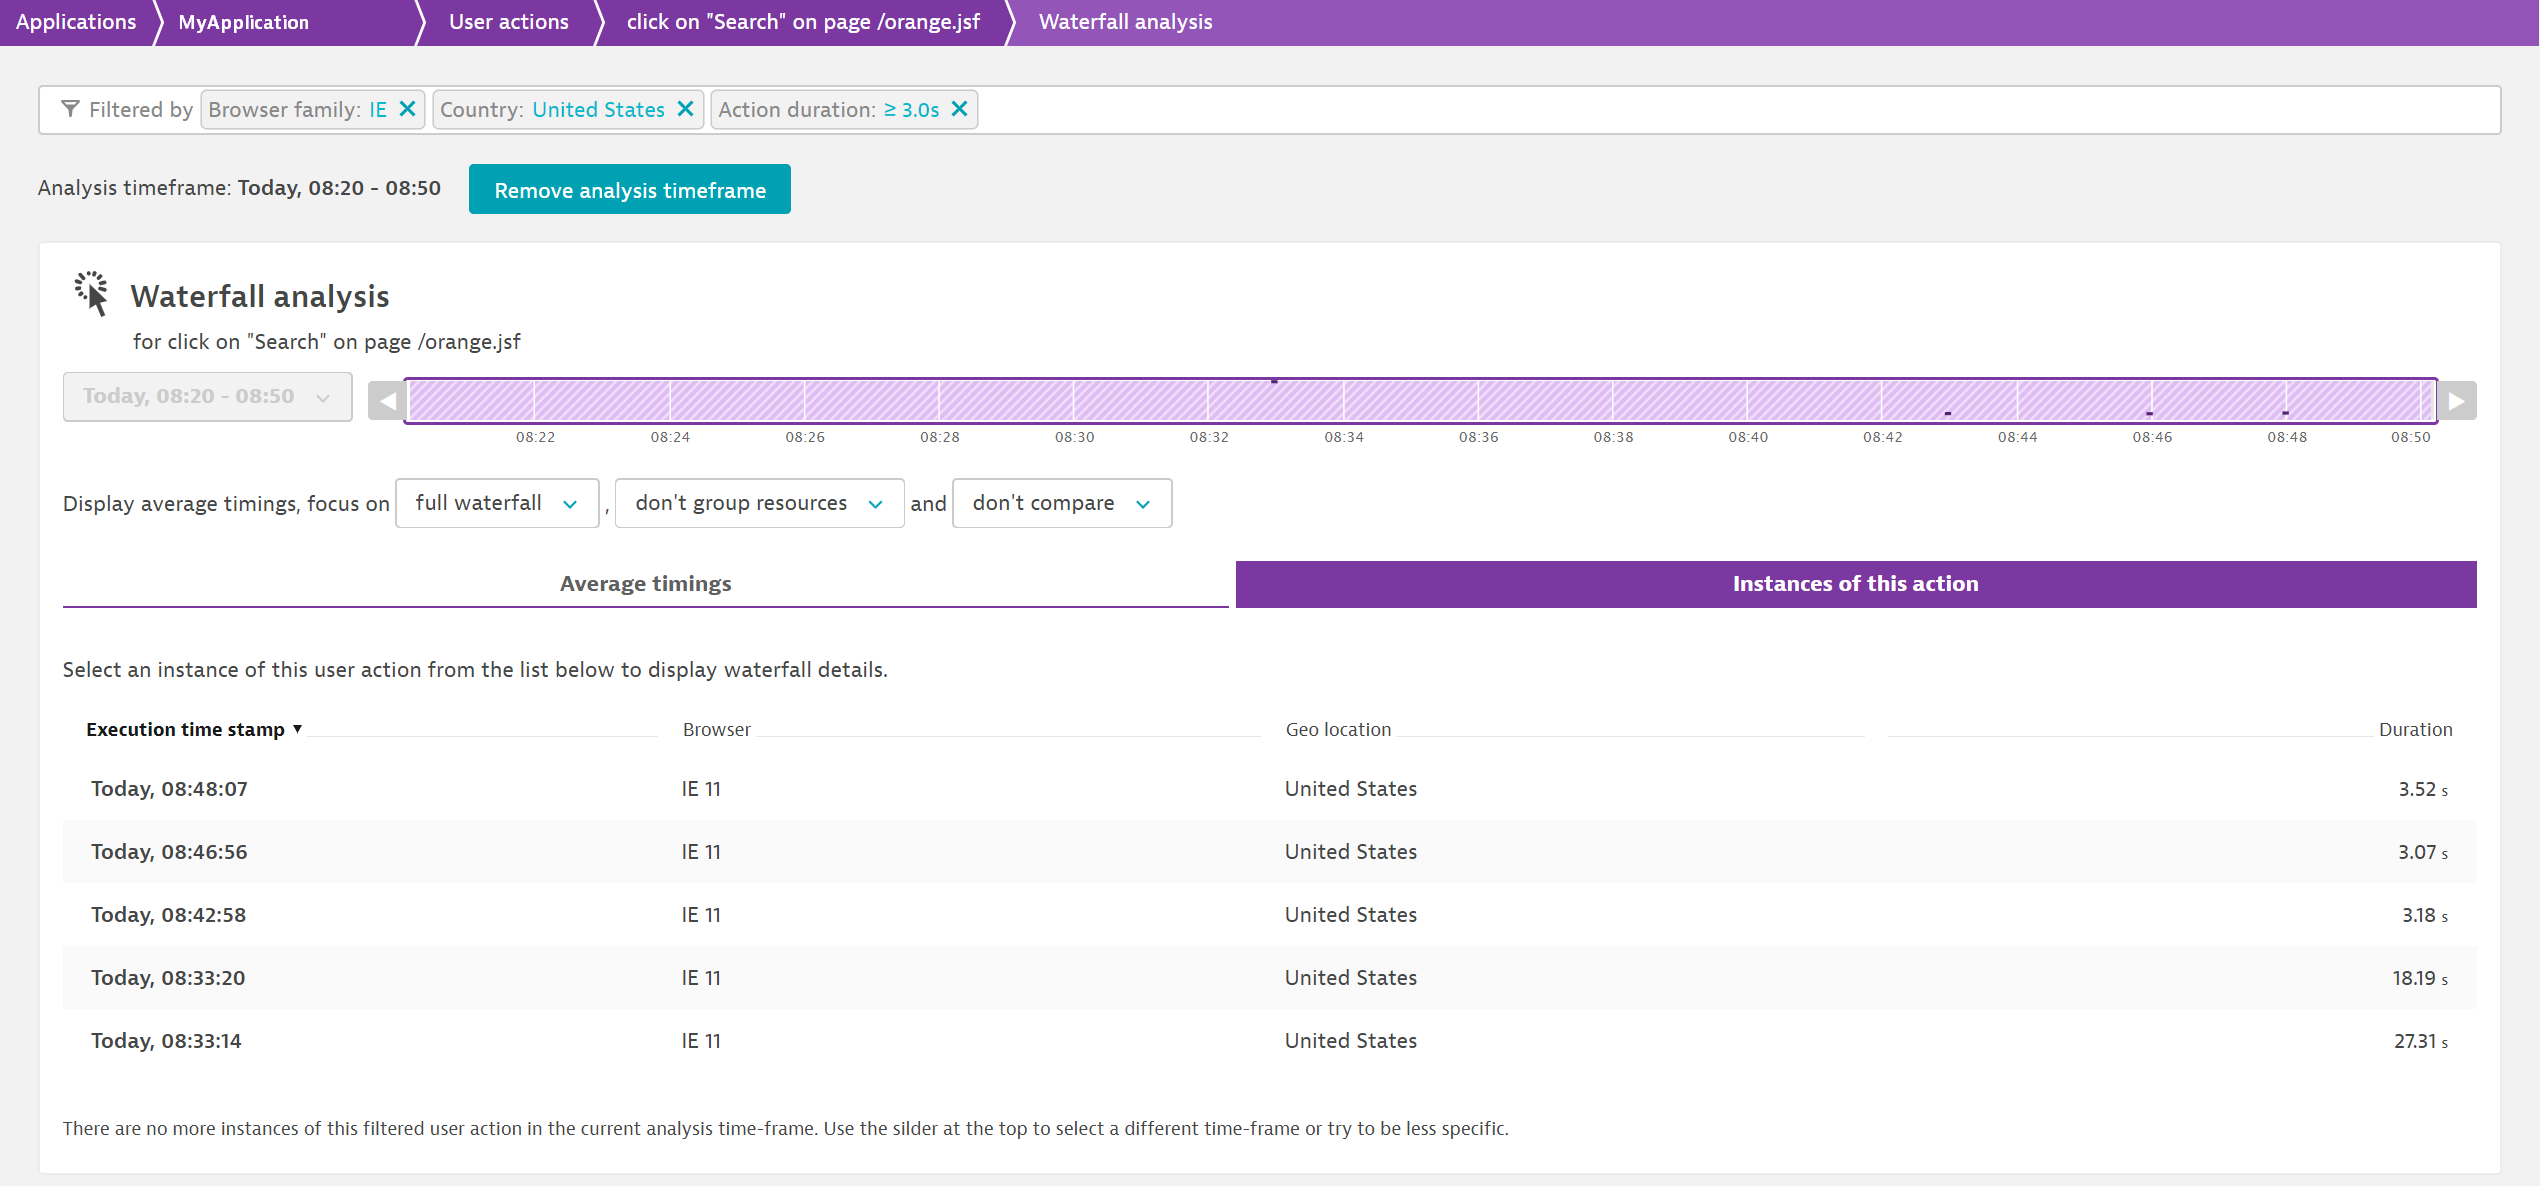
Analyze individual user action instances
You can click any user action instance you want to analyze. In the example below, the same user action from above is analyzed. The image below shows the Waterfall analysis of just the selected instance of this user action, including all resource details and timings.
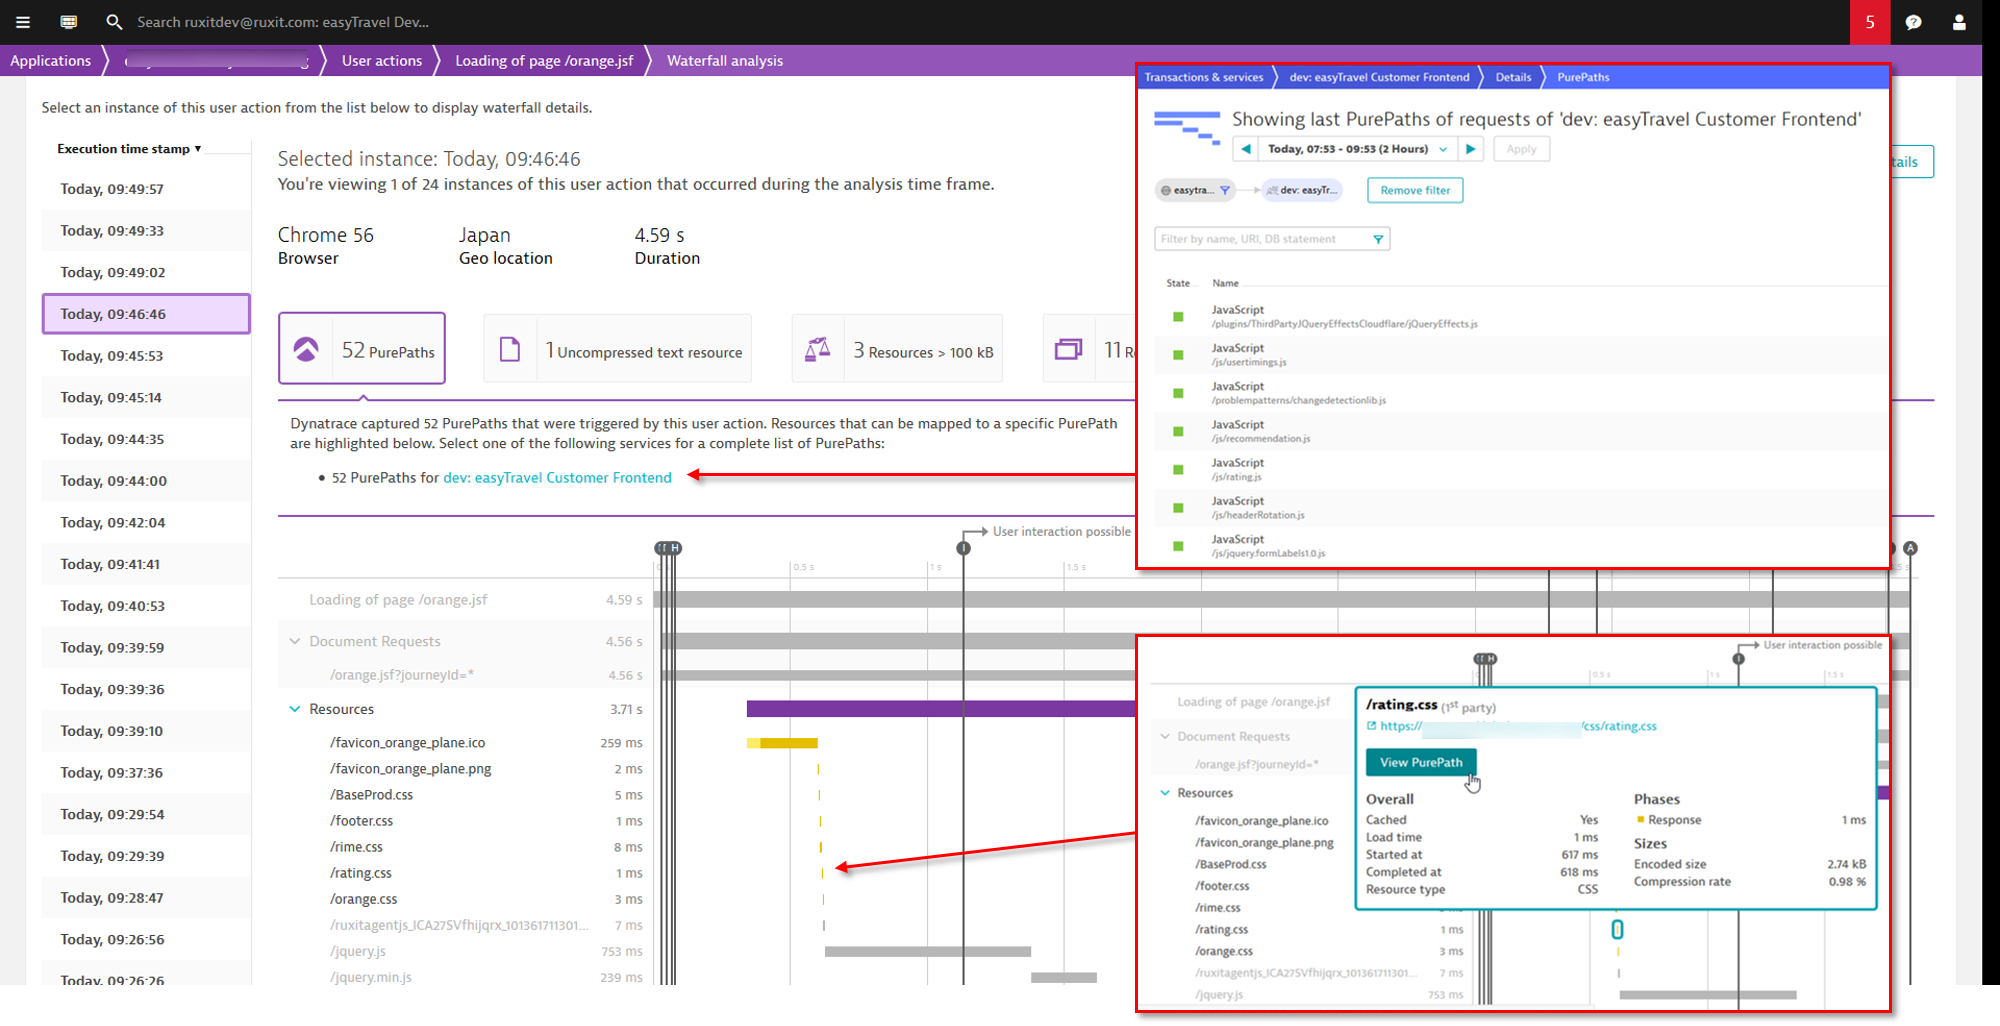
End to end visibility and drill down to PurePaths
A top finding called PurePaths is available when you use the Waterfall analysis* view to analyze the performance of a single user action instance for which PurePaths are available. The example below shows that 52 PurePaths related to the selected user action instance are available for analysis. Select the PurePaths tile to get a link to the list of associated PurePaths. The top findings also highlight all resource entries in the waterfall analysis chart for which PurePaths are available.
Please note the following limitations:
-
End-to-end visibility requires a OneAgent instance running on the server side. You’ll only see the top findings when PurePaths are actually available.
-
For processes that are under heavy load, DESK OneAgent automatically adjusts how much data is sent to DESK Server. Therefore, certain PurePaths may not be available.
-
Drill down from a waterfall resource (based on W3C resource timings) to a PurePath (captured by OneAgent) is done by comparing the URLs. If there are any rewrite rules, or if parts of the URL aren’t identical on the client and server sides, the View PurePath button won’t be displayed. In such cases, you can get to all your PurePaths by clicking the PurePath tile included in the top findings.
Application settings influencing waterfall analysis
Using the application settings, you can configure the thresholds for the top findings while via the global settings, you can define resource types and URL cleanup rules.
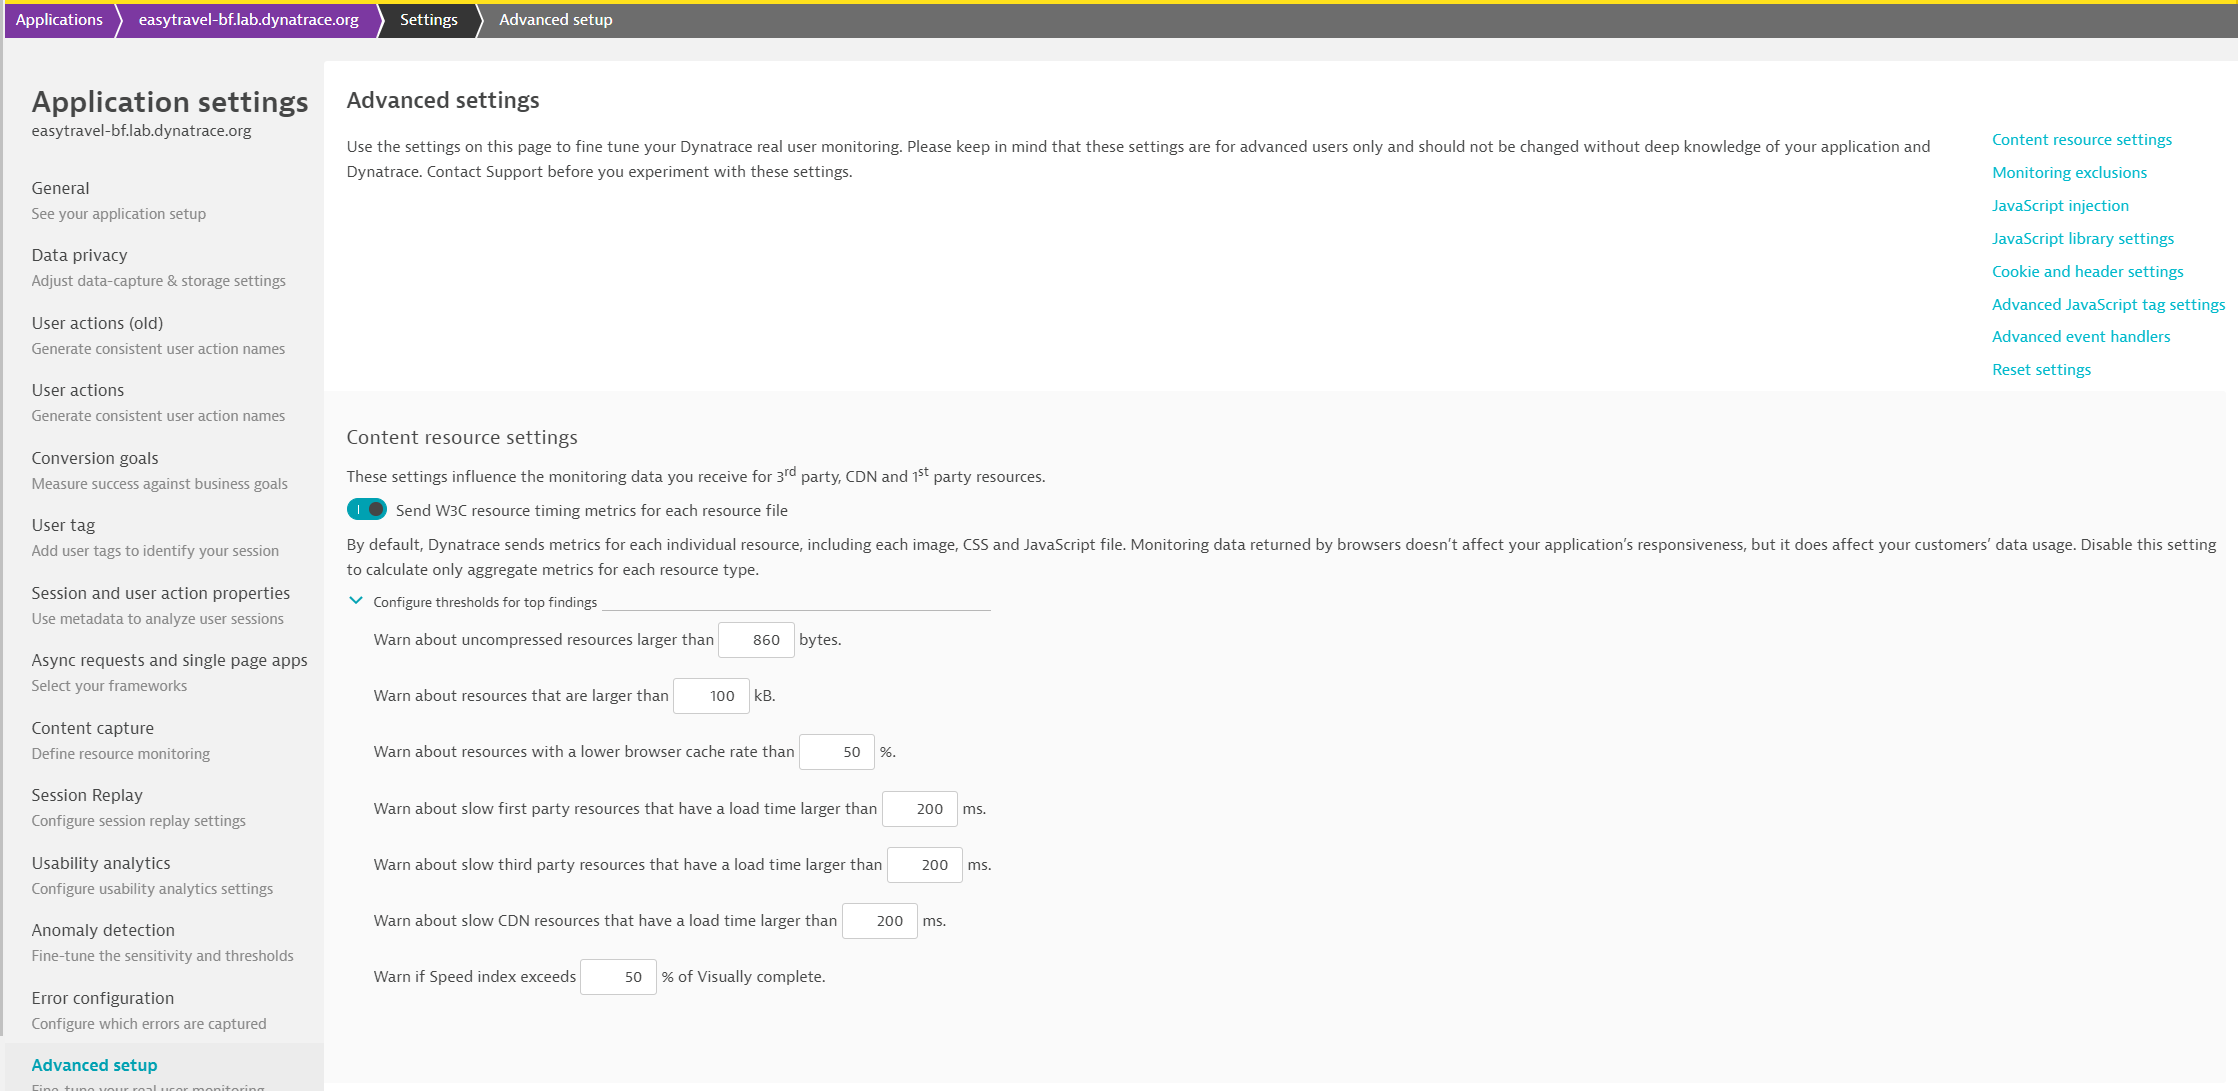
Configure thresholds for top findings
To configure thresholds for top findings
- Select Applications from the navigation menu.
- Select the application you want to configure.
- Click the Browse button (...) and select Edit.
- Select the Advanced setup tab.
- In the Content resource settings section, expand Configure thresholds for top findings.
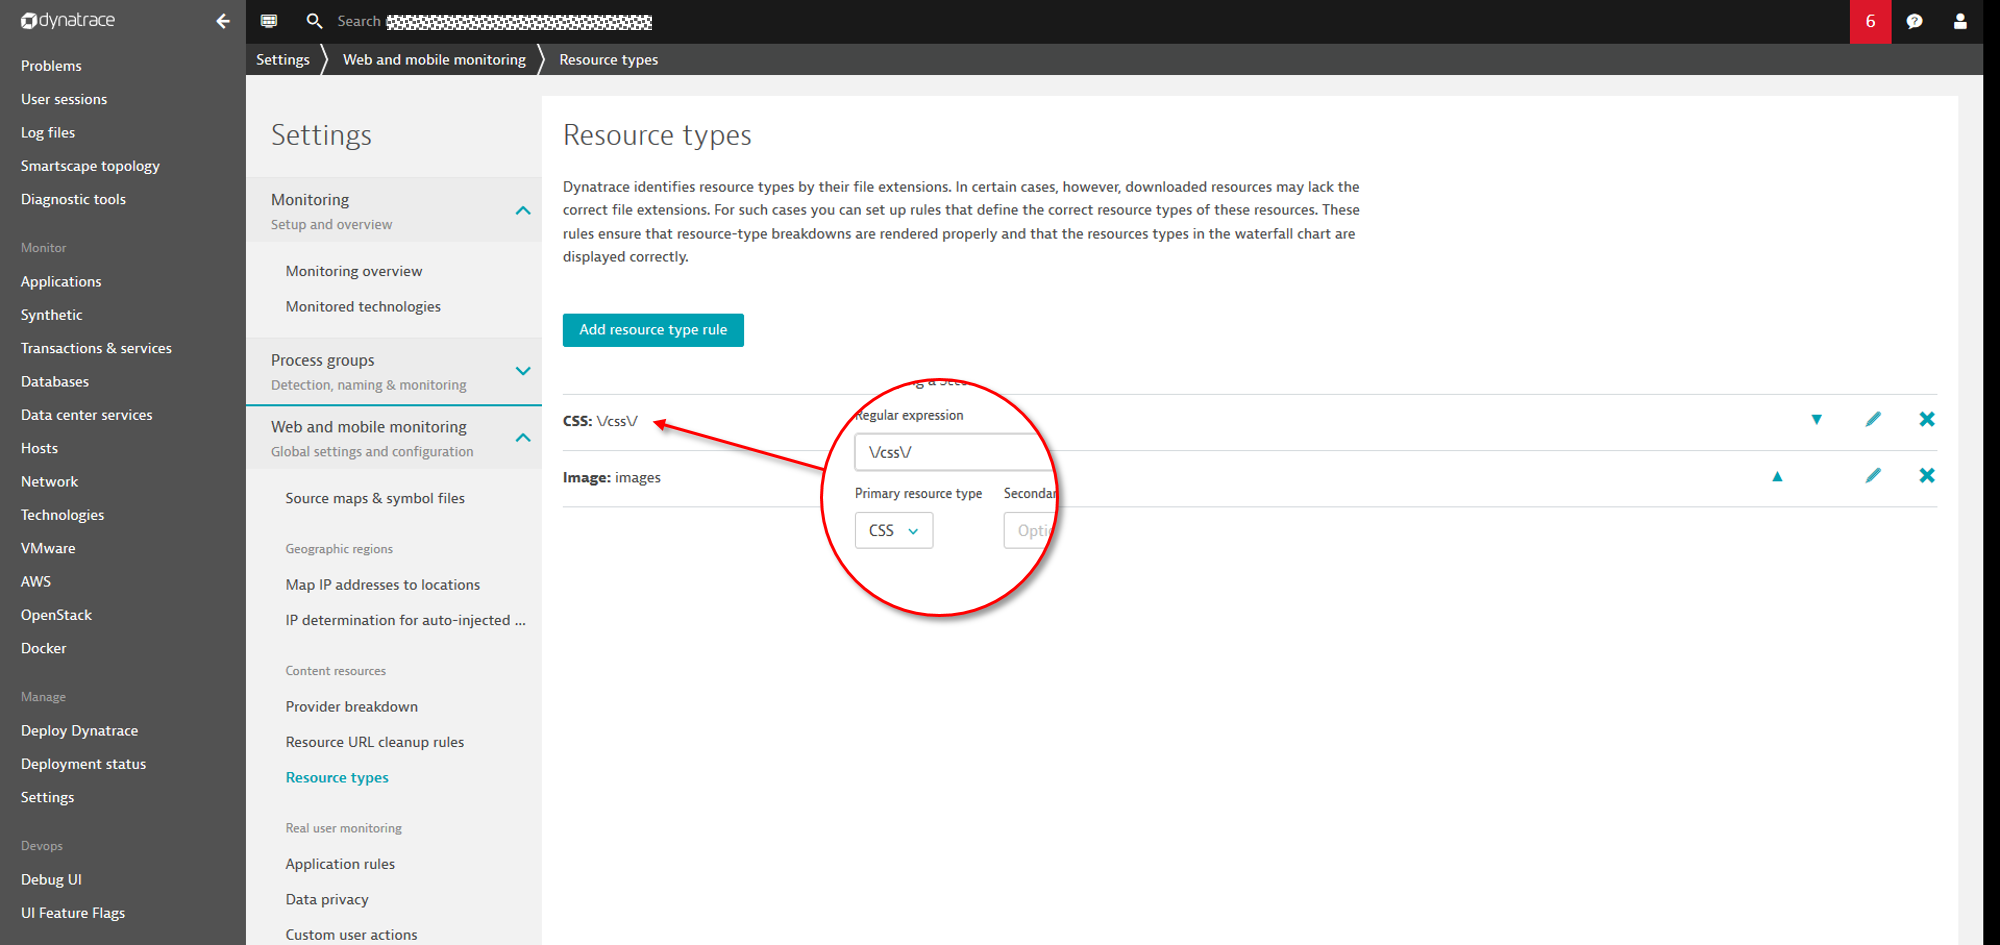
Define resource type
In Waterfall analysis view, you can group resources based on their type. Since the MIME type isn’t accessible from JavaScript, the resource type is determined based on the file extension. If certain resources don’t have a proper extension, you can configure URL matching rules to define those resource types.
To set up a URL matching rule for definition of a resource type
- Select Settings from the navigation menu.
- Expand the Web and mobile monitoring settings tab.
- Select Resource types.
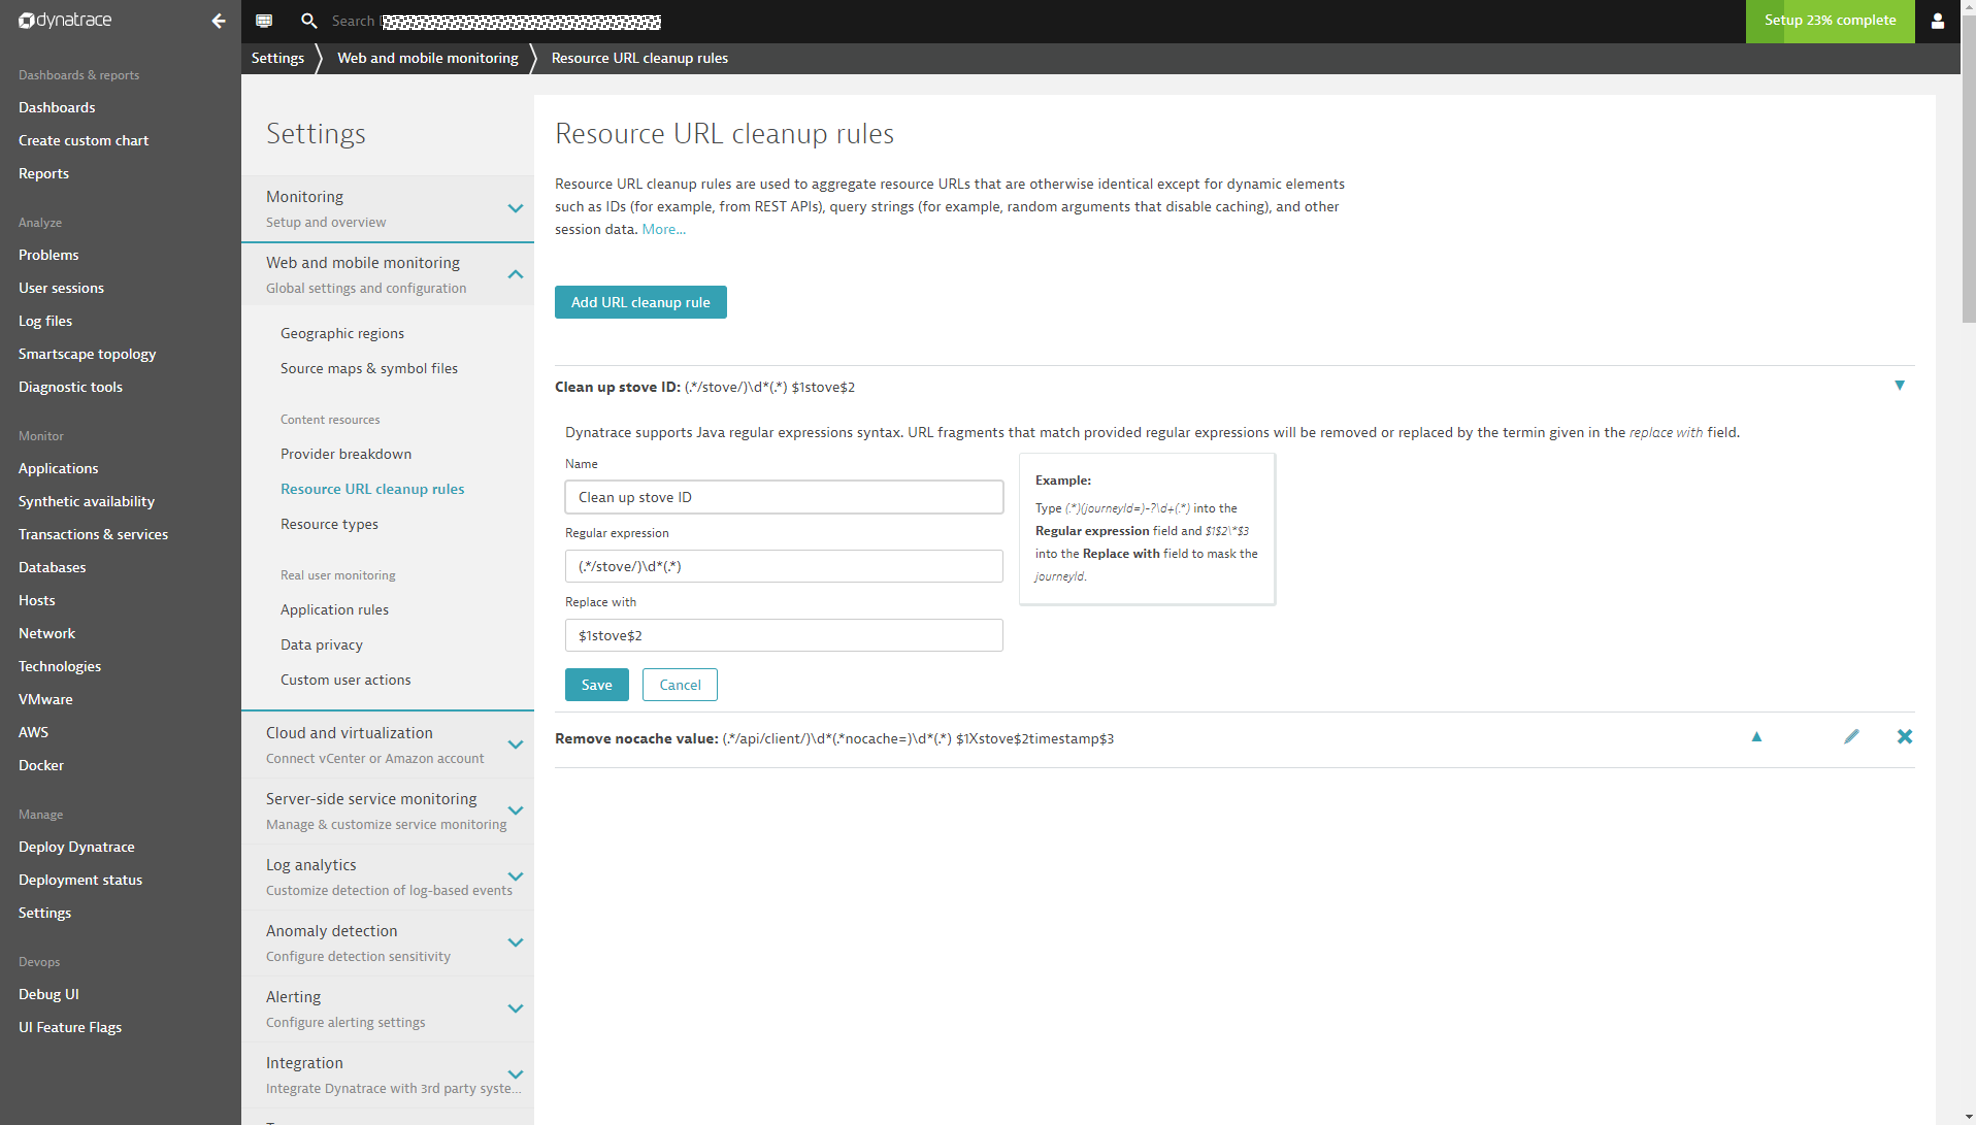
Define URL cleanup rules
In the aggregated Waterfall analysis view, resources are aggregated based on their URLs. Often, IDs and other random numbers prevent resources from being correctly aggregated. When this happens, some important resources may unintentionally appear in the Rarely occurring resources list.
To define a URL cleanup rule
- Select Settings from the navigation menu.
- Expand the Web and mobile monitoring settings tab.
- Select Resource URL cleanup rules.
- Define regular expressions to remove the IDs.