Analyze database services
DESK monitors the response time, failure rate, throughput, and more of every database statement executed by your applications.
To analyze performance of a database
- Select Databases from the navigation menu.
- Select the database you want to analyze. The database service's overview page is then displayed (see example below).
The infographics on the database service overview page provide insight into various aspects of database performance, including SQL queries or procedures, SQL modifications, SQL transactions, any detected problems or availability issues, hotspots, and more. The exact list of included tiles depends on the database technology you're monitoring. Each tile contains Response time, Failure rate, and Throughput metrics.
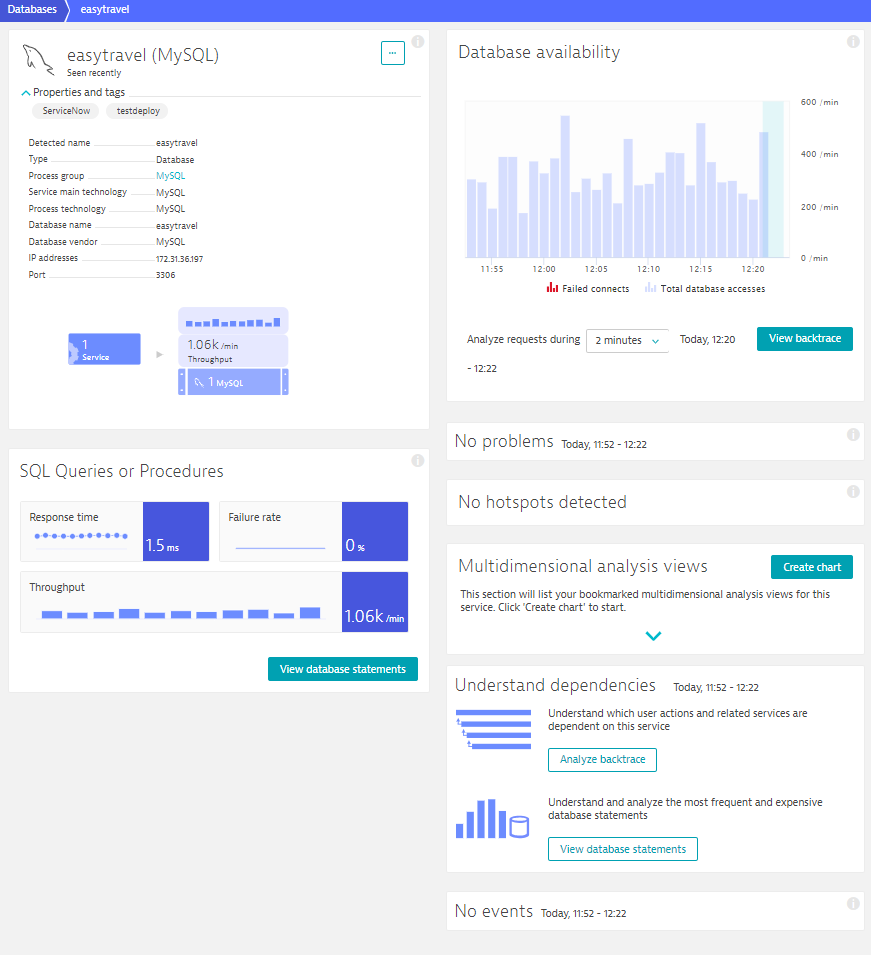
To analyze the individual statements that contribute to these types of statements, click the View database statements button on the relevant tile.
By default, the length of database statements is limited to 4KB (KiloBytes). This setting isn't configurable. Database statements that exceed this limit are trimmed to 4KB.
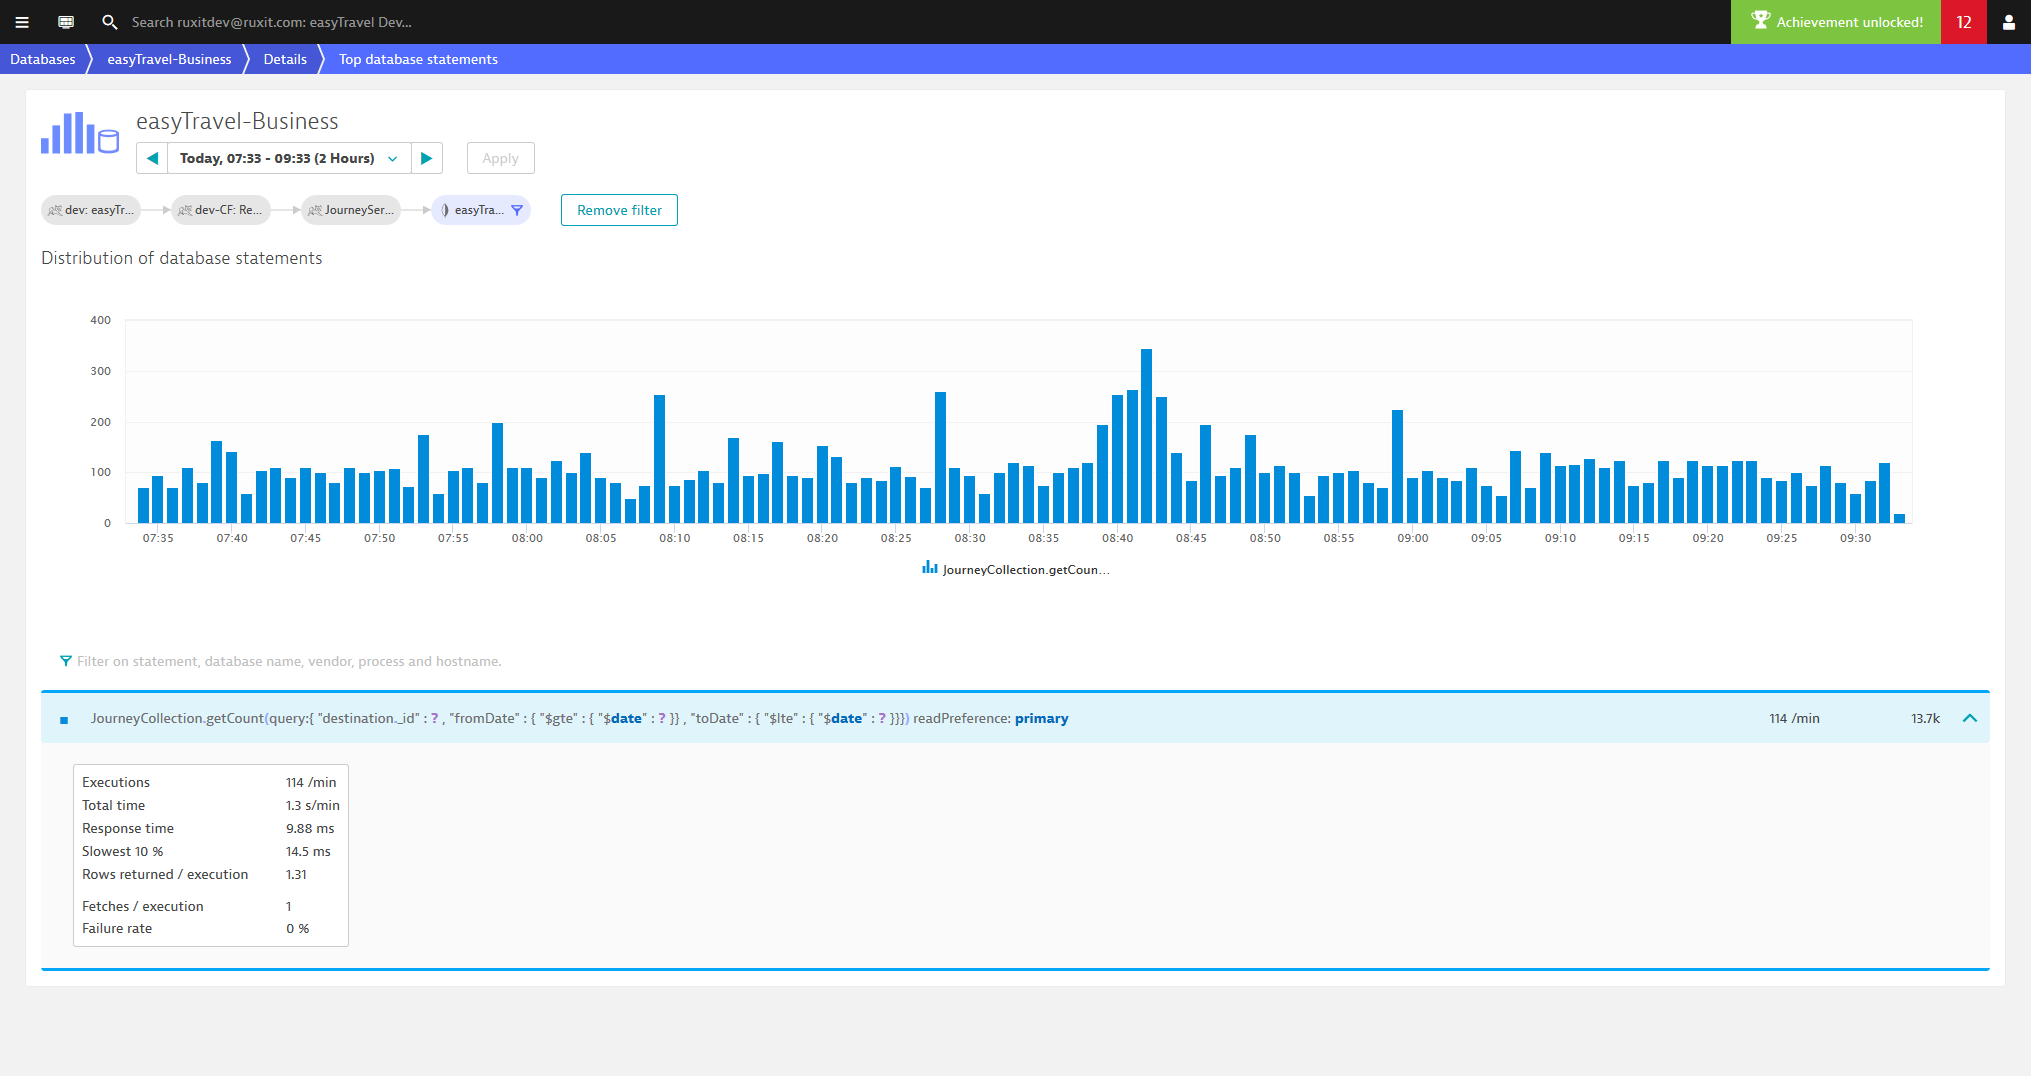
All database statements executed during the selected timeframe are listed in the Database statements section at the bottom of the Details page (see example below). By default, database statements are sorted based on median response time. You can choose other sorting options—just select one from the Sort by drop-down list. You can also filter the list of statements by clicking the Add filter button at the top of the page.
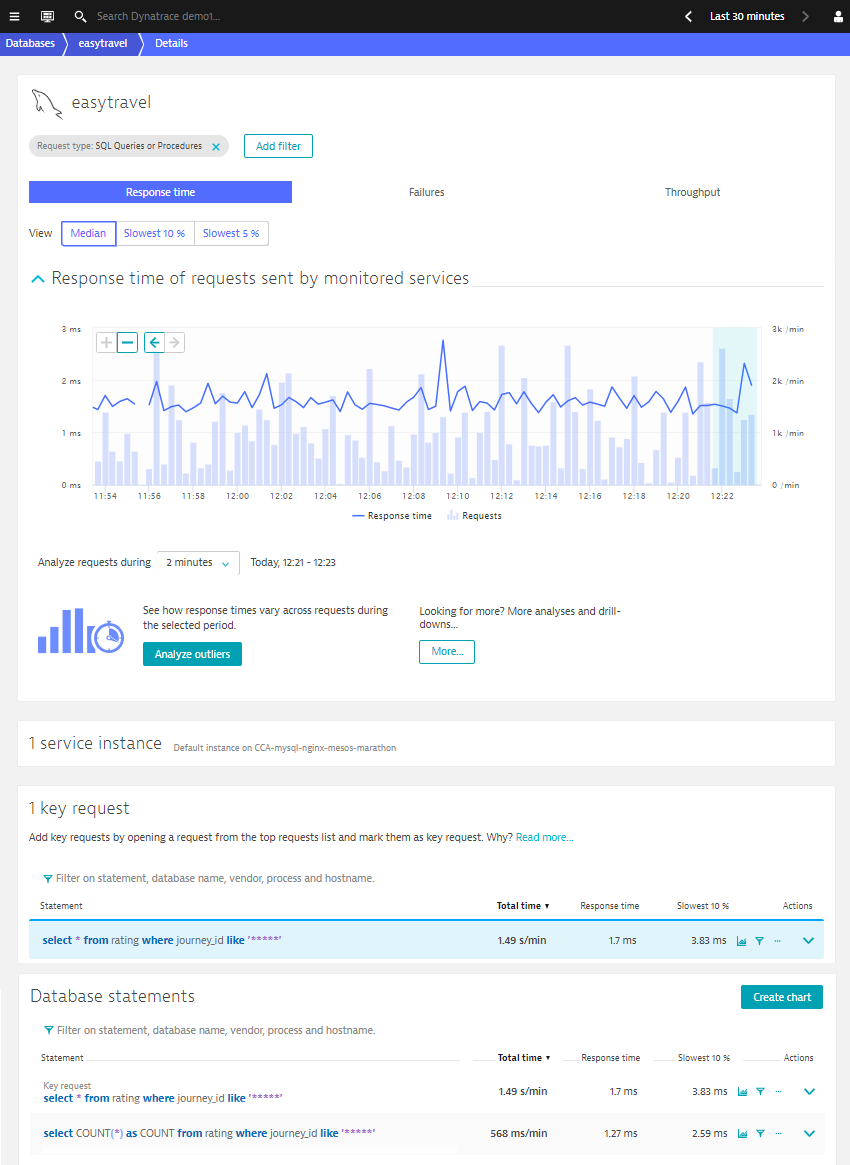
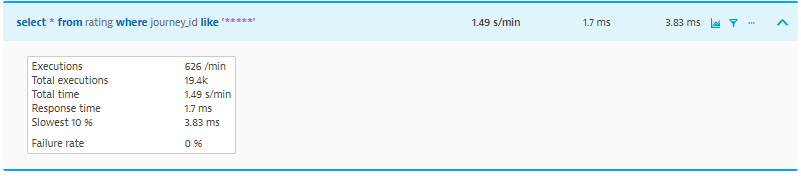
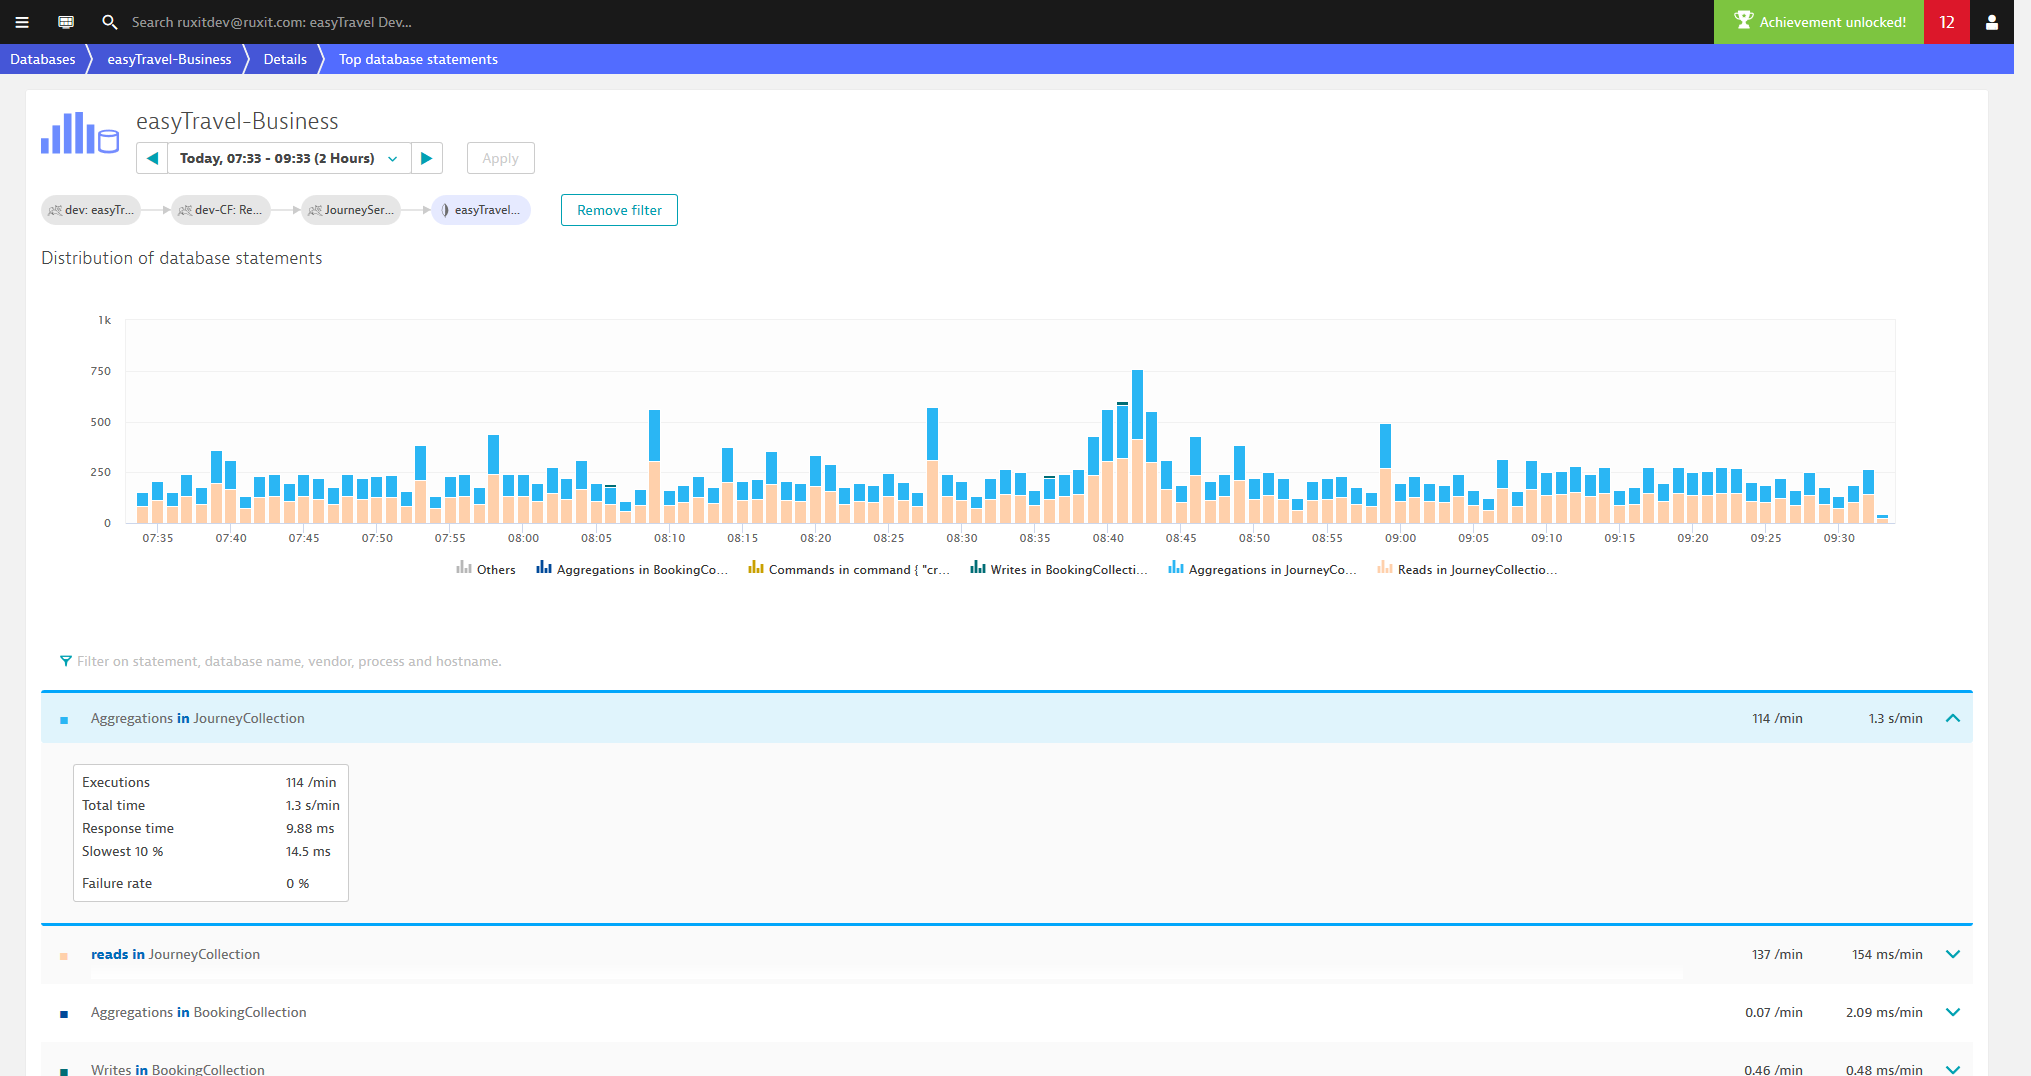
Click any statement to view the full details of that statement. For each statement, DESK shows the number of Executions/min, Total executions, Total time, Response time median, Response time slowest 10% of executions, and Failure rate.
Database service backtrace
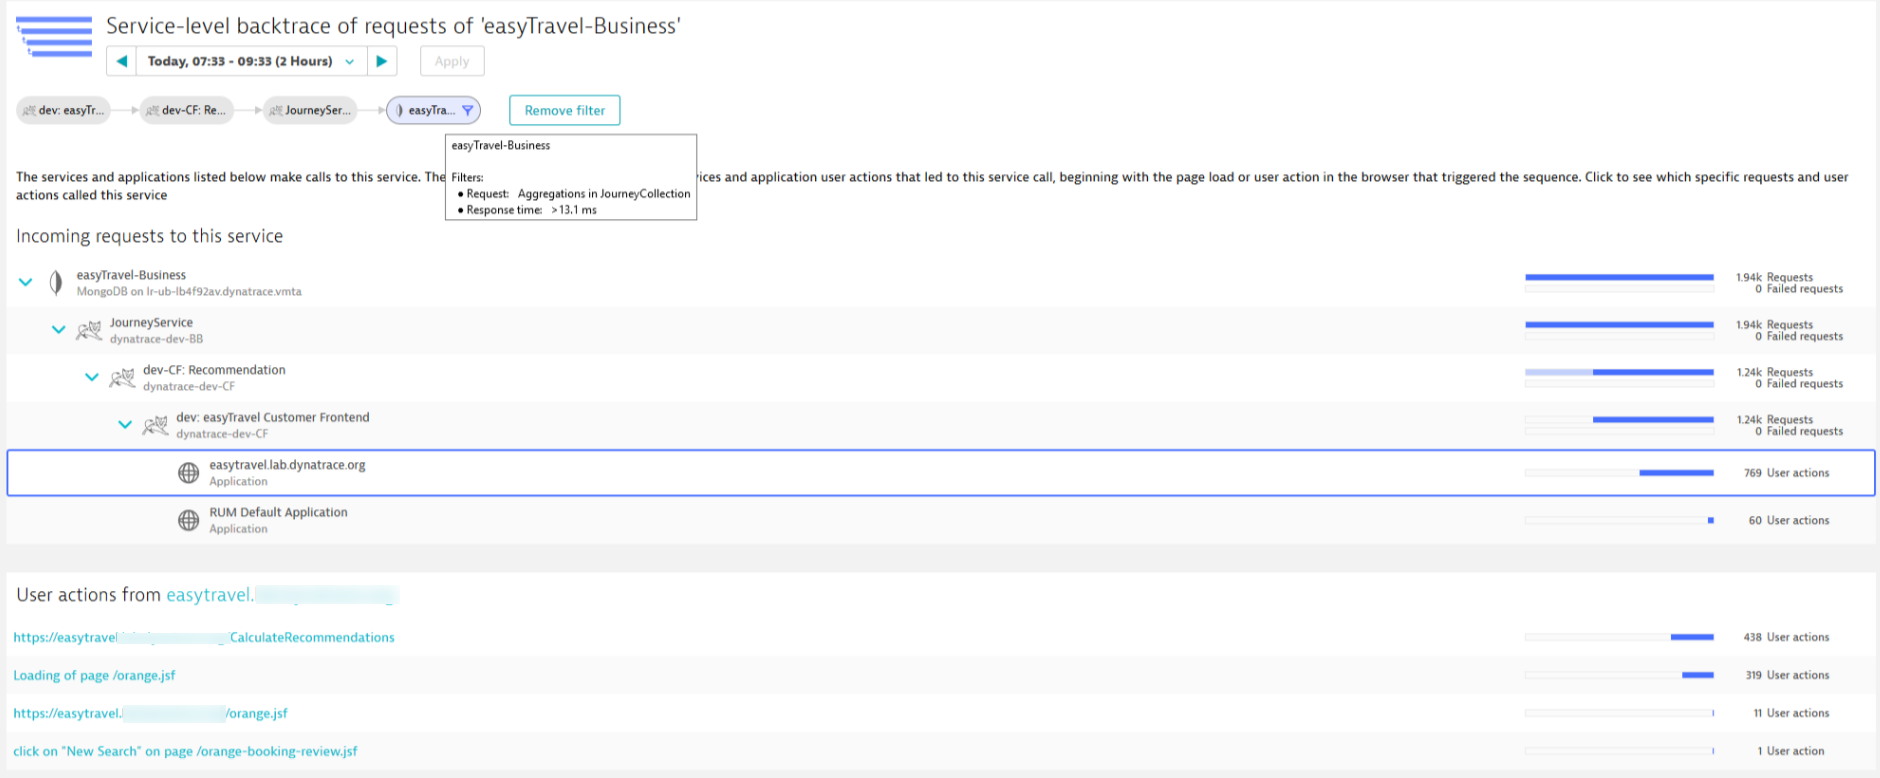
Click the Analyze backtrace button to access backtrace analysis for the selected statement. The Backtrace page provides details on the clicks that triggered the selected permutation of the SQL statement and also allows you to see which chain of services and which code leads to a particular statement.
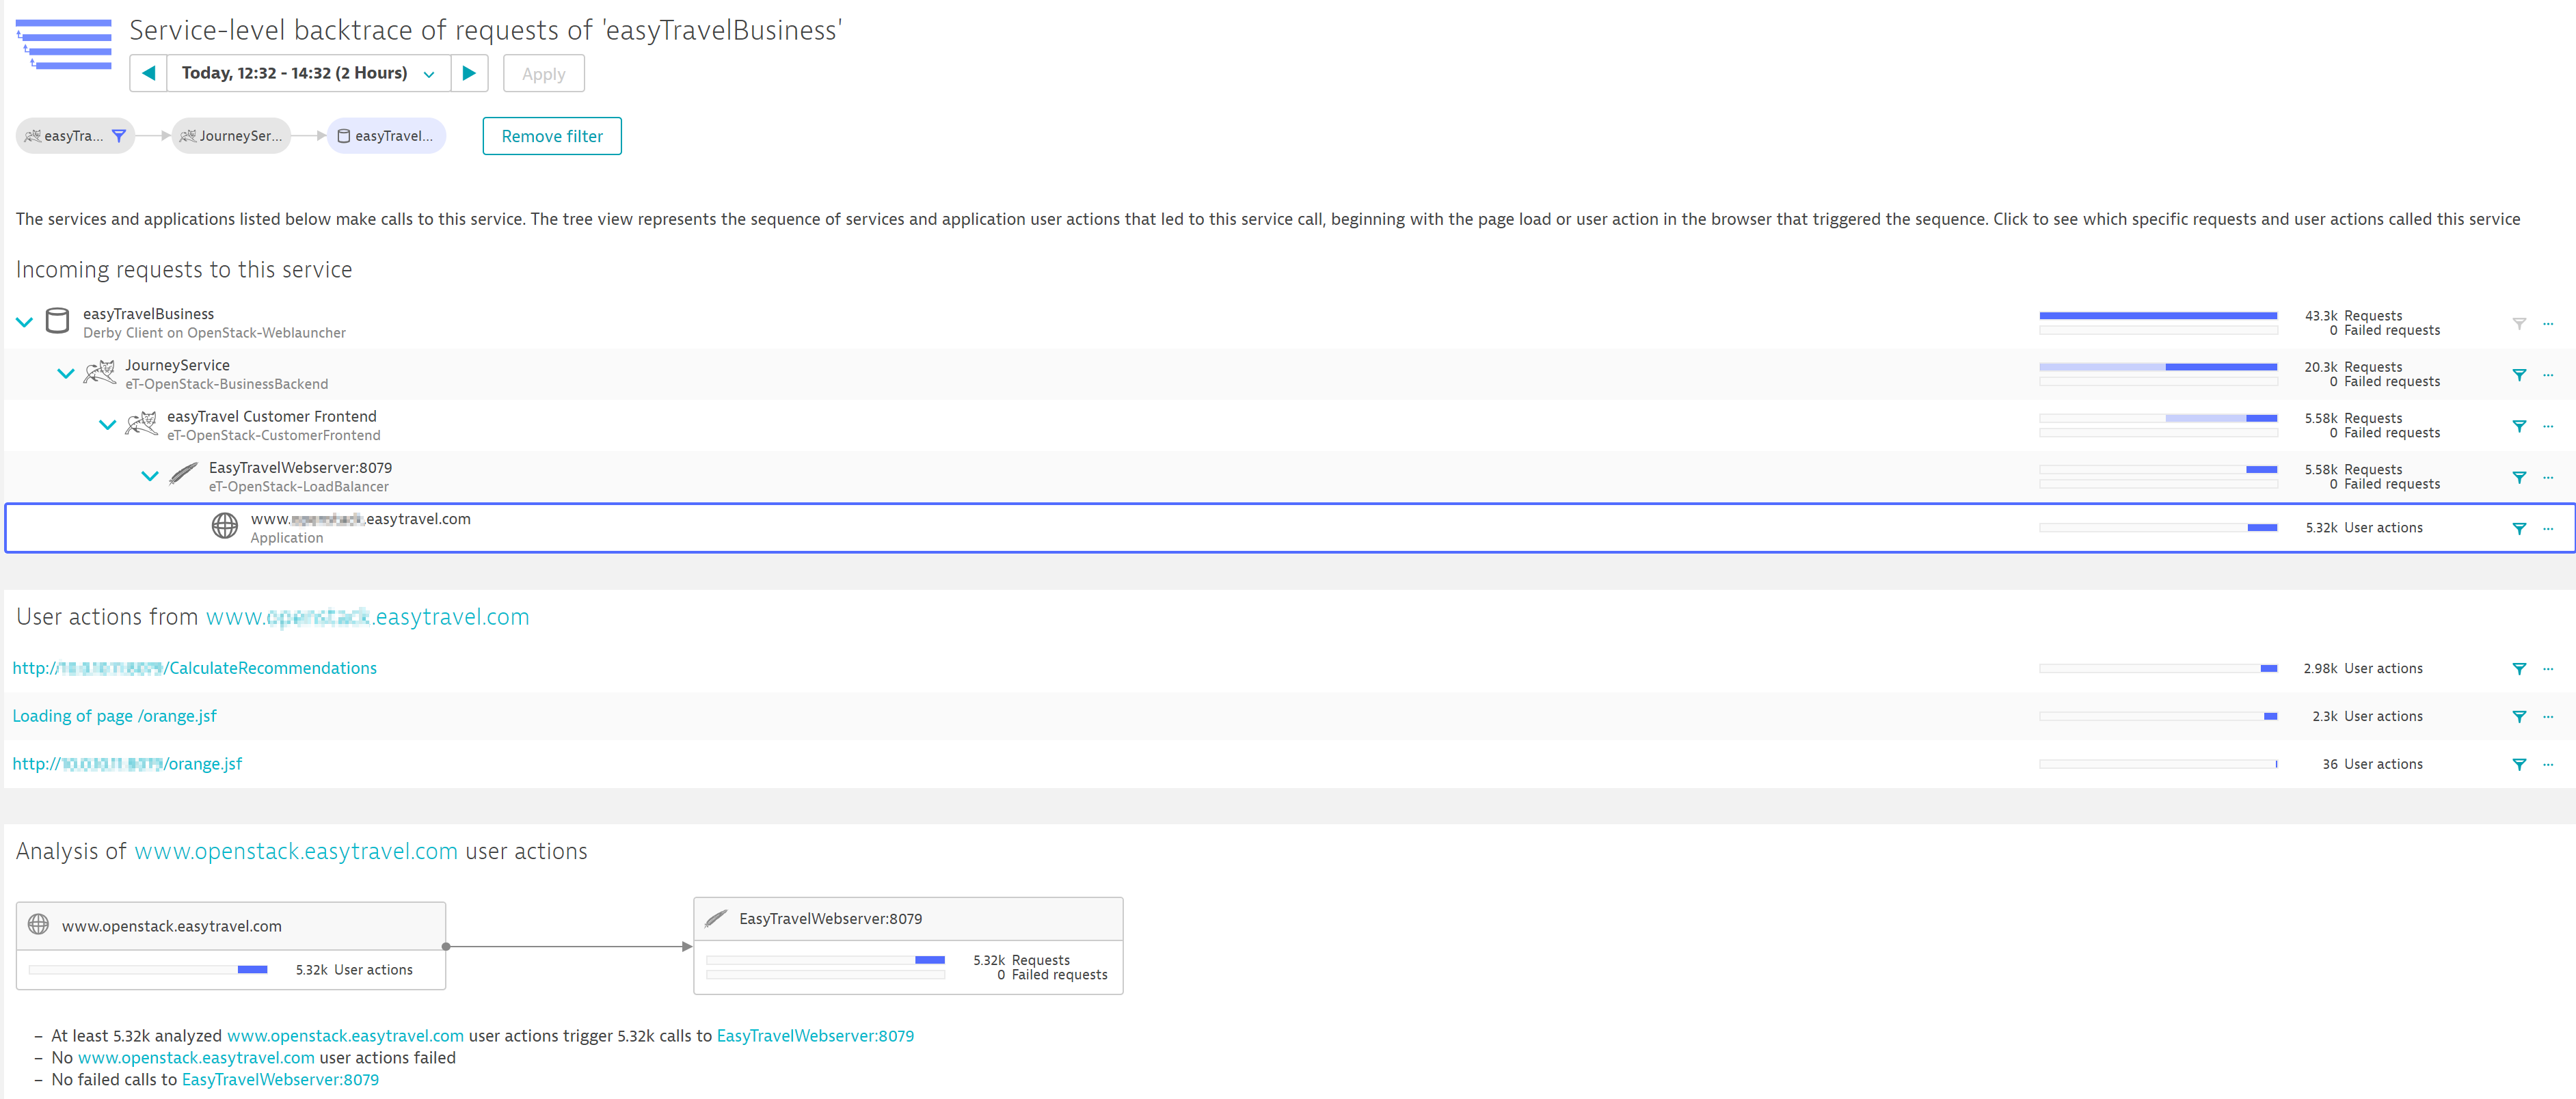
By selecting a specific application in the backtrace, you can find all user actions from this appliation that trigger the database statement you're analyzing. In the example above, you can see that the ~43k database requests originated from only about 5.32k user actions, and there are exactly 3 different user actions that trigger this statement. You can also see the chain of services that trigger this statement. By clicking this statement and investigating further, we can see that the ~5.3k user actions led to ~5.6k requests on our Apache web server, which is close to a 1:1 ratio. However, once the requests hit our easyTravel Customer Frontend service, these 5.6k requests lead to about 20k calls on the JourneyService. More investigation is required to determine why this is. To do this, select easyTravel Customer Frontend in the service call chain.
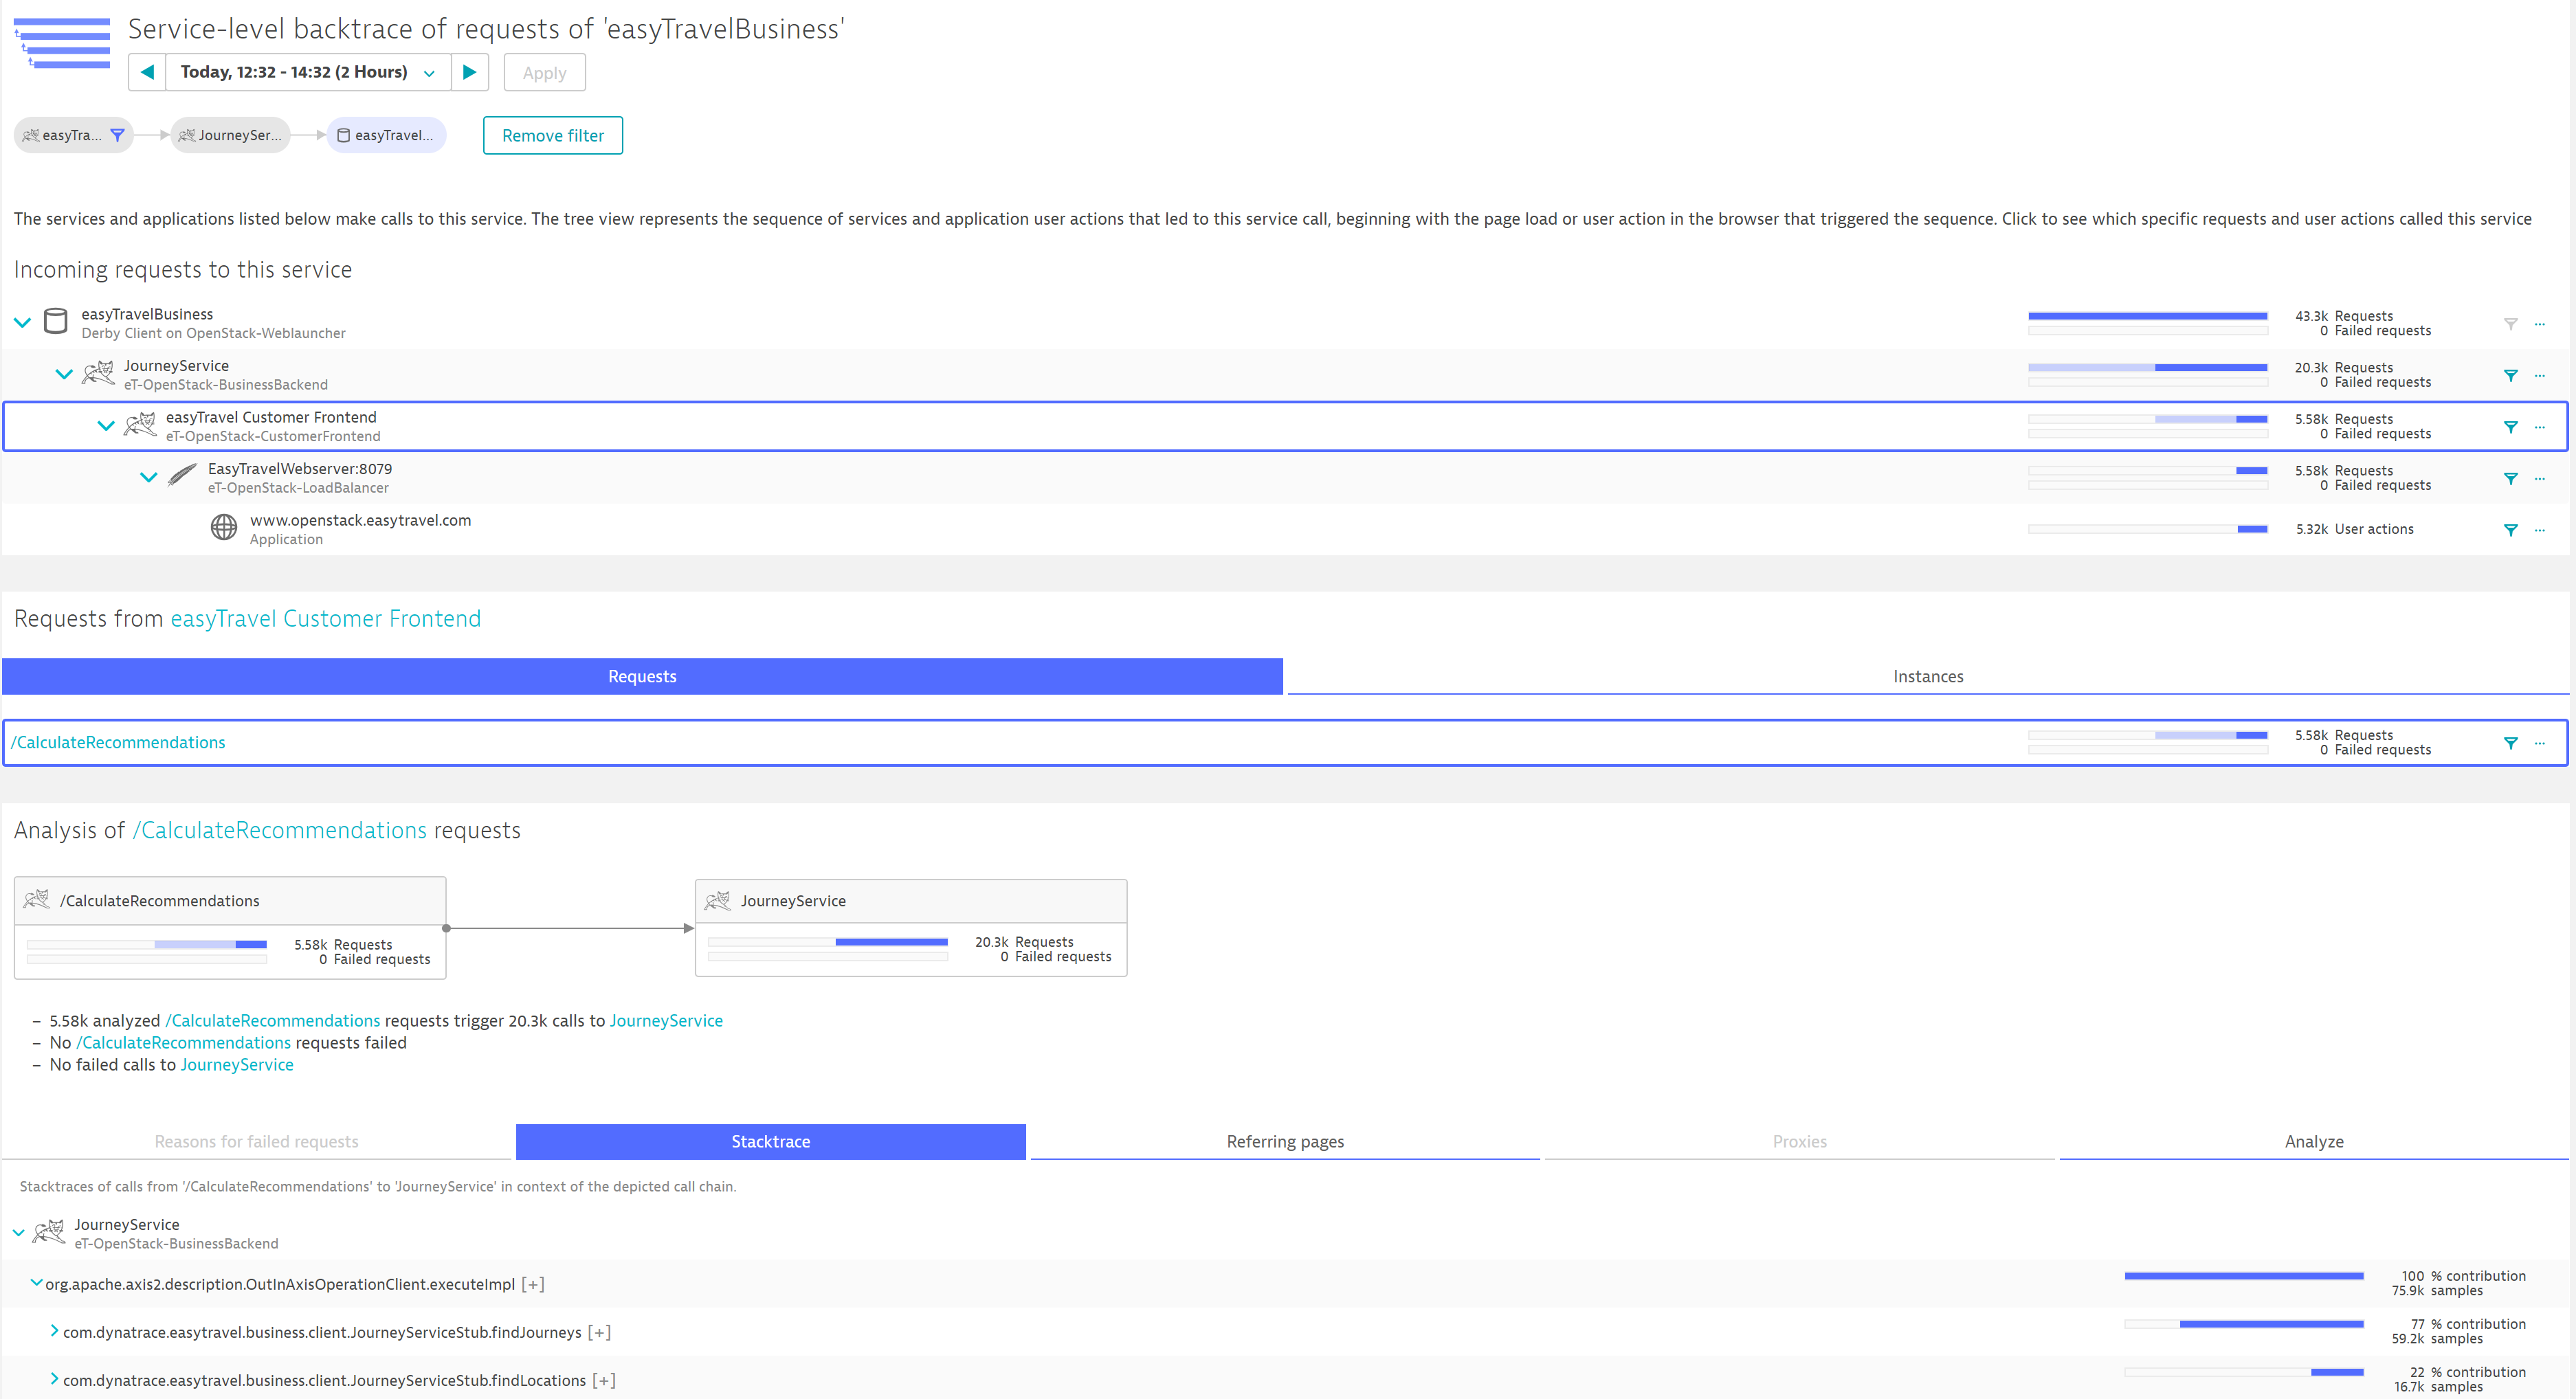
The lower section of the service backtrace adapts to the new selection and you now see that all these user actions call the /CalculateRecomendations request on the easyTravel Customer Frontend. If some of these requests have failed, you can analyze them in the corresponding tab. Here we're more interested in the code that leads to the database calls, so we select the Stacktrace tab to view the executed code in context.
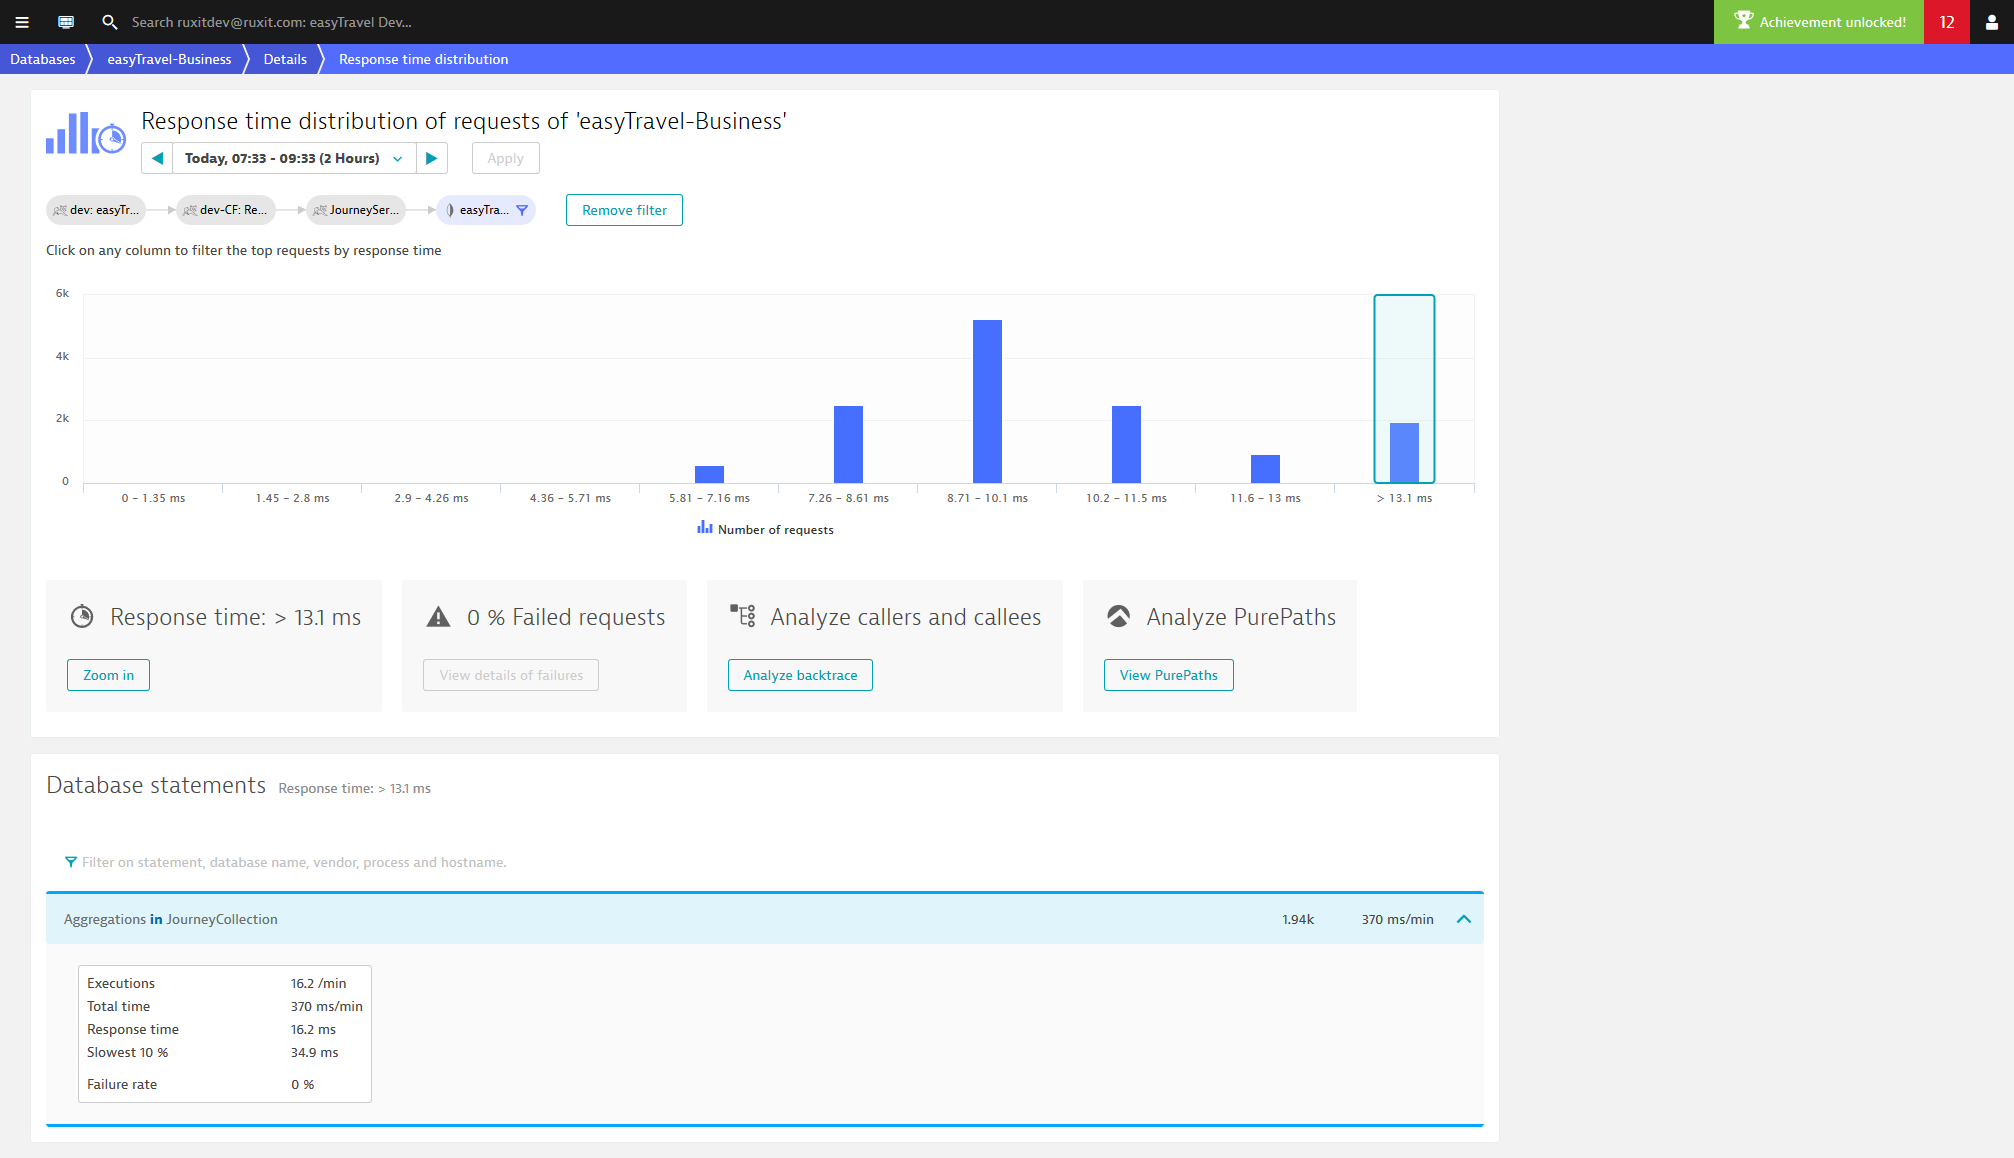
Response time distribution
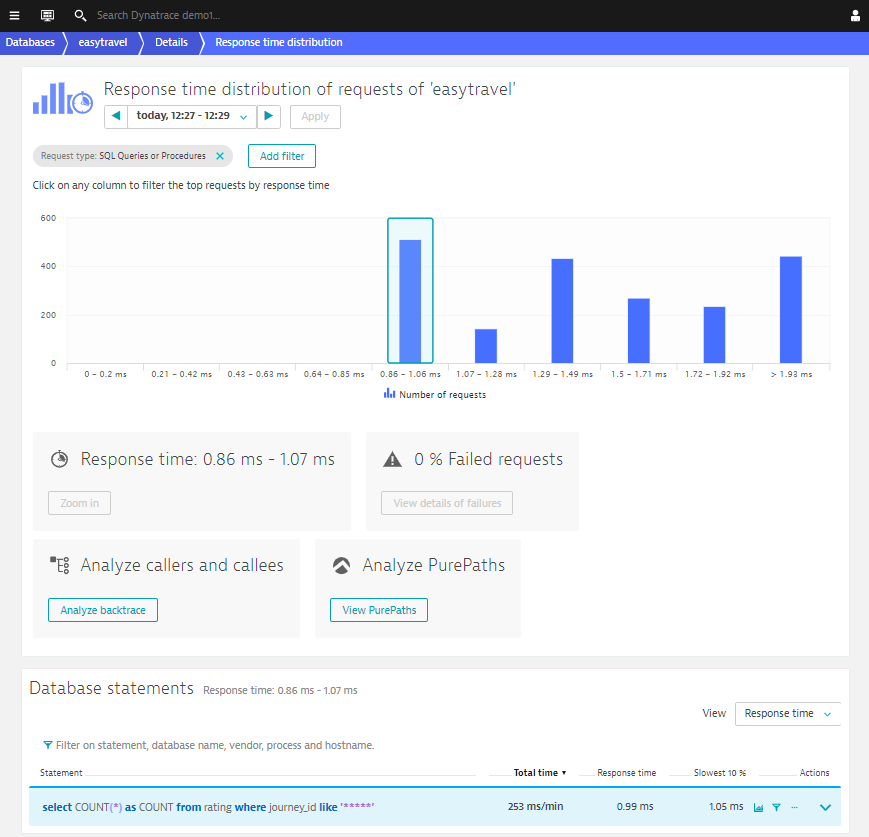
To understand the response time distribution of the command, click the Analyze Outliers button. The Response time distribution page shows the number of requests that fell within various response time ranges. Select any column in the chart to analyze the specific requests that fell within that specific response time range. This enables you to see if there are statemtns that are often called and contributes realatively long to the response time.
Analyze performance degradation
The real power of DESK database monitoring reveals itself when it comes to analyzing performance degradation.
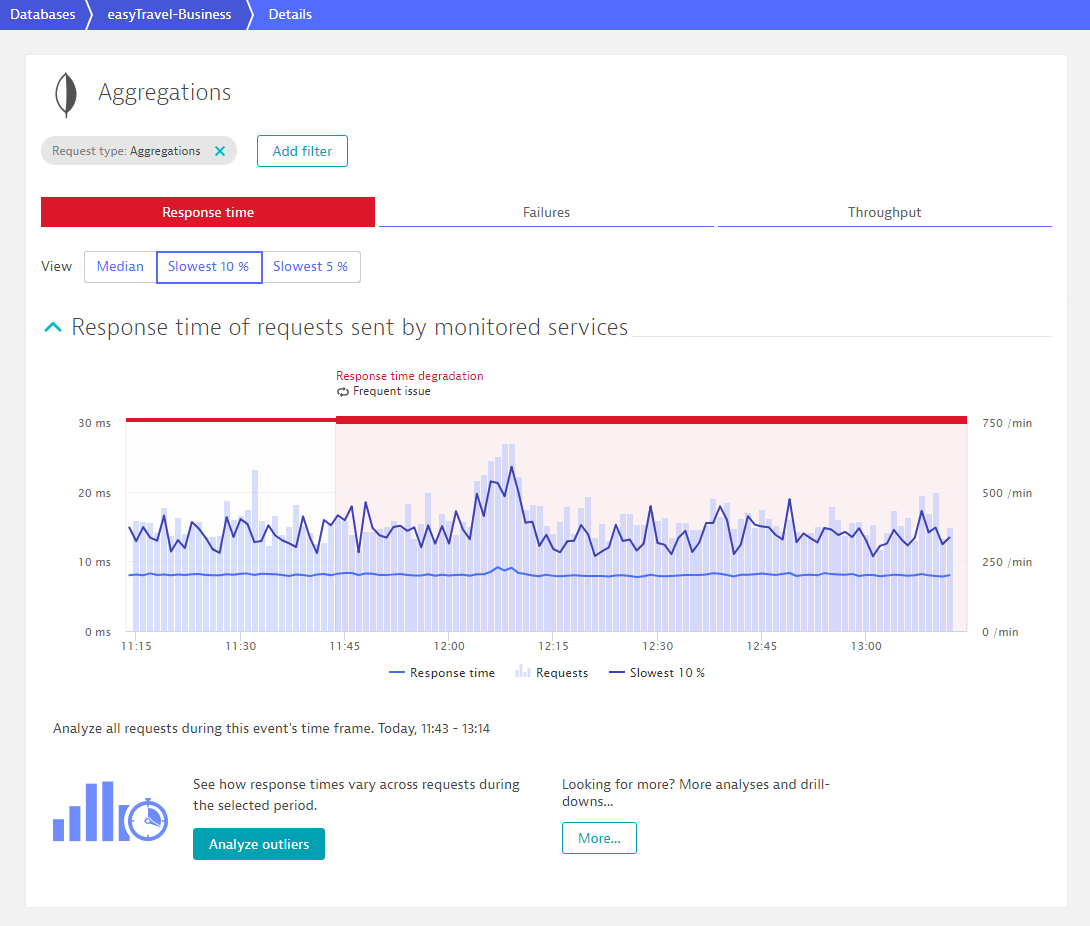
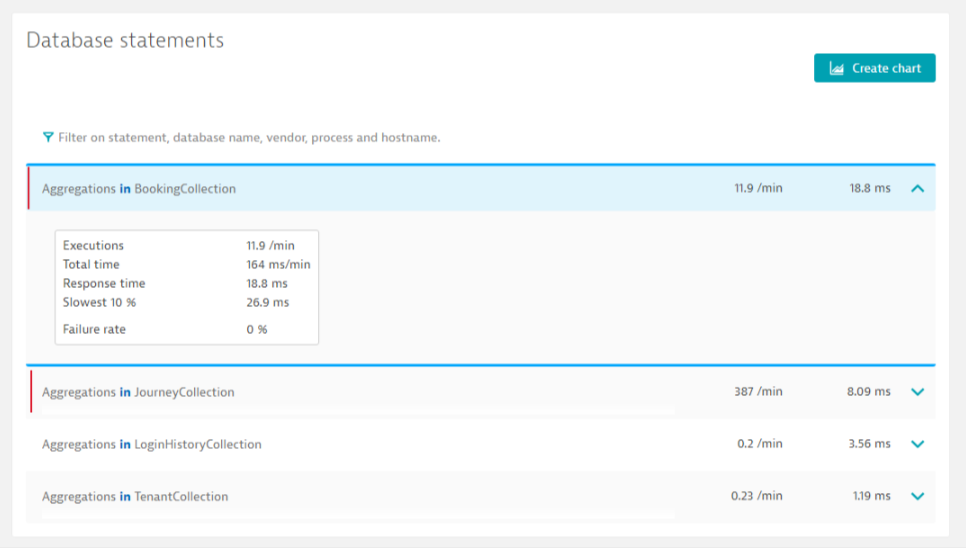
You can immediately see which statements are responsible for a detected slowdown—they're highlighted in the list of statements at the bottom of the page. In the example below, the detected response time degradation was caused by two statements (Aggregations in BookingCollection and Aggregations in JourneyCollection).
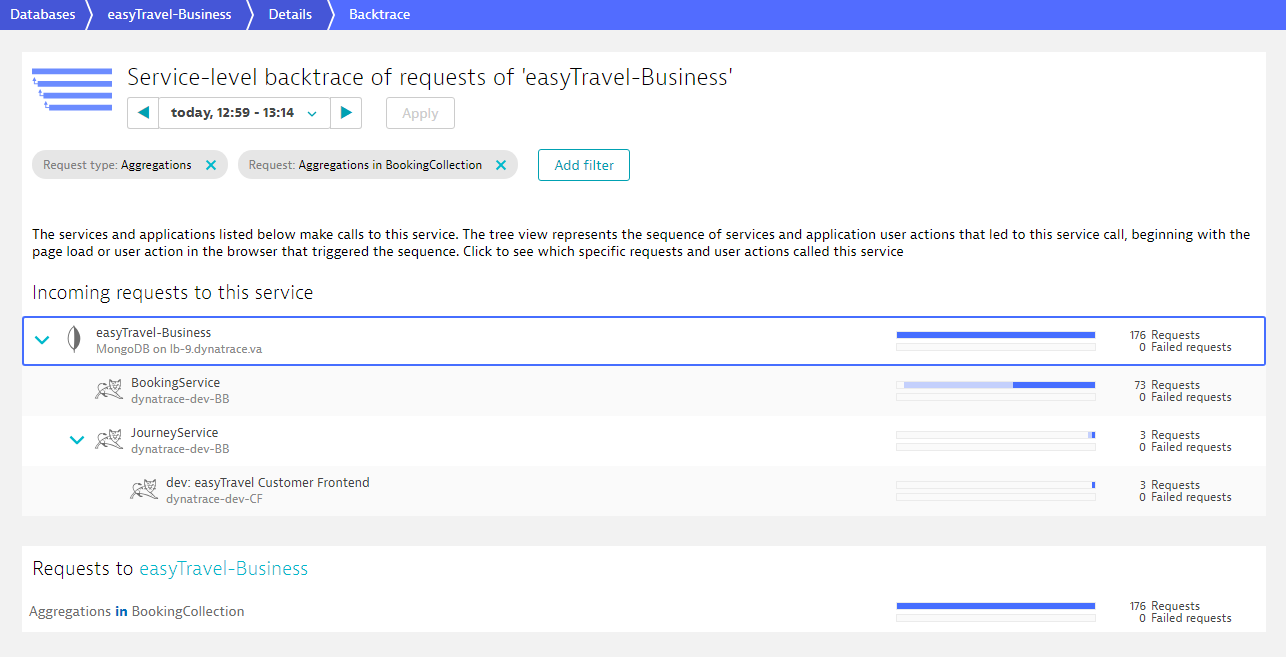
To see which service executed a specific statement that led to a database slowdown, click the statement's Service backtrace button (See the Aggregations in BookingCollection example below).
In this example, it's shown that the service that executed the statement that caused the slowdown is called easyTravel-Business.
Analyze database errors
Each tile on the database service overview page features a Failure rate graph.
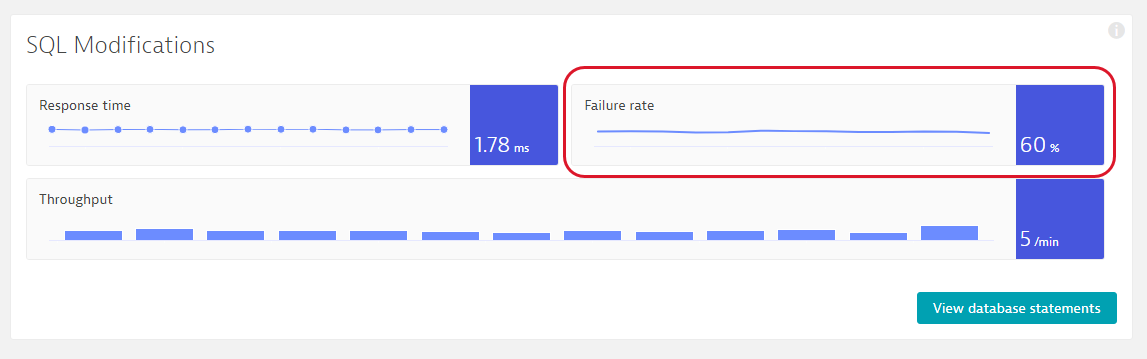
Click the Failure rate graph to open the Failures tab of the Details page.
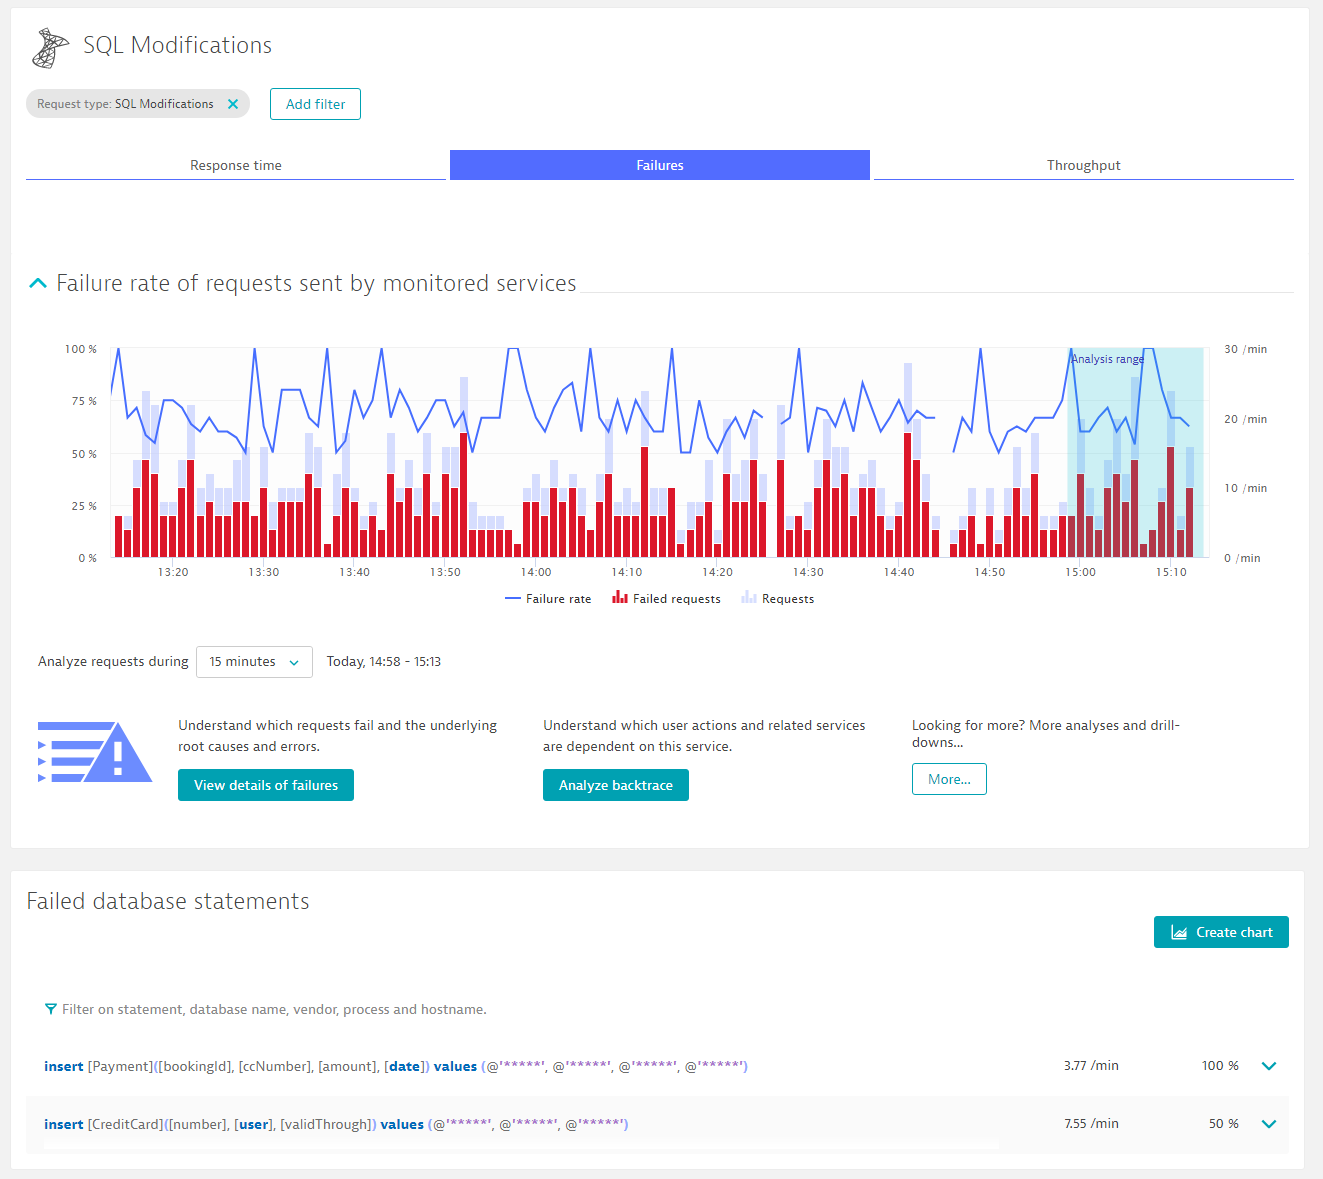
The Failed database statements table at the bottom of the page immediately shows which statements failed along with their individual failure rates.
Click the View details of failures button to understand the root cause of the failures.
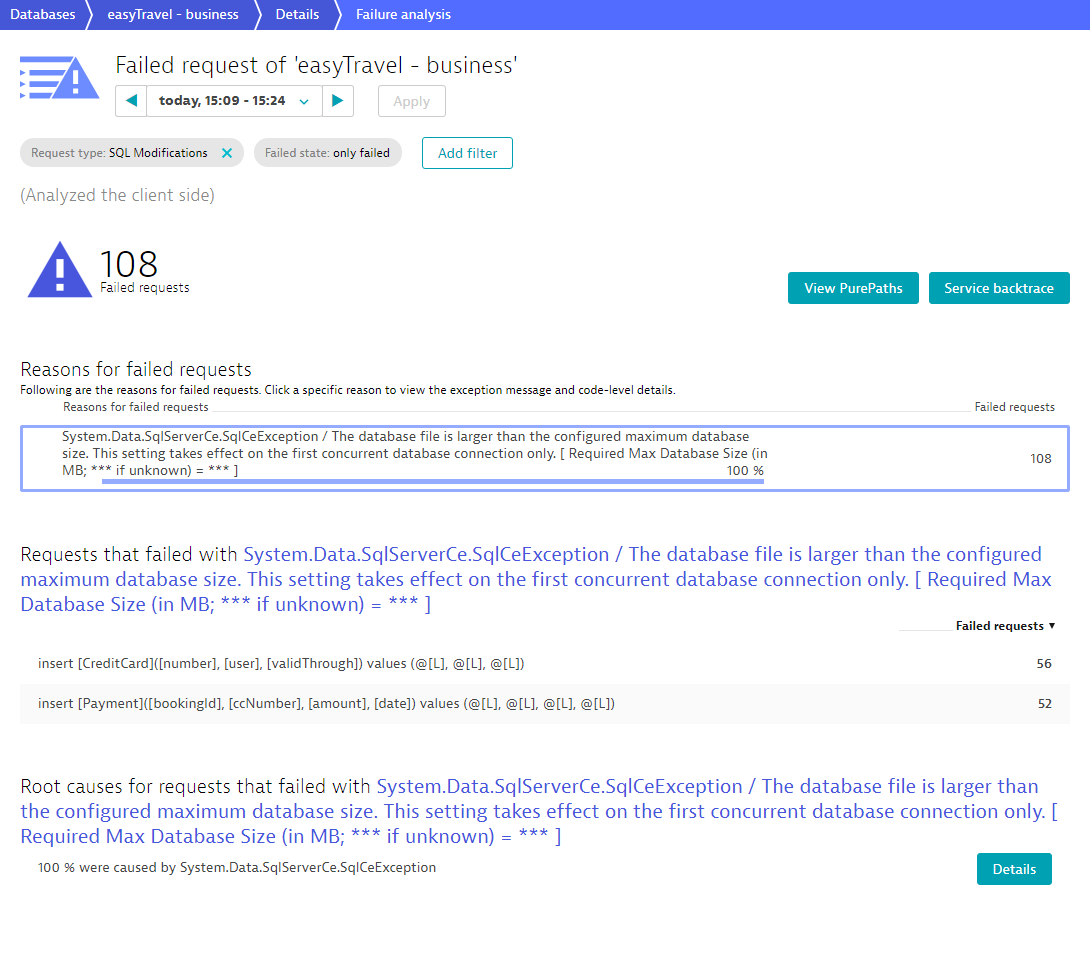
DESK has determined that the cause of the high failure rate in this example is a MySQL syntax error exception. This type of detailed error information can gives your developers the information they need to resolve database issues and eliminate future errors.
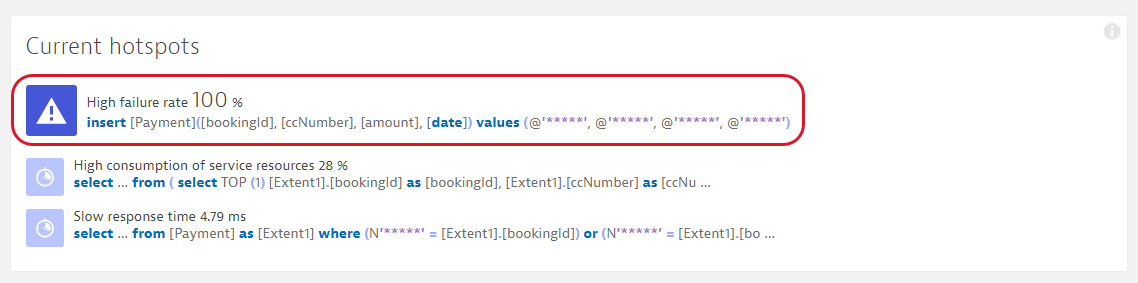
The statement with the highest failure rate is listed in the Current hotspots section of the database service overview page. Click the statement to view the Failures tab of that statement's Details page.
Service flow for SQL analysis
Service flow visualizes the sequence of service calls that are triggered by each service request in your environment. With Service flow you see the flow of service calls, including database-service calls, from the perspective of a single service, request, or their filtered subset.
To view the service flow triggered by a specific database service
- Select Transactions & services from the navigation menu.
- Click the service you want to analyze to open the service’s overview page.
- In the Understand dependencies section, click the View Service flow button.
While SQL analysis is available at multiple locations in the service-analysis workflow, it's the primary analysis view for databases in Service flow view.
The following example shows a database-service flow that has been filtered to focus on a particular chain of calls. You can see that whenever the Customer Frontend service calls the JourneyService, 25% of the response time contribution can be attributed to the EasyTravel-Business MongoDB service.
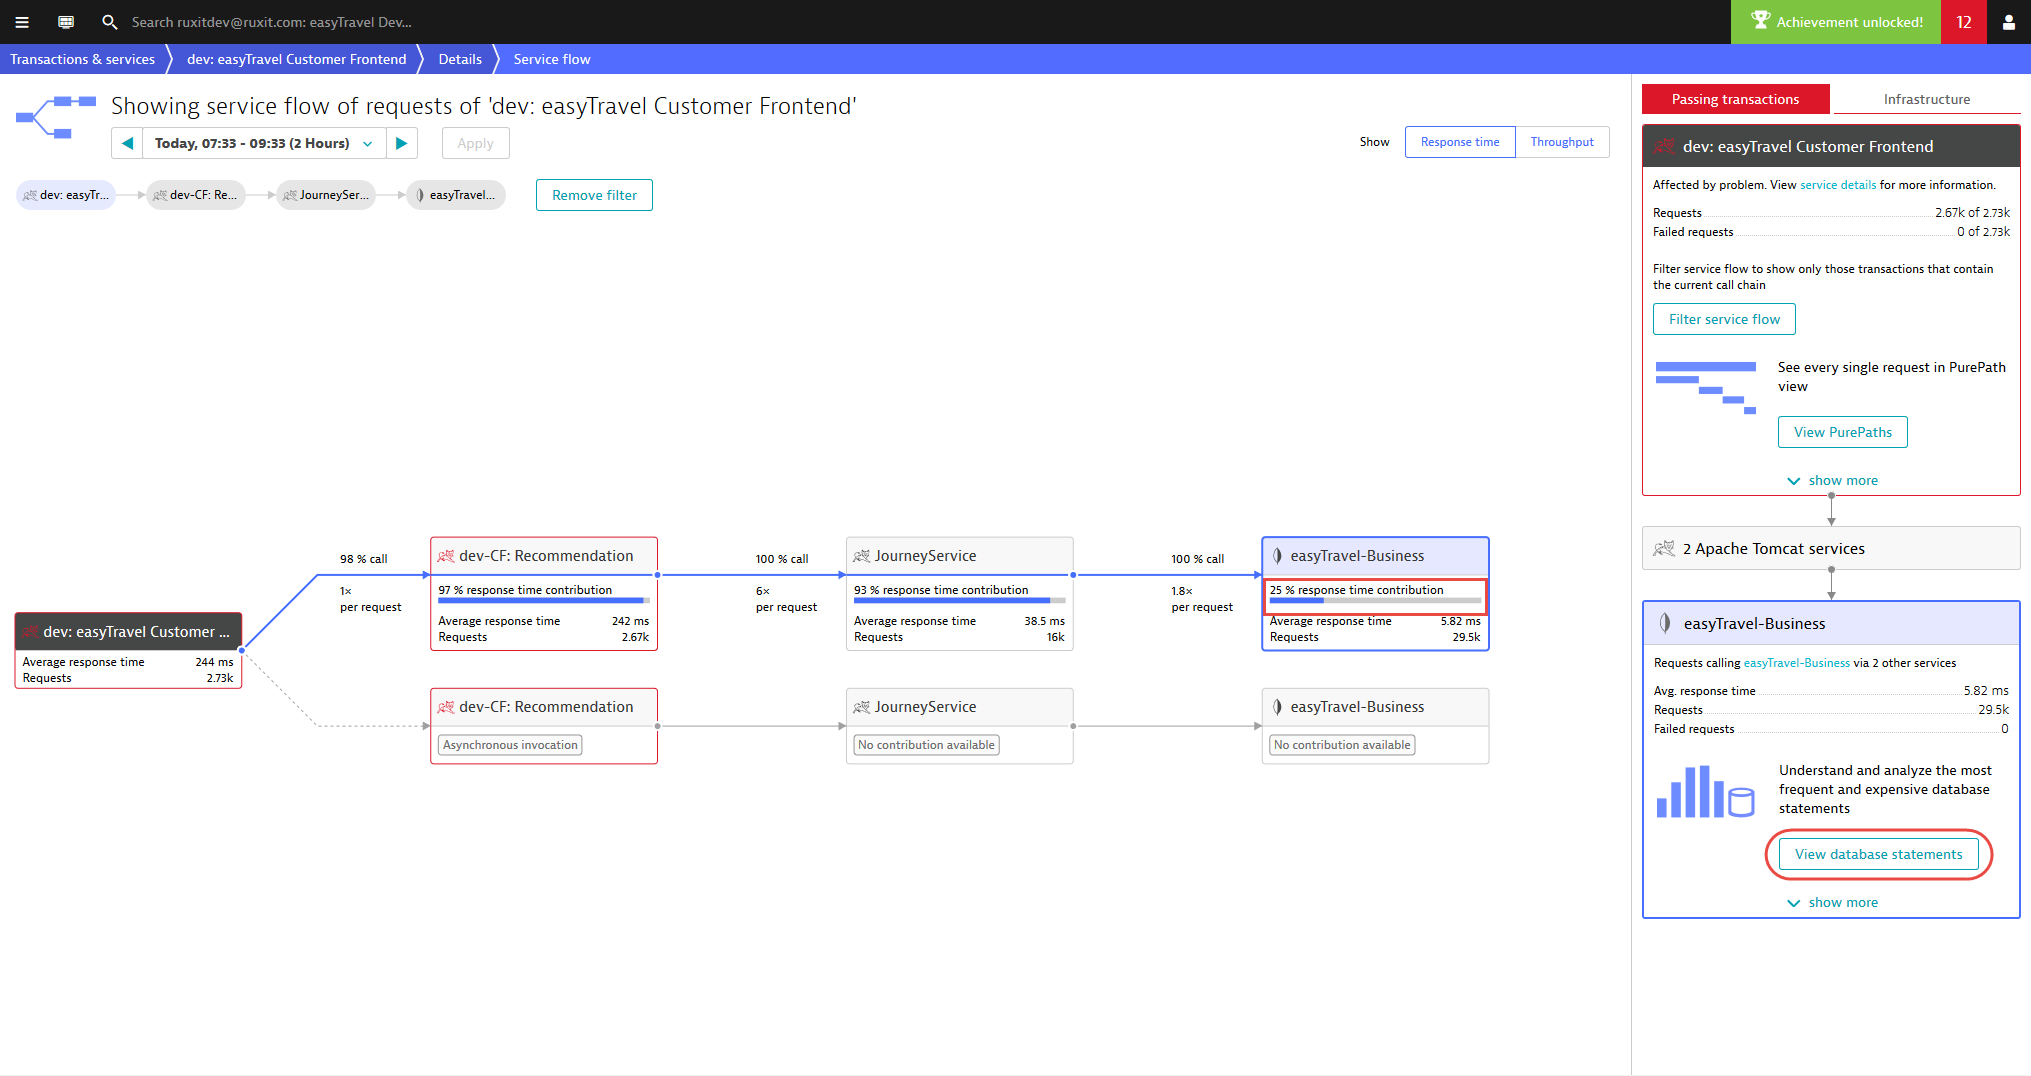
To view the database statements that were executed by the selected flow within the analysis time frame, click the View database statements button. This can be tremendously valuable because it helps you understand why a database contributes a certain amount of time.
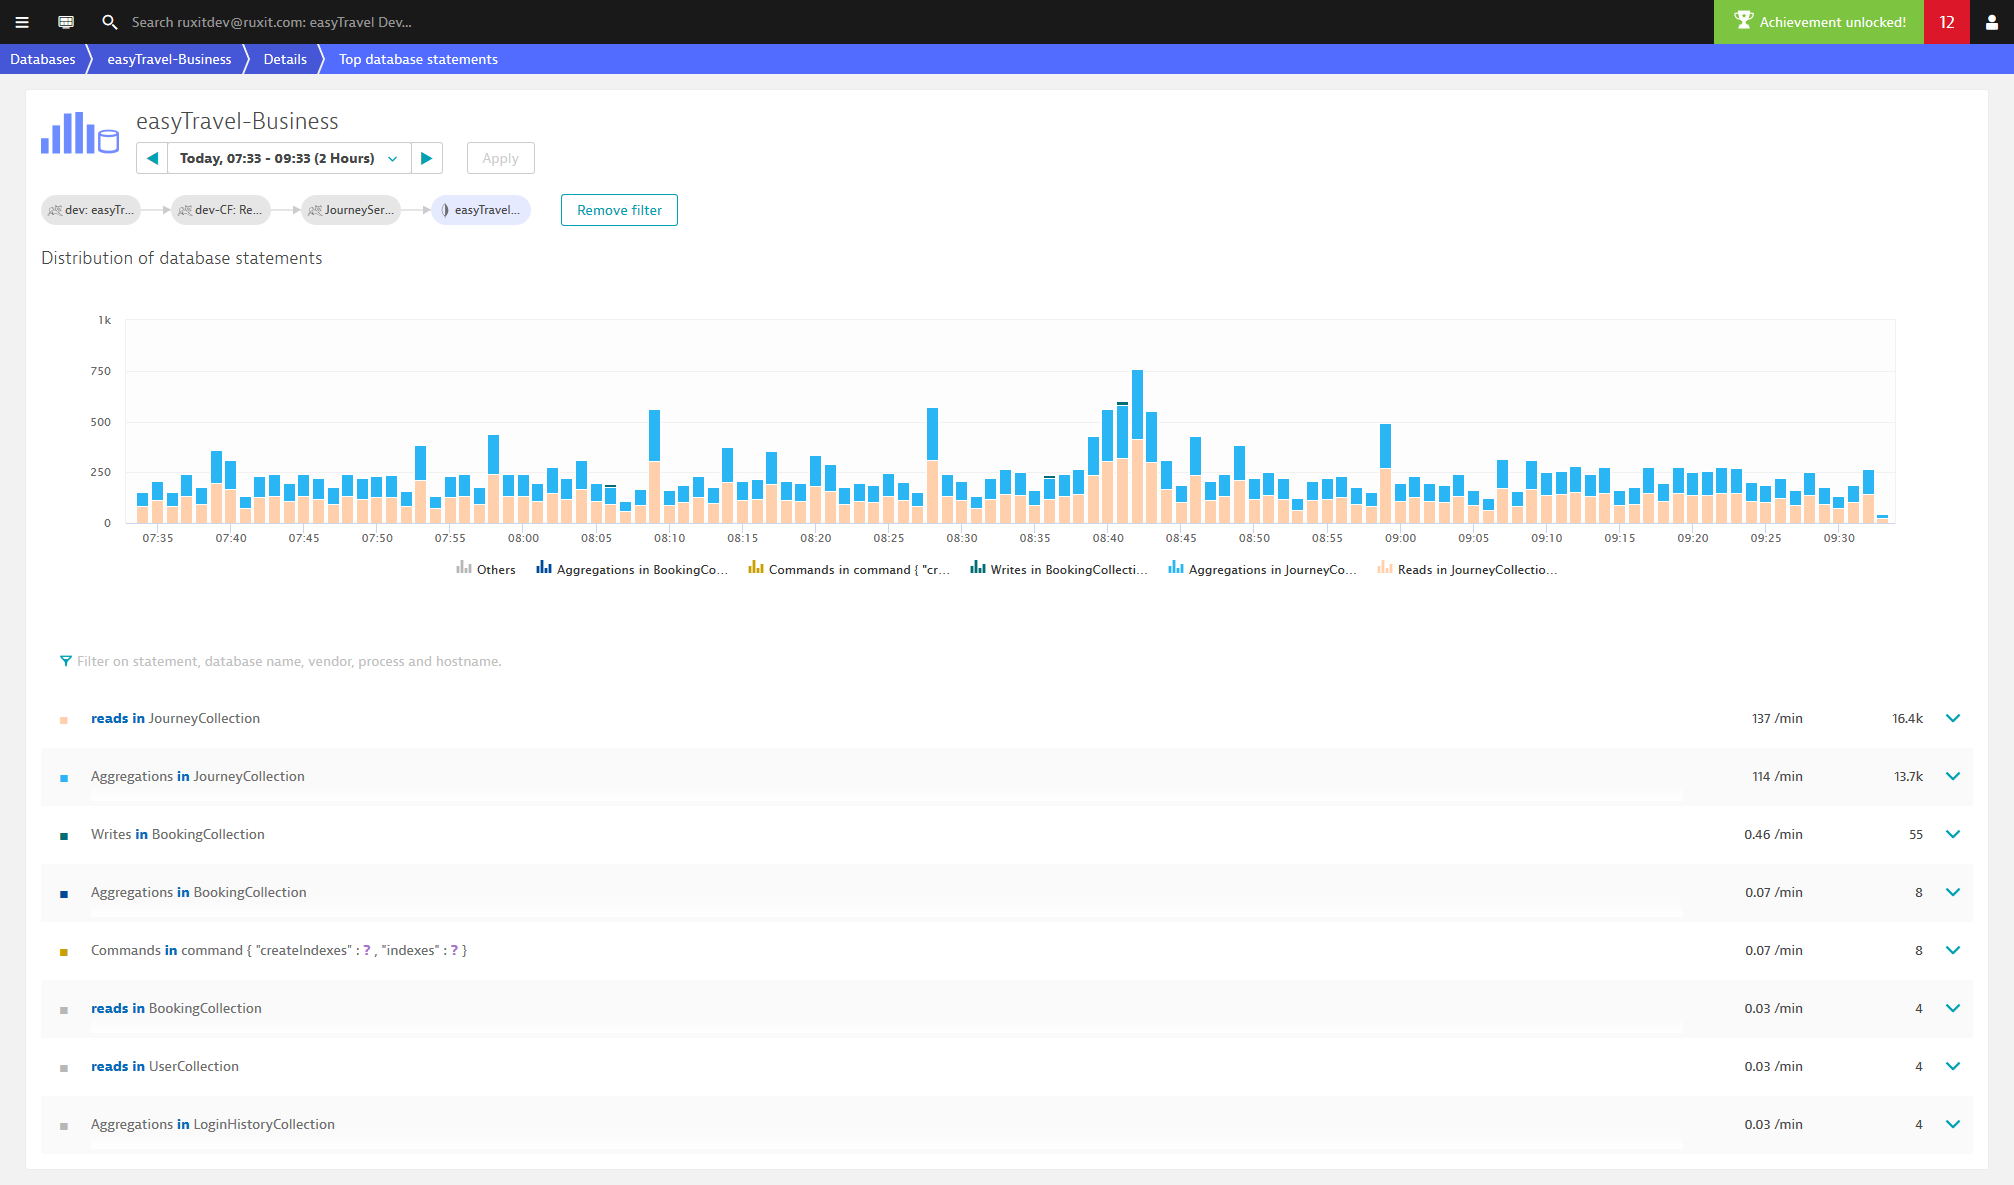
To reveal which statements have the highest overall response time, select Sort by total time from the Sort drop list.
To understand the spread of response times, click the Analyze outliers button.
To understand the evolution of each individual SQL statement that undergoes over time along with the average Rows returned count, click Details.
Click the Service backtrace button to see which user clicks led to the slowest executions of this MongoDB statement.
As you can see, DESK database-statement analysis views provide powerful database usage-focused analysis.