Analyze network performance and error rates for mobile apps
Poor client-side network performance negatively impacts the user experience of your mobile apps. DESK provides tools that give you insight into the usage of your mobile apps so that you can investigate issues and optimize performance.
To monitor a mobile app's network performance and error rate:
- Select Applications from the navigation menu.
- Select the application that you want to analyze.
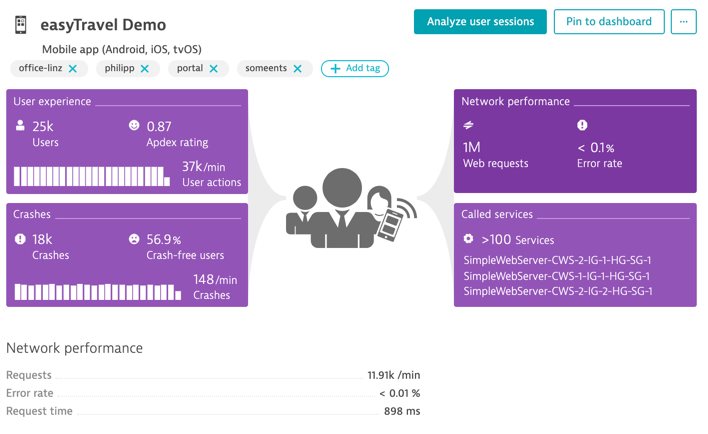
- To view the total number of HTTP requests and the overall error rate, click the Network performance tile.
- If you've instrumented more than one app platform, use the All app versions list to filter the list (All app versions, Android, or iOS).

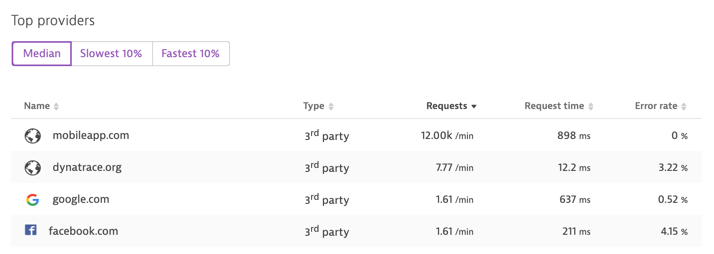
Top providers
This list includes the HTTP domains that contain the most outgoing requests that are triggered by the mobile app during the selected timeframe.

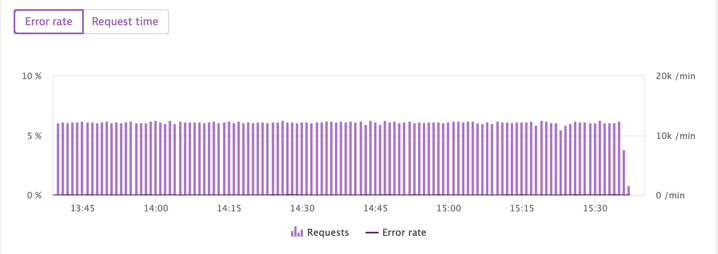
Error rate
This chart compares the number of network requests to total error rates during the selected timeframe.

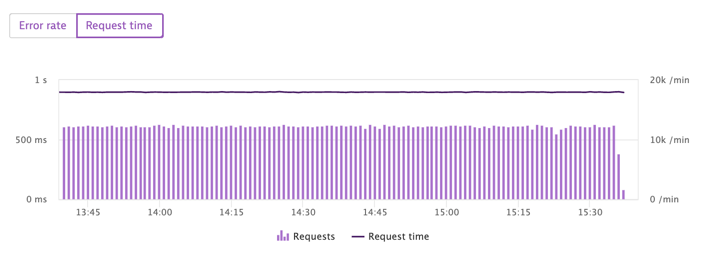
Request time
This chart compares total request performance with the total payload size.
