Identify memory leaks
Java harnesses the power of garbage collection to automatically keep application memory clean and healthy. However, it is not enough to keep away memory leaks.
Consider the following error message:
java.lang.OutOfMemoryError: Java heap space
If the issue is too little memory allocation, increase the available memory for your application:
java -Xms<initial heap size> -Xmx<maximum heap size>
If that doesn’t help, you could be facing a memory leak.
How to identify memory leaks
The best practice is to check your app for memory leaks even before you put it into production. As an initial indicator, check the garbage collection metrics. Select Technologies from the navigation menu and click on a Java-based technology tile. From the process group list appearing beneath, expand the process group you want to examine and then click Process group details. Here you can analyze technology-specific metrics by selecting the respective tab.
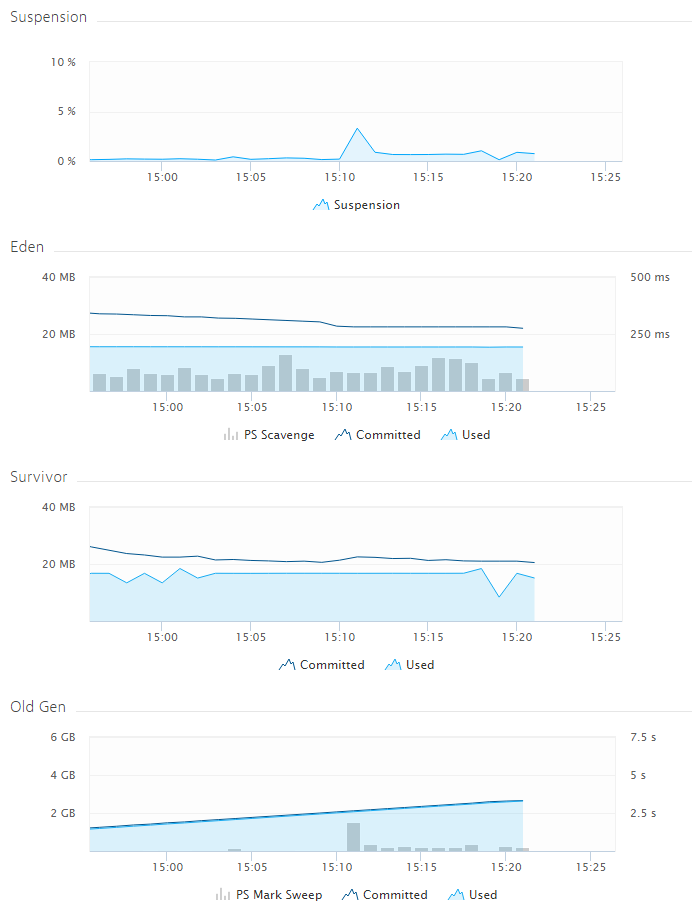
These graphs indicate a provoked memory leak. In reality, memory consumption does not rise as linearly as in the Old Gen graph. Also, neither GC Suspension times nor Eden and Survivor space usage act as indicators for memory leaks.
Use the following methods to identify and fix memory leaks:
-
Use tools such as JVisualVM and jStat that come with JDK to investigate the cause of these memory issues. In addition to identifying some frequently used internal Java classes, you may be able to identify some of your own classes.
-
Check your memory settings configuration because memory issues don’t only manifest themselves in the form of out-of-memory errors and memory leaks. Upcoming memory issues might manifest themselves in the form of high garbage collection times.
- Check the heap size:
-
When heap size is set too low, it leads to increased GC activity because GC must then be executed more often. Increased GC usage leads to increased CPU usage and poor performance resulting from JVMs freezing during GC. GCs are short but frequent. -
When heap size is set too high, you get long GC times. GC isn’t performed too often, but once triggered, it stops your VM for a considerable amount of time.
A memory leak combines the problems of too small heap size with the problem of too large heap size. GC is triggered frequently and takes longer before the JVM crashes with an out-of-memory error.
- Consider the GC versions. The garbage collector has changed a lot since Java 6. Java 7 introduces the G1GC as an alternative to the stock CMS GC (concurrent mark and sweep) which is slated to become the default for Java 9. Java 9 dropped the PermGen space. The data store there is now stored in either native memory or on the stack.
DESK SaaS and Managed not only display JVM stats but also correlate JVM metrics with other key indicators and compare GC suspension times with CPU usage, network traffic outages and more.