Monitor Kubernetes/OpenShift clusters
Kubernetes clusters are typically shared across teams and cluster owners are responsible for providing enough resources and capacity to properly host and run team workloads.
For cluster owners, it’s key to understand
- Cluster health and utilization of nodes
- Health status of individual nodes
- Actual usage of resources and how much resources has been requested
- How much additional workload can be deployed per node
DESK offers a dedicated built-in Kubernetes/OpenShift cluster overview pages that provides you with extended visibility into Kubernetes cluster performance and health.
Enable access to a Kubernetes cluster overview pages
To enable access to the overview page for a specific Kubernetes cluster, you need to connect your Kubernetes cluster to DESK. Connecting your Kubernetes clusters to DESK is possible beginning with DESK version 1.164 and ActiveGate version 1.163.
Once you enable access to a Kubernetes cluster overview page, you can get insights into your cluster via the Kubernetes API.
Kubernetes page
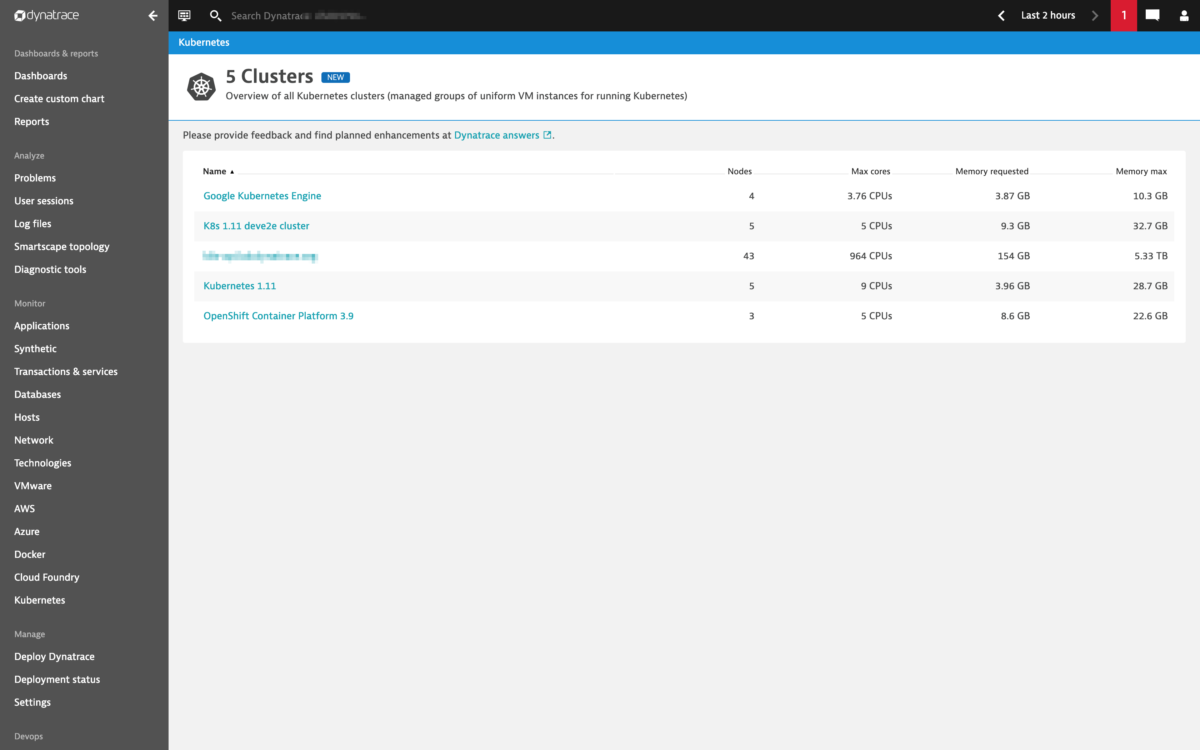
After you enable access to the Kubernetes overview page for a specific Kubernetes cluster, the specific cluster will appear on the Kubernetes page. The Kubernetes page provides an overview of all Kubernetes clusters showing monitoring data like the clusters’ sizing and utilization. To access this page, select Kubernetes from the navigation menu.
Utilization of cluster resources over time
As Kubernetes can run any containerized workloads and allow for horizontal pod autoscaling, the actual utilization of cluster resources will likely be very volatile. That is why DESK offers a single pane of glass for the most important utilization and performance metrics on a cluster level. These metrics are
- Actual CPU/Memory usage of cluster nodes (Min, Max, Median)
- Total of CPU/Memory requests of containers running on cluster nodes (Min, Max, Median)
- Total of CPU/Memory limits of containers running on cluster nodes (Min, Max, Median)—limits may be overcommitted, ie. over 100 %.
- Available CPU/Memory resources for running additional pods/workloads on cluster nodes (Min, Max, Median)
- Total CPU that can be allocated for pods (since a part of CPU is typically reserved by the system)
- Max Memory that can be allocated for pods
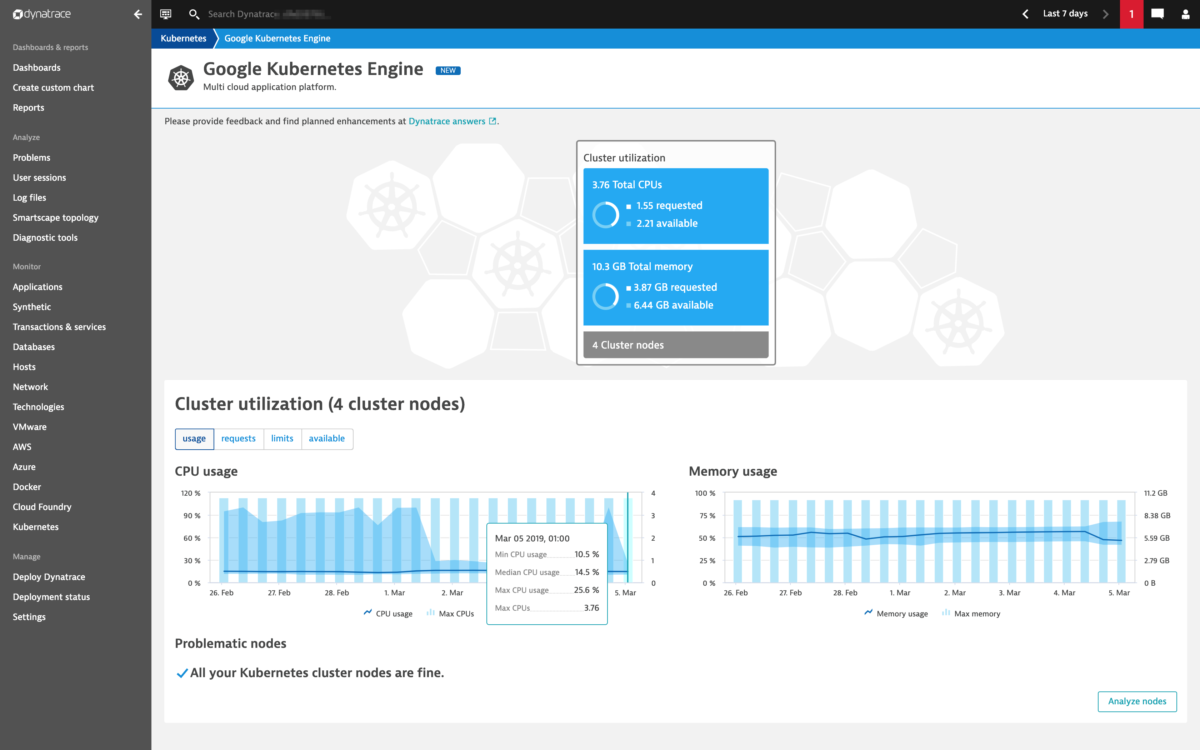
In the sample screenshot, the cluster has a total of 3.76 CPUs, where 1.55 are allocated through container CPU requests and 2.21 CPUs are still available for running further containers. The chart shows that there is at least one node with a CPU usage of 25.6% and the least utilized node has a CPU usage of 10.5%.
How many resources are available on your Kubernetes nodes
You can obtain detailed insights of the Kubernetes node metrics on a per-node level to understand how individual nodes are utilized. The Node analysis page also provides information about how much workload can still be deployed on nodes (i.e., metrics CPU/Memory available).
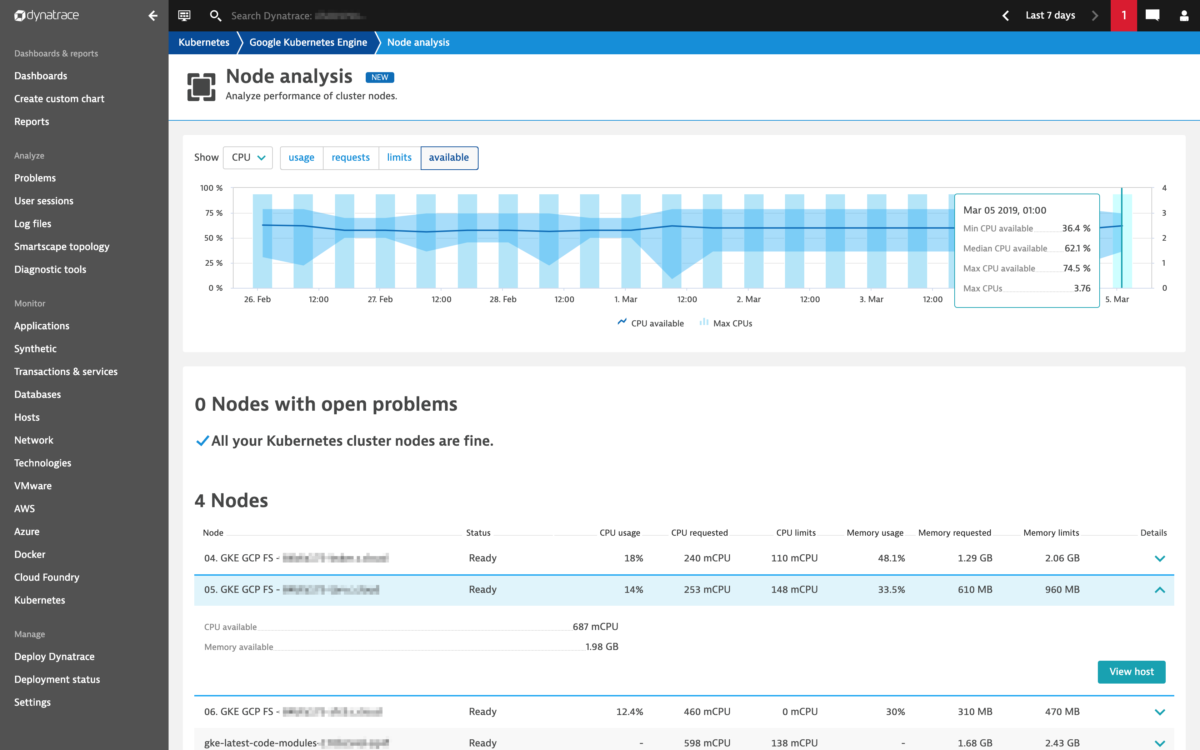
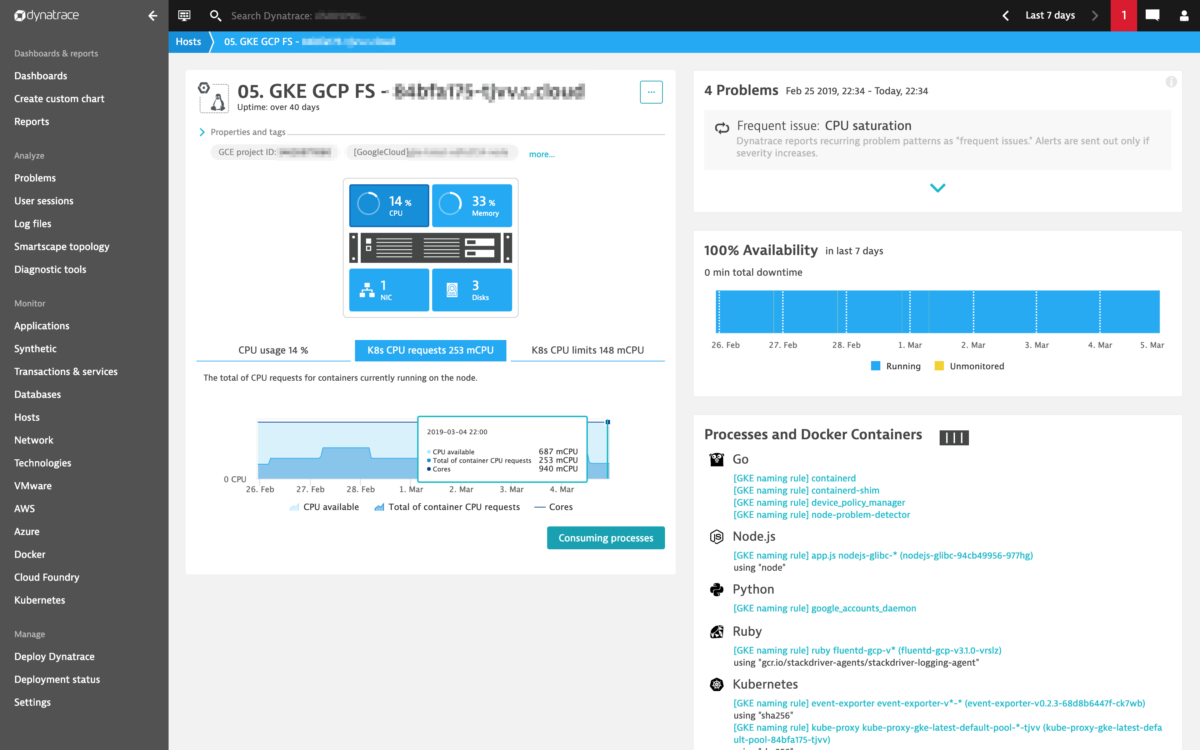
The View host button allows you to jump to the host details page to obtain code-level insights into currently deployed containers, all the relevant and cloud-specific host properties, and Kubernetes node labels.