Microsoft SQL Server
DESK monitoring of MS SQL provides insights that help pinpoint SQL Server performance issues and identify potential bottlenecks.
Prerequisites
- Microsoft SQL Server 2008, 2012-2017
- See list of supported MS SQL versions
- MS SQL Server performance counters need to be present on the host. See Troubleshooting for verification details.
Viewing MS SQL monitoring metrics
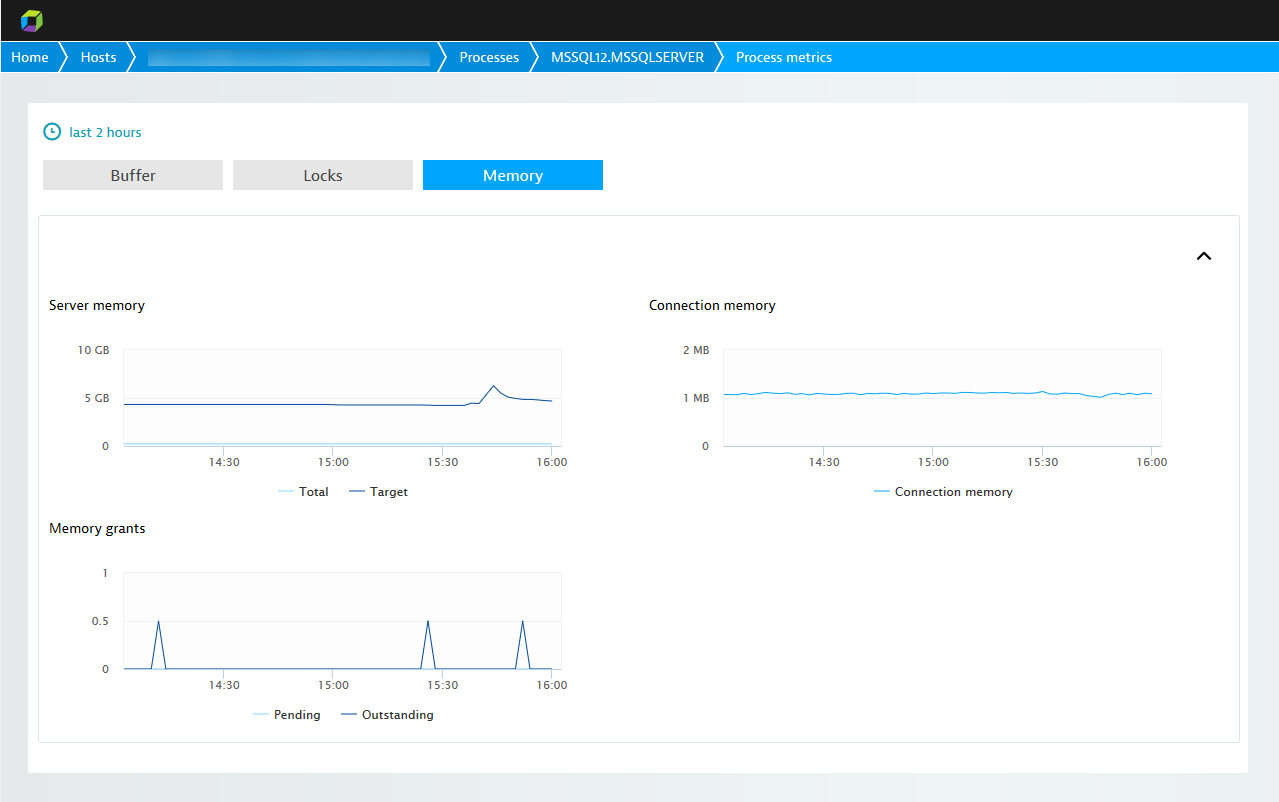
Captured MS SQL metrics are displayed on MS SQL Process pages. Click the infographic or the SQL metrics and Further details tabs to view metric details.
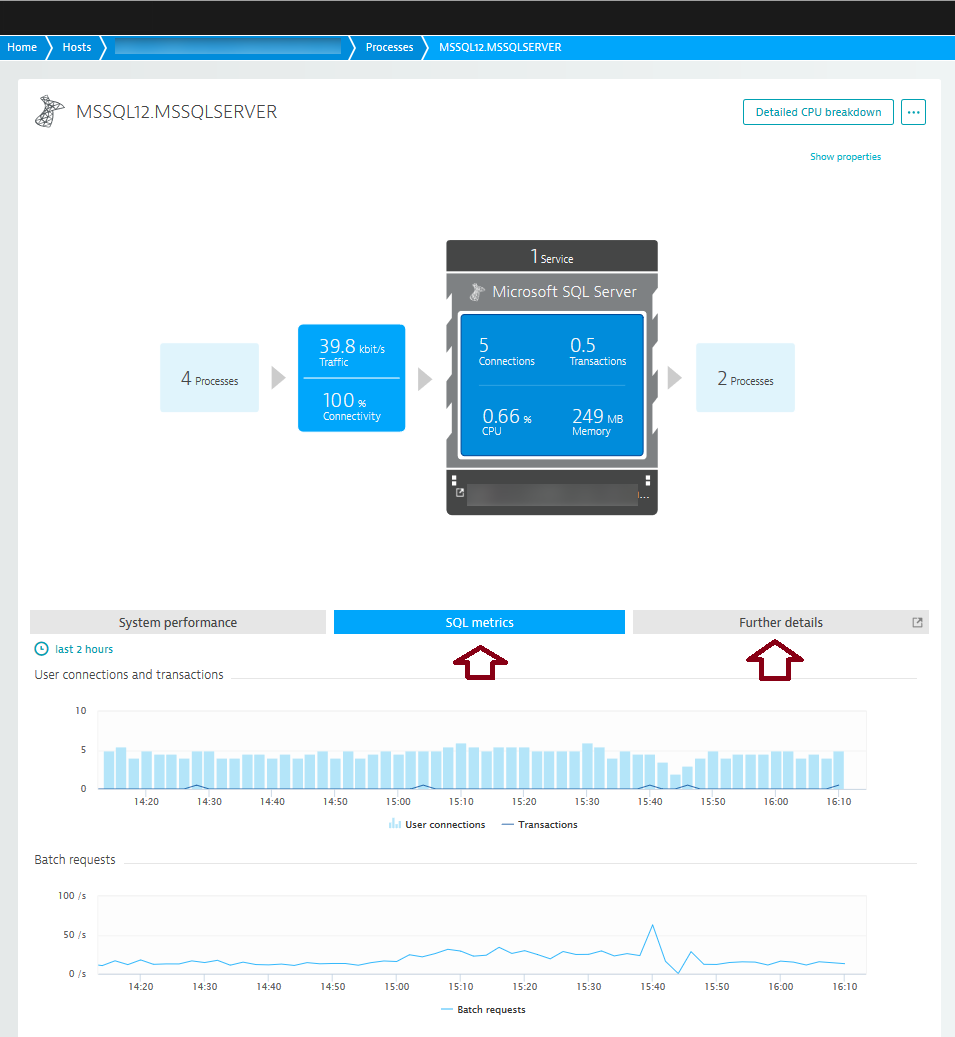
Collected metrics
| User connections | Number of users connected to SQL Server. |
| Transactions | Number of currently active transactions (all types). |
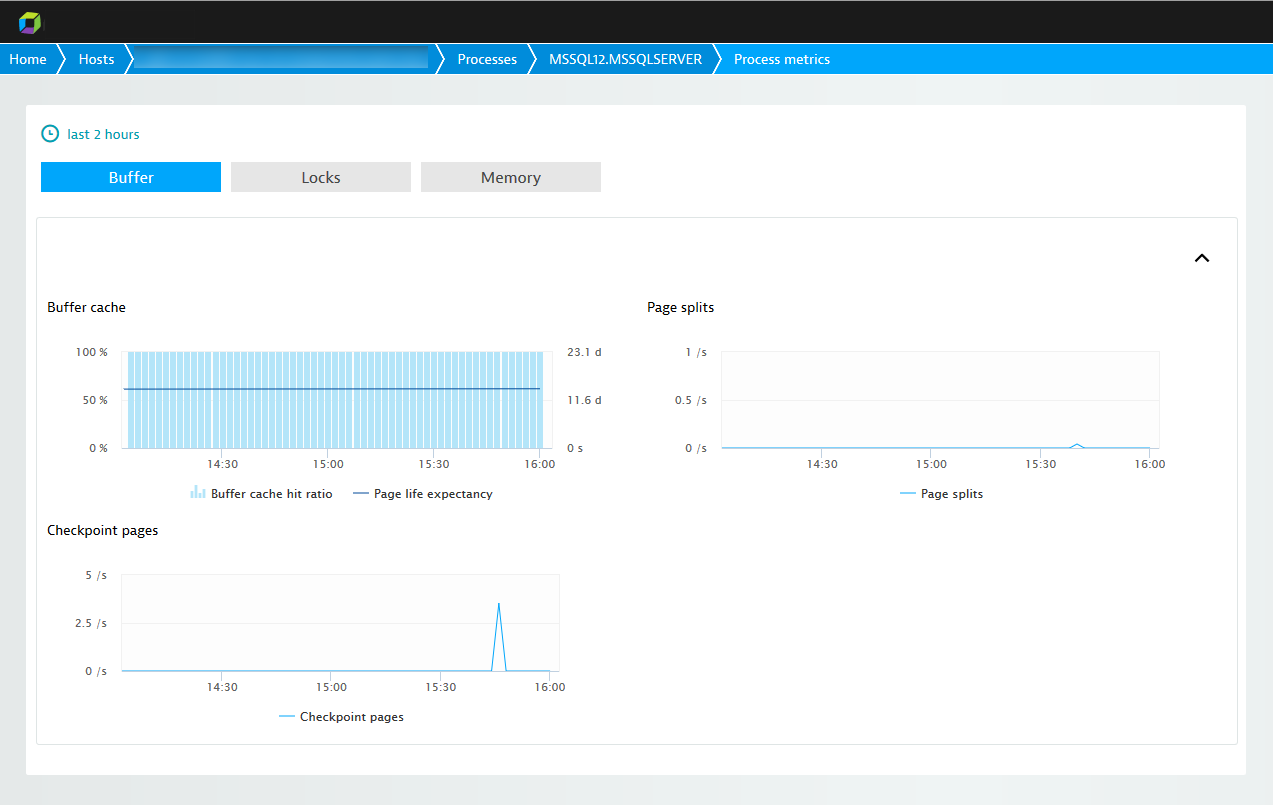
| Buffer cache hit ratio | The buffer cache hit ratio counter represents how often SQL Server is able to find data pages in its buffer cache when a query requests a data page. The higher this number is the better because it means that SQL Server was able to get data for queries out of memory instead of reading from disk. |
| Page life expectancy | Measures how long pages stay in the buffer cache (seconds). The longer a page stays in memory the more likely that SQL Server won't need to read from disk to resolve a query. |
| Batch requests | Reflects the number of batches SQL Server receives per second. This counter is a good indicator of how much activity is processed by your SQL Server box. |
| Compilations | The number of times SQL Server compiles an execution plan per second. Compiling an execution plan is a resource-intensive operation. The number of Compilations per second should be compared to the number of Batch requests per second to see if complications are affecting performance. |
| Recompilations | When an execution plan is invalid due to some significant event, SQL Server re-compiles the plan. The Re-compilations per second counter measures the number of times a re-compile event is triggered per second. |
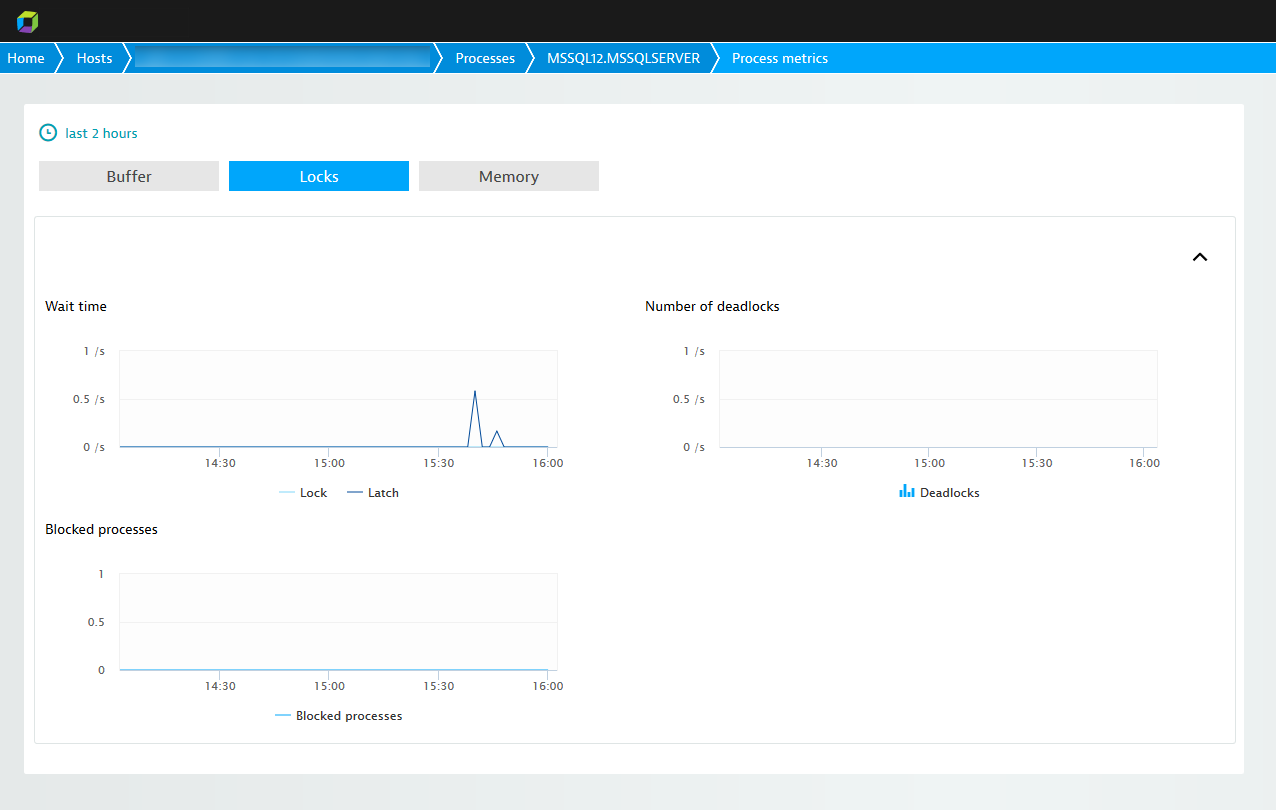
| Lock wait time | In order for SQL Server to manage concurrent users on the system, SQL Server needs to lock resources from time to time. The Lock waits per second counter tracks the number of times per second that SQL Server is not able to immediately retain a lock for a resource. |
| Latch wait time | Average Latch wait time in milliseconds for latch requests that had to wait. If this number is high, your server may have resource limitations. |
| Page splits | Measures the number of times per second that SQL Server had to split a page when updating or inserting data. Page splits are expensive and cause tables to perform poorly due to fragmentation. The fewer page splits the better. |
| Processes block | The Processes blocked counter identifies the number of times that a process blocked another process. Blocked processes cannot move forward with an execution plan until the resource that is causing the block is free. |
| Checkpoint pages | Reflects the number of pages written to disk by a checkpoint operation. If this counter is climbing, it may mean that you're running into memory pressures that are causing dirty pages to be flushed to disk more frequently than normal. |
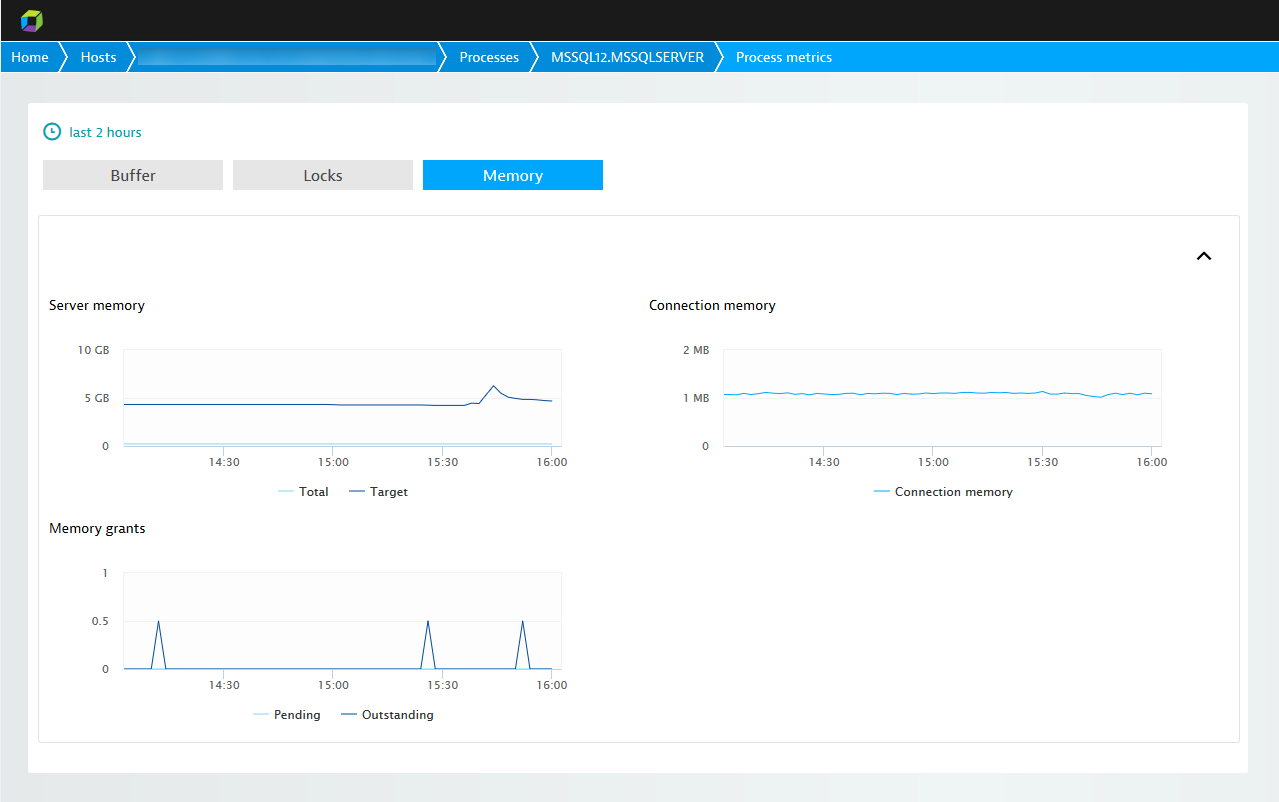
| Target server memory | Total amount of dynamic memory the server is willing to consume. |
| Total server memory | Memory allocated to the SQL Server. |
| Connection memory | Total amount of dynamic memory the server uses to maintain connections. |
| Memory grants pending | Total number of processes per second waiting for a workspace memory grant. |
| Memory grants outstanding | Total number of processes per second that have successfully acquired a workspace memory grant. |
Enabling MS SQL monitoring
To enable MS SQL monitoring globally:
- In the navigation menu, select Settings.
- Select Monitoring > Monitored technologies.
- On the Supported technologies tab, set the MS SQL switch to the On position.
Note: With MS SQL monitoring enabled globally, when a new host running MS SQL is detected in your environment, DESK automatically collects MS SQL metrics.
DESK also allows you to enable MS SQL monitoring for specific hosts rather than globally. To do this, first disable the global MS SQL monitoring setting explained above then click the host settings link near the top of the page.
Troubleshooting
To monitor MS SQL with DESK, the MS SQL Server performance counters need to be present on the host. They must be available for a user belonging to the Performance Monitor Users group. You can verify this as follows:
- Open a Command Prompt window on the MS SQL host.
- Issue command
typeperf -q > counters.txt - Inspect the contents of
counters.txtto verify that theMSSQL*counters are present.
The counters should be registered with the MS SQL installation out of the box. When they aren’t, it indicates something wrong with the MS SQL installation. Possible approaches to resolving your issue are described in Microsoft documentation such as SQL Performance Counters are Missing (external link).