Where do I view AWS monitoring results?
Your home dashboard
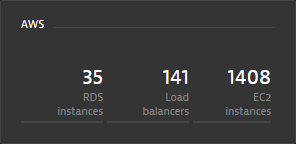
The AWS account tile is included on your home dashboard by default. This tile gives you a high-level overview of the AWS services in your account, distinguishing between healthy and unhealthy services. The contents of this tile vary based on your Amazon account configuration and the services you're running in your environment (EC2, RDS, EBS and ECB).
AWS account page
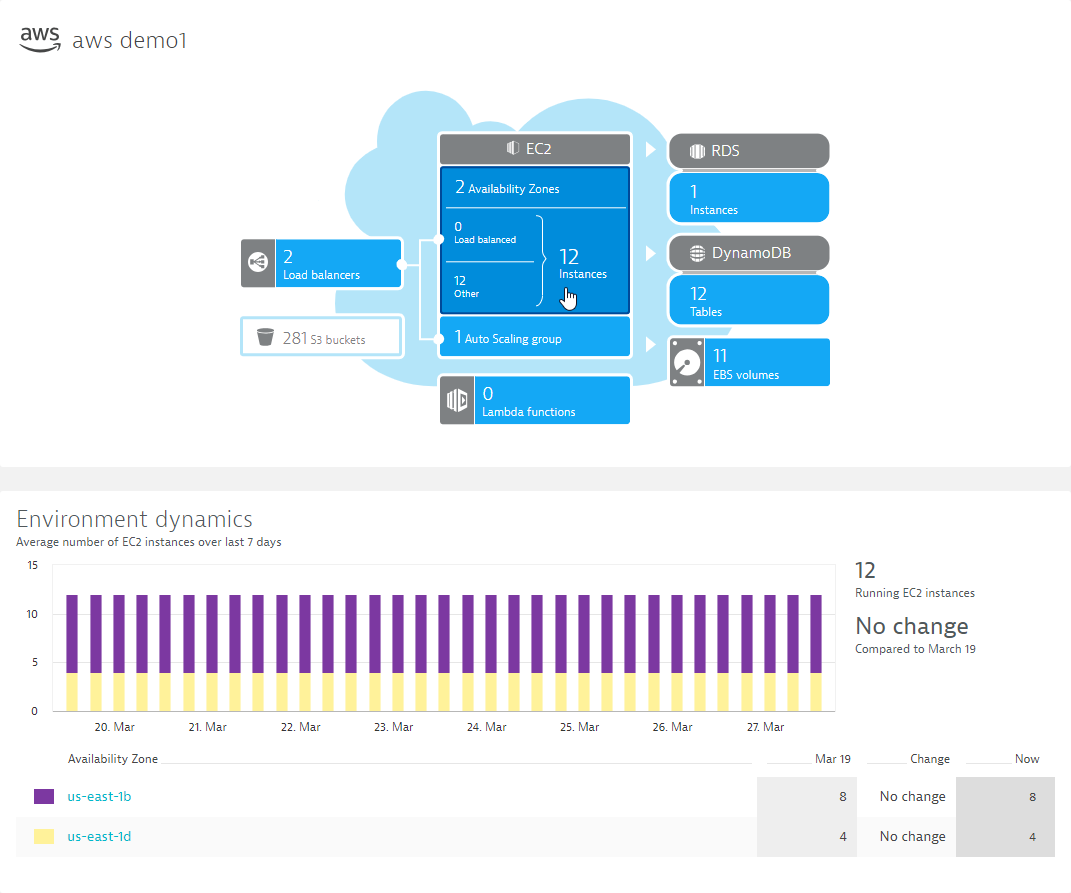
Each AWS account page gives you an overview of the Amazon services running under that account. On this page you see:
- Dynamics of your environment. The Environment dynamics section shows you daily totals of EC2 instances segmented by Availability Zone. We present a 7 day overview with special attention paid to increases and decreases in total instance numbers.
- List of Elastic Load Balancers (ELB) and their backend EC2 instances.
- List of monitored Supporting services integrating CloudWatch metrics into DESK monitoring.
- List of load balancers in your environment.
- List of Amazon Relational Database Services (RDS) instances
- Number of S3 buckets.
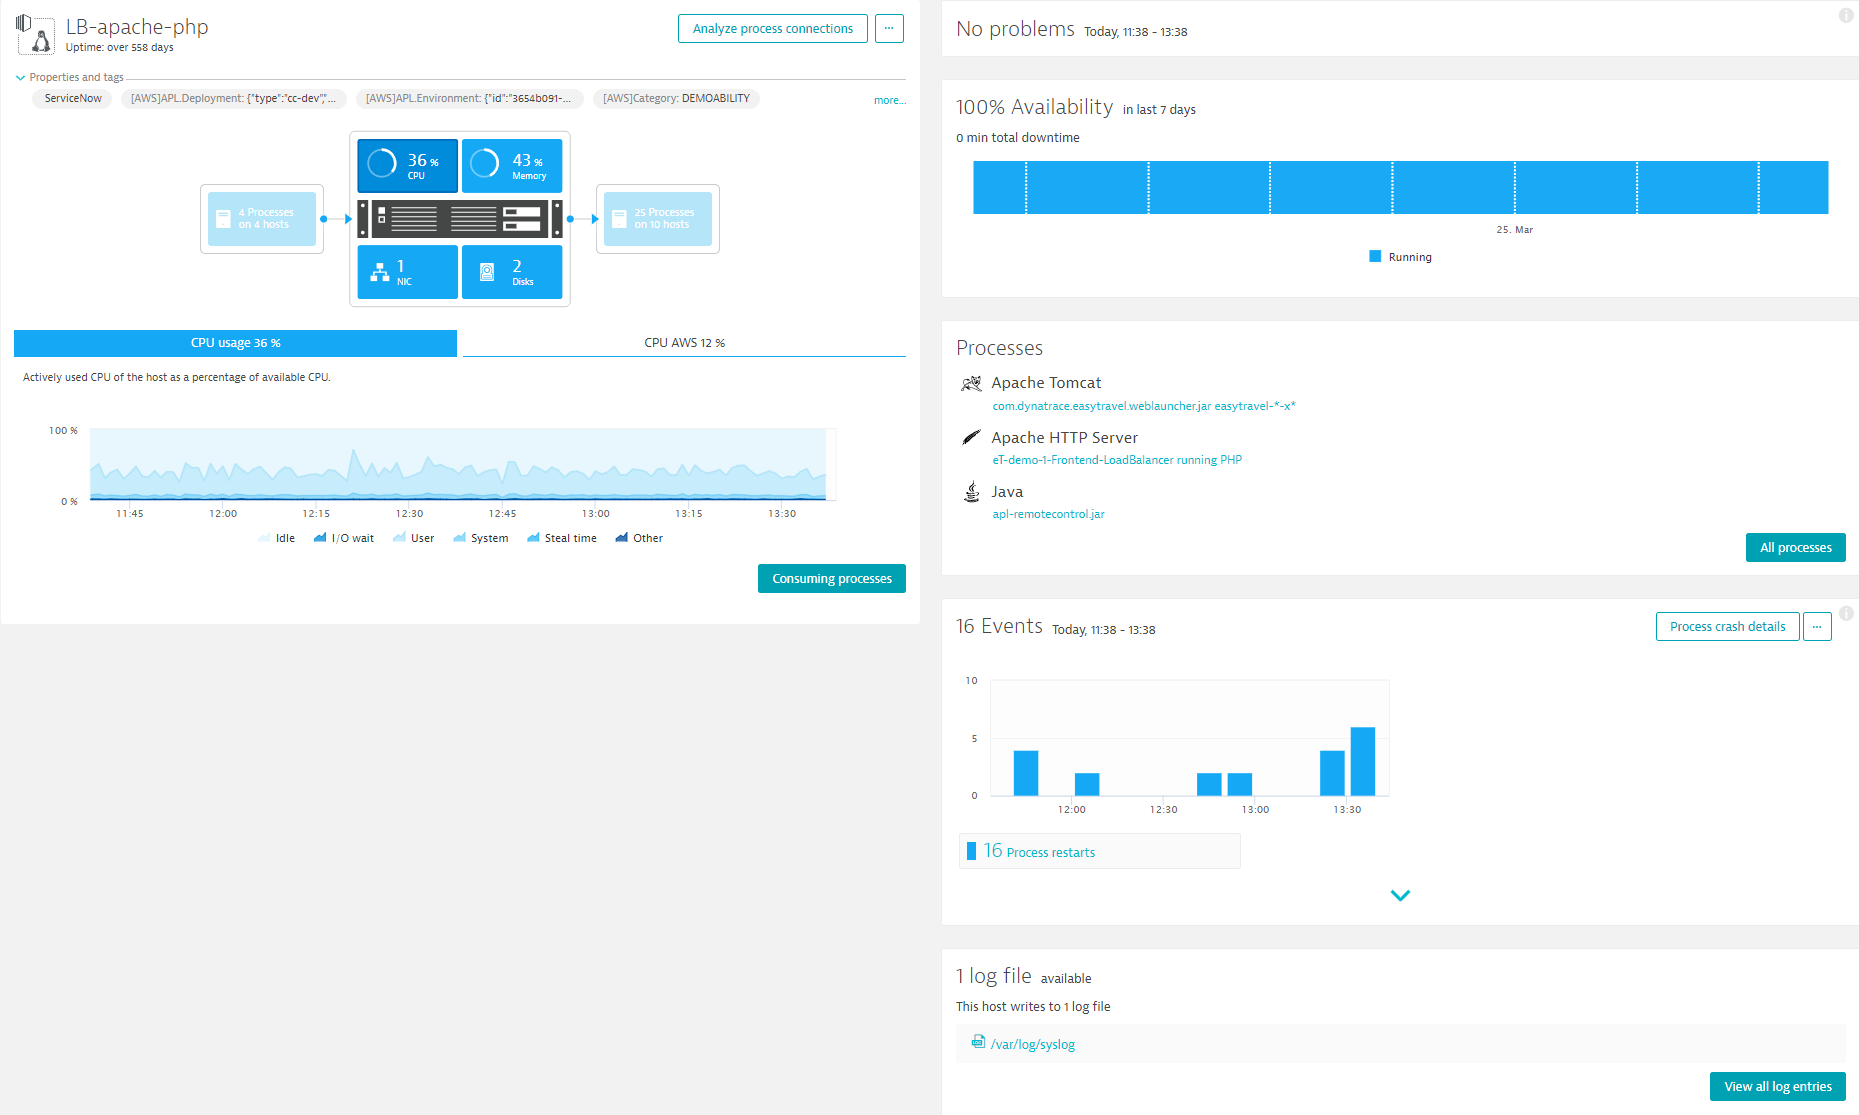
Host page
When we discover a monitored host running in Amazon cloud, we include an icon in the upper-left corner to indicate that the machine is cloud-based.
Each Host page details the health of the hardware resources that that host relies on. Click one of the four health statistics (CPU, Memory, Disk, or NIC) to view details of the metrics that contribute to each measurement.
Click the CPU or Disks infographic links on any EC2 instance Host page to view performance details specific to that EC2 instance.
For disks we offer both Disk latency and EBS latency metrics. When it comes to EBS metrics, DESK discovers how local disks and EBS volumes are mapped together. We also detect striped volumes which helps us better understand the logic of your infrastructure.
For CPU we provide 2 perspectives of CPU usage—AWS perspective (CPU AWS: how much AWS CPU resource the EC2 instance consumes) and operating system perspective (CPU utilization ). The operating system perspective comes from DESK OneAgent, and includes among other things, process breakdown so that you know what the CPU cycles are used for.
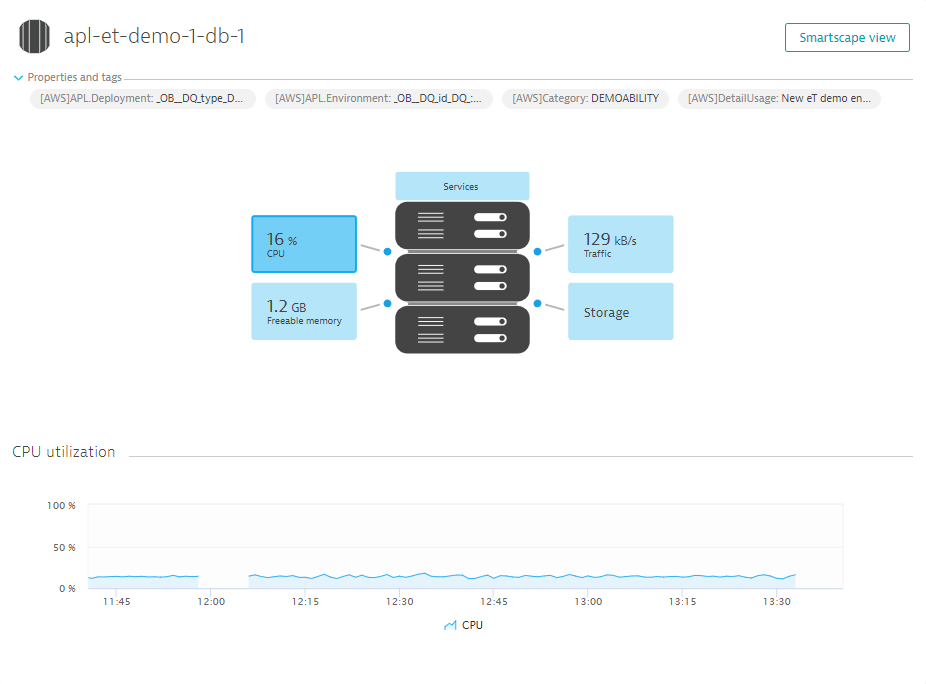
Relational Database Service page
On each Relational Database Service (RDS) page we show you key performance metrics for that RDS instance and its properties, including engine type and version, endpoint, port, and Availability Zone.
For multi-Availability Zone, high availability (HA) deployments (RDS running in primary and standby mode), DESK also shows the secondary Availability Zone. When a service disruption affecting the master zone takes place and your RDS fails over to the secondary Availability Zone, the master Availability Zone is automatically updated, while other properties (for example, endpoint) remain the same.
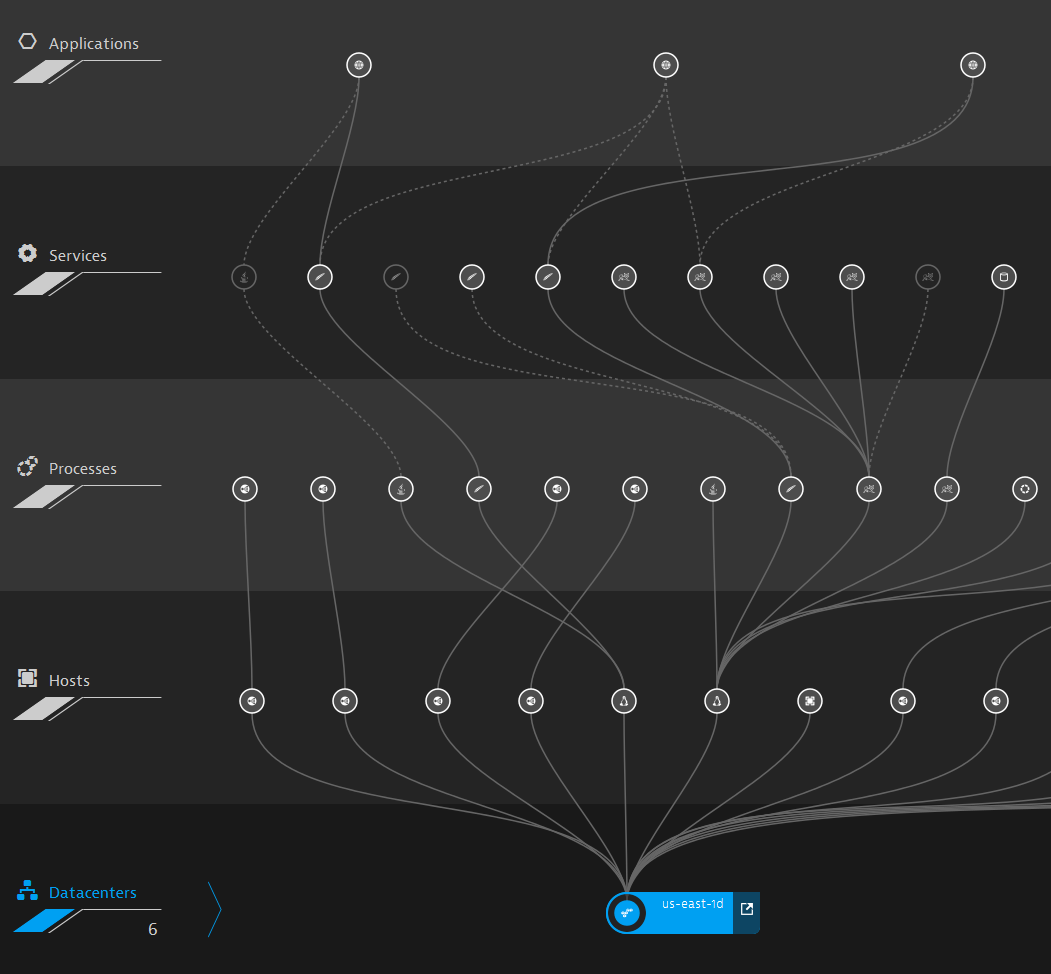
Smartscape
Smartscape shows Availability Zones as data centers. All Amazon services in an Availability Zone belong to the same data center.
To help you understand the relationships within your monitoring environment, we enable you to navigate directly to Smartscape from all EC2 instance (host) pages, RDS instance pages, and ELB pages.
Problems page
When Amazon cloud is identified as the root cause of a problem, or when your cloud-based application suffers from problems, the cloud environment and its performance are factored into our event correlation and root cause analysis.
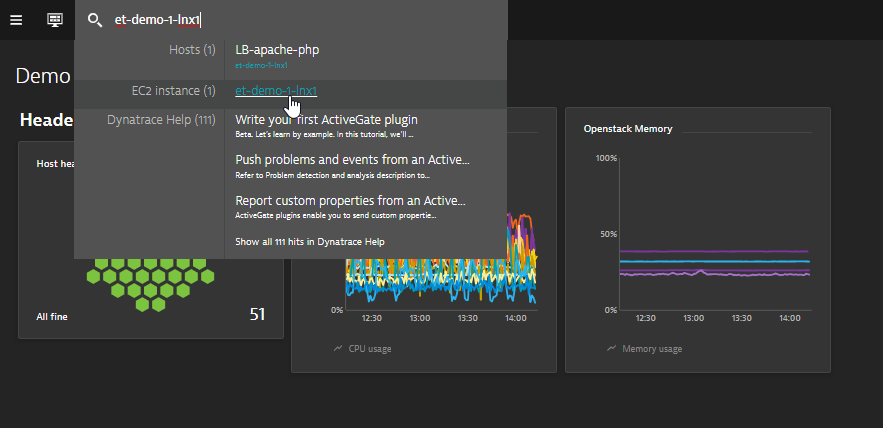
Super search
Any time you need information regarding one of your Amazon services, type the service's name, ID, or other attribute into the search field on the menu bar. You can search based on any of the following attributes:
- EC2 name, instance ID, IP address, public or private host name
- RDS name or endpoint
- EBS volume ID
- ELB name
- Auto Scaling Group name