Apache Cordova
Hybrid mobile apps combine the benefits of native mobile apps, such as phone hardware and deployment via an app store, with the flexibility and platform independence of modern web technologies.
The DESK Cordova plugin allows you to instrument all apps that are built on top of Apache Cordova. This includes apps that use PhoneGap, Ionic, and IBM mobile first. The Cordova plugin makes it easy to monitor what's going on in your native mobile apps using:
- OneAgent for Mobile and
- Real User Monitoring JavaScript tags that monitor the performance of the web-based aspects of your apps.
Set up hybrid mobile app monitoring
-
Select Deploy DESK from the navigation menu.
-
Scroll down and click the Set up mobile monitoring button.
-
Type in a name for your app and click Monitor mobile app.
-
Select the platform of your mobile app (Google Android, Apple iOS, or Cordova).
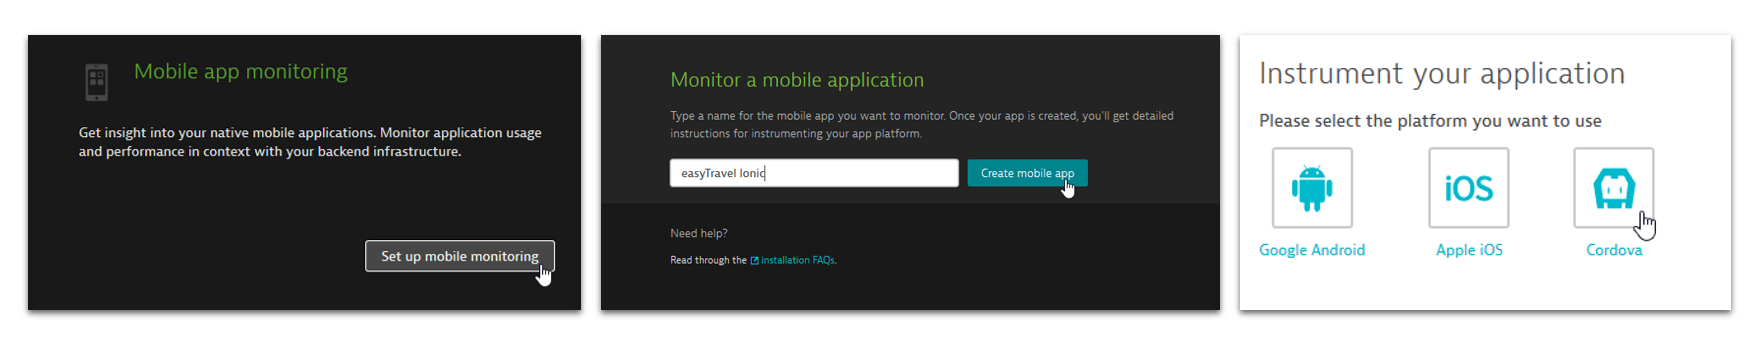
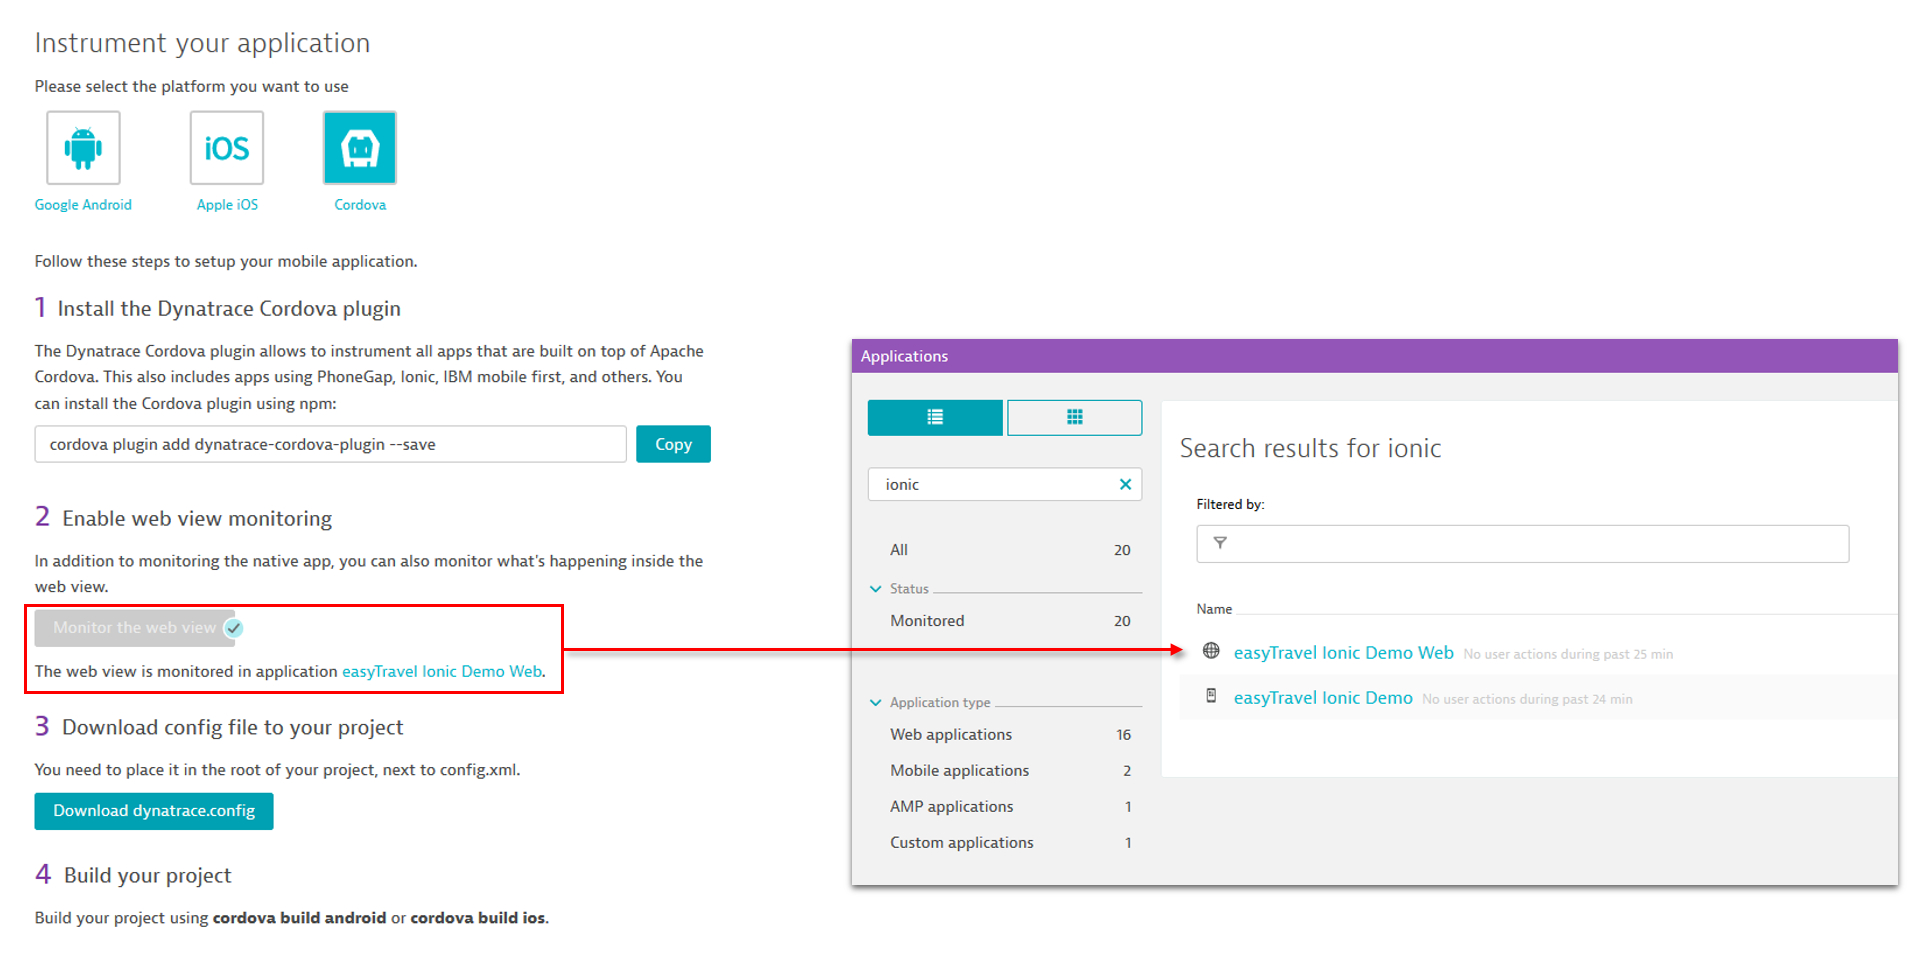
The setup wizard guides you through the set-up process.
-
Install the plugin in your workspace by using Node Package Manager (NPM).
-
Click the Copy button to copy the NPM command to your clipboard, for example
cordova plugin add desk-cordova-plugin --save. The next time you build your Android or iOS app, the Cordova plugin will automatically instrument it using OneAgent for Mobile. This will provide visibility into app starts, crash reports, and device metadata such as model and OS version.
To capture user actions in the web view, DESK uses a JavaScript tag, as is done for all web applications that are set up for agentless DESK monitoring. The Cordova plugin automatically injects the JavaScript tag directly into your HTML sources. When you click the Monitor the web view button, a new web application entry is created in your list of monitored applications. This application entry receives all monitoring data and generates an API token so that the Cordova plugin can retrieve the JavaScript tag from the REST API.
-
Click the Download desk.config button to download the
desk.configfile. Save this file into the root folder of your Cordova app workspace withconfig.xml. -
Rebuild your app.
Start monitoring
-
Launch your app in an emulator or on a test device and click through the use cases to generate some traffic that DESK can monitor. When you're done, close your app to ensure that all data is sent to DESK or OneAgent for Mobile may cache the data for up to 2 minutes.
-
Back in DESK, select Applications from the navigation menu.
-
Select your new hybrid mobile app from the list of applications.
All performance analysis metrics data related to your app is displayed on your hybrid app's overview page. The Hybrid app section displays the overall details of the performance of the web portion of your app.
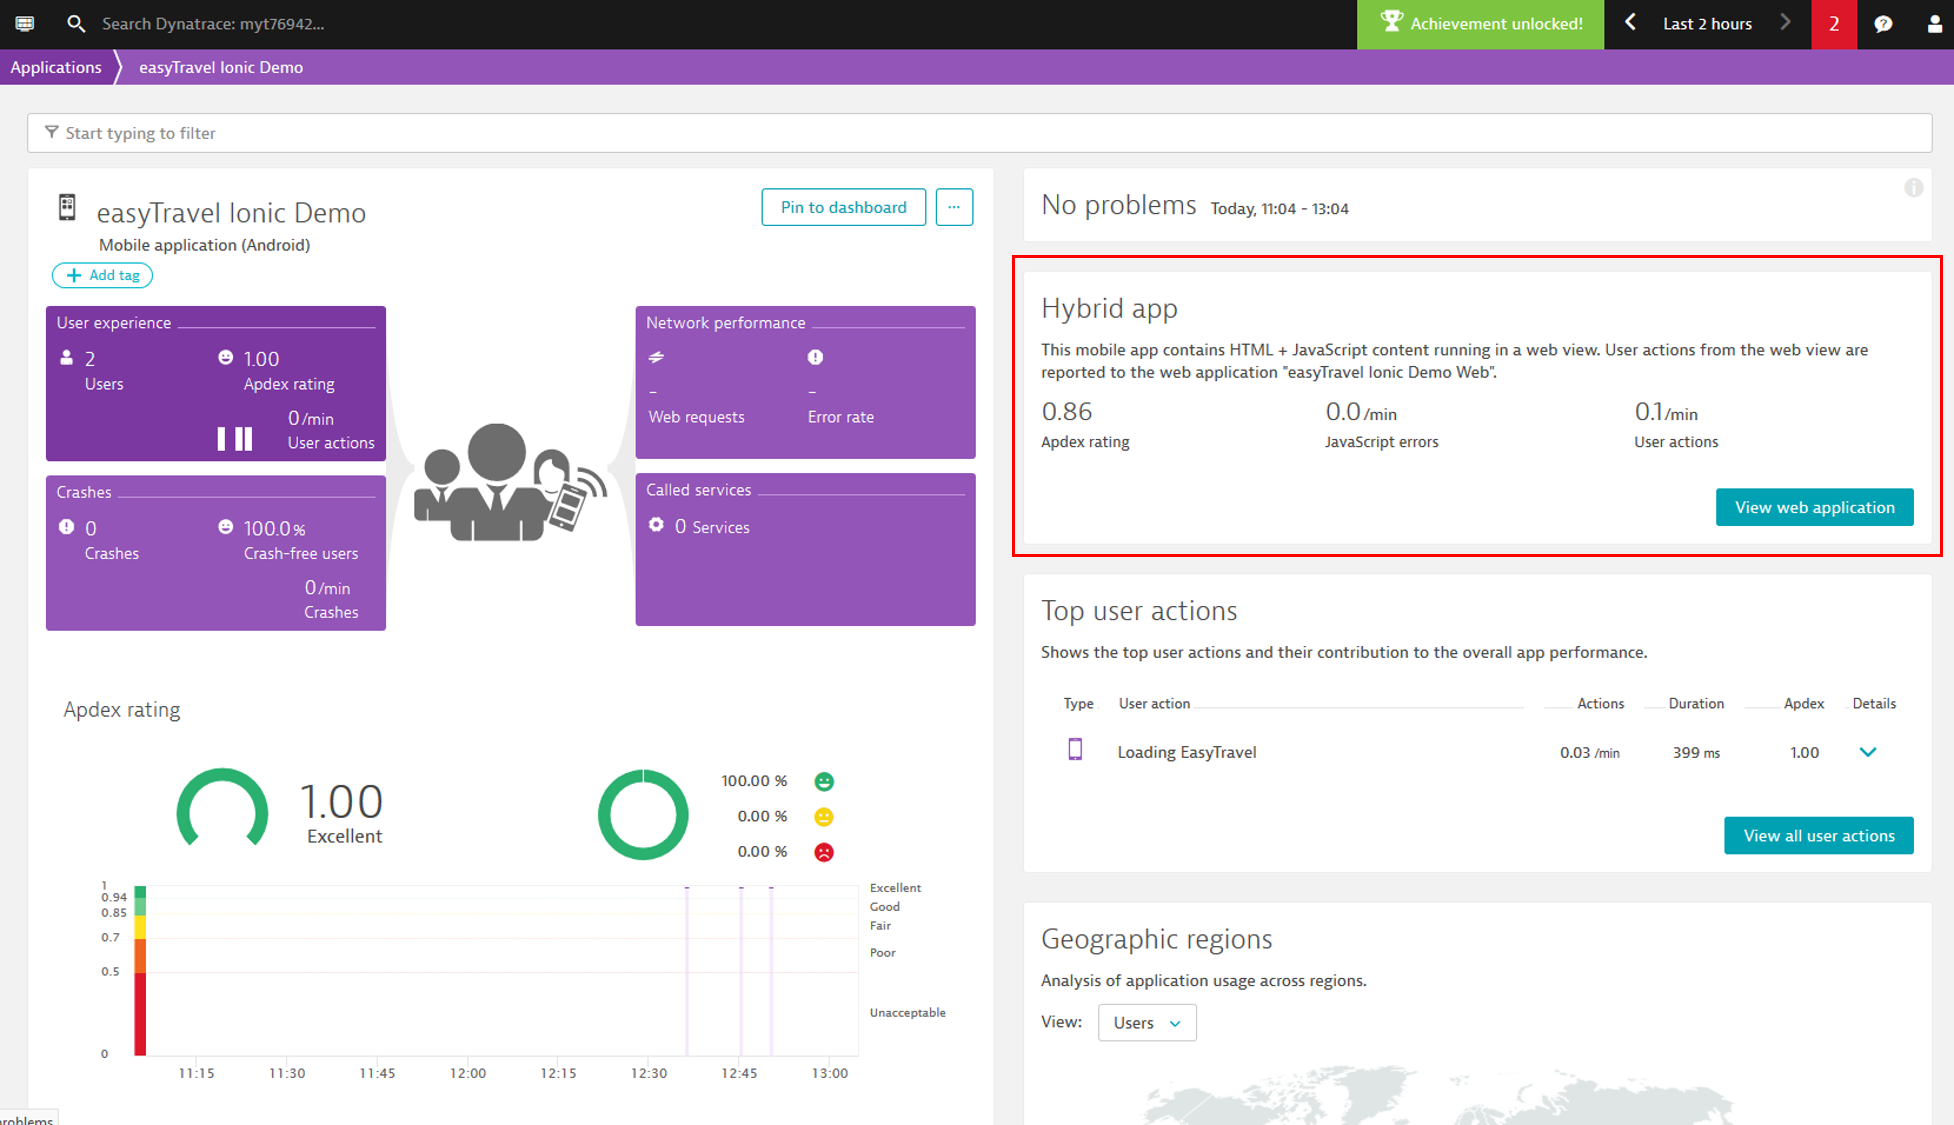
- Click the View web application button to view all performance data that was captured via the injected JavaScript tag.
The web application overview contains all user actions that were captured in the web view, so you'll find a high percentage of your app's user actions listed here.
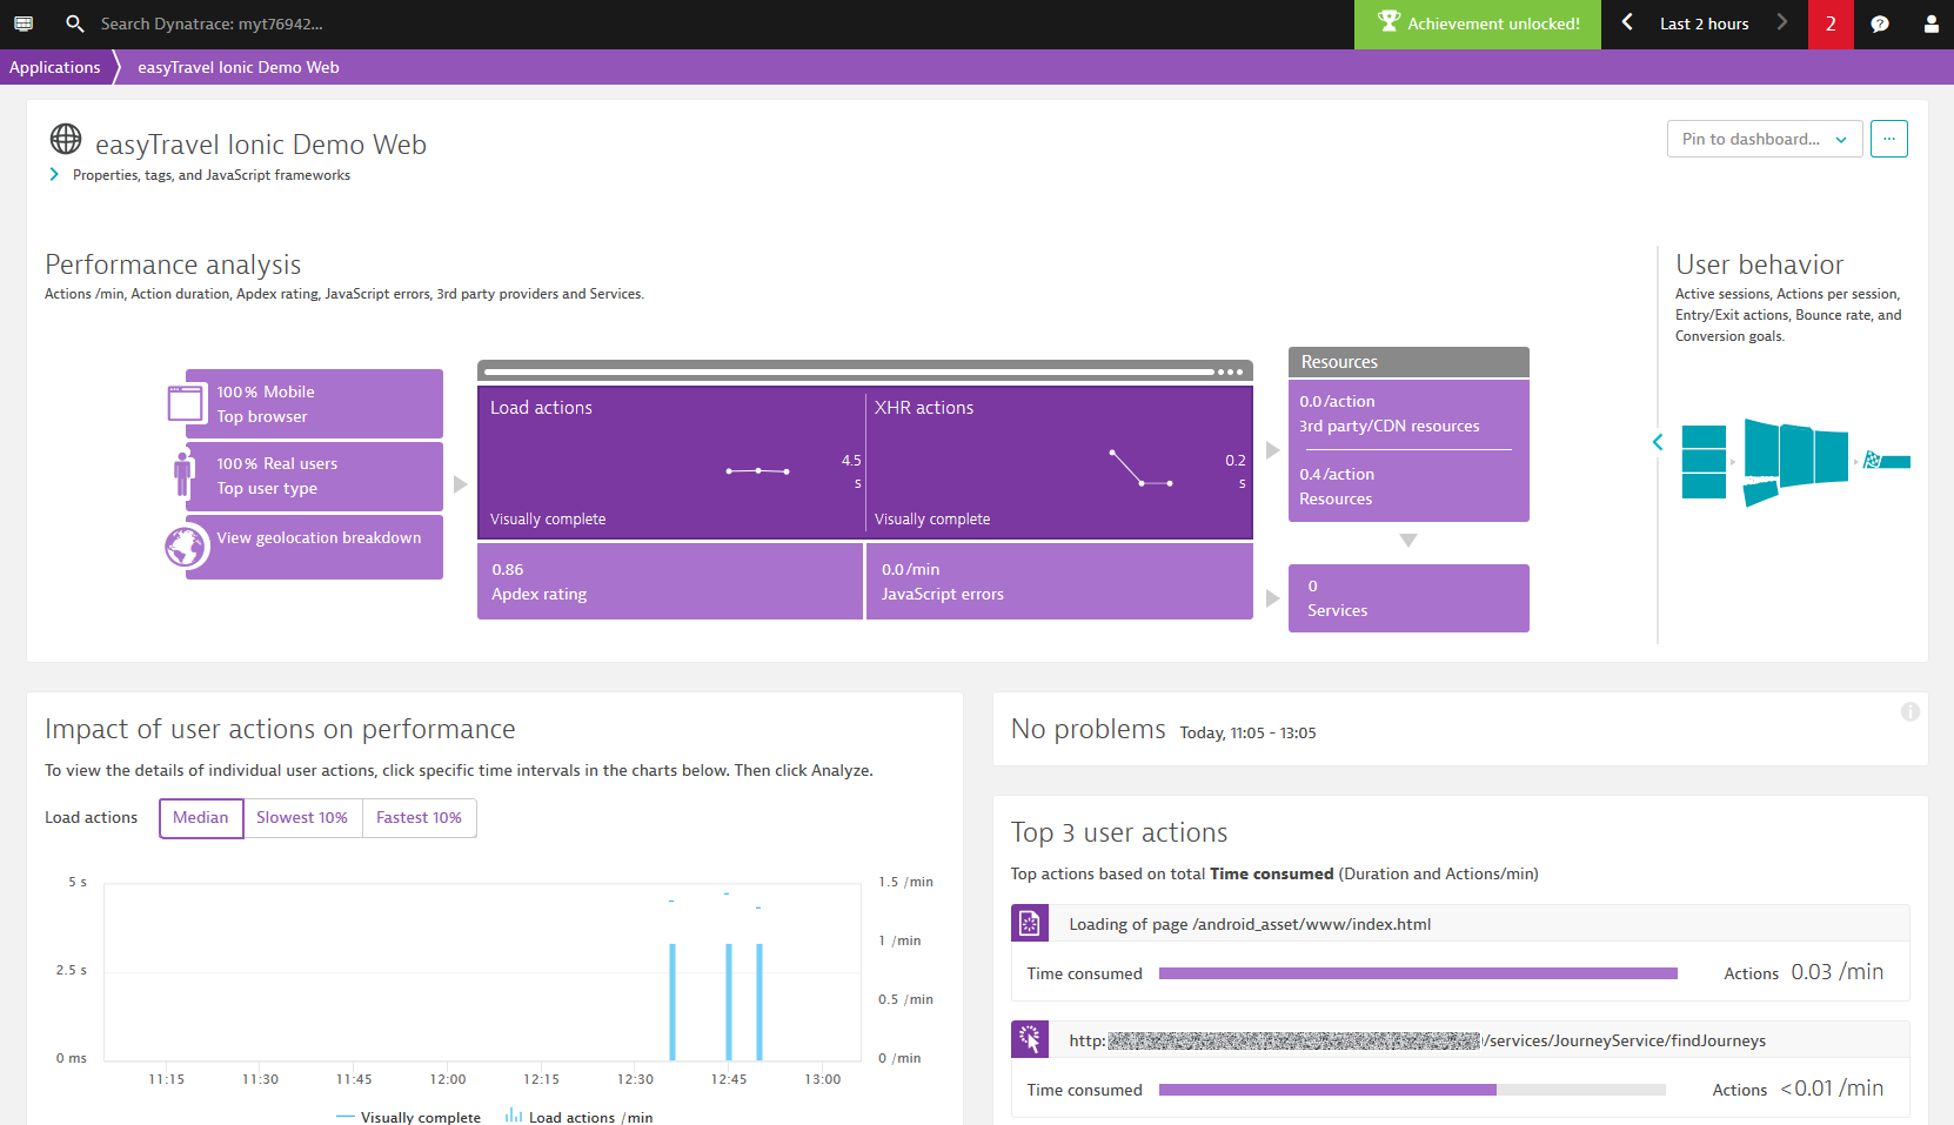
Performance data is split across two application views. However, DESK consolidates all detected user actions from these application views to a single user and a single user session.
-
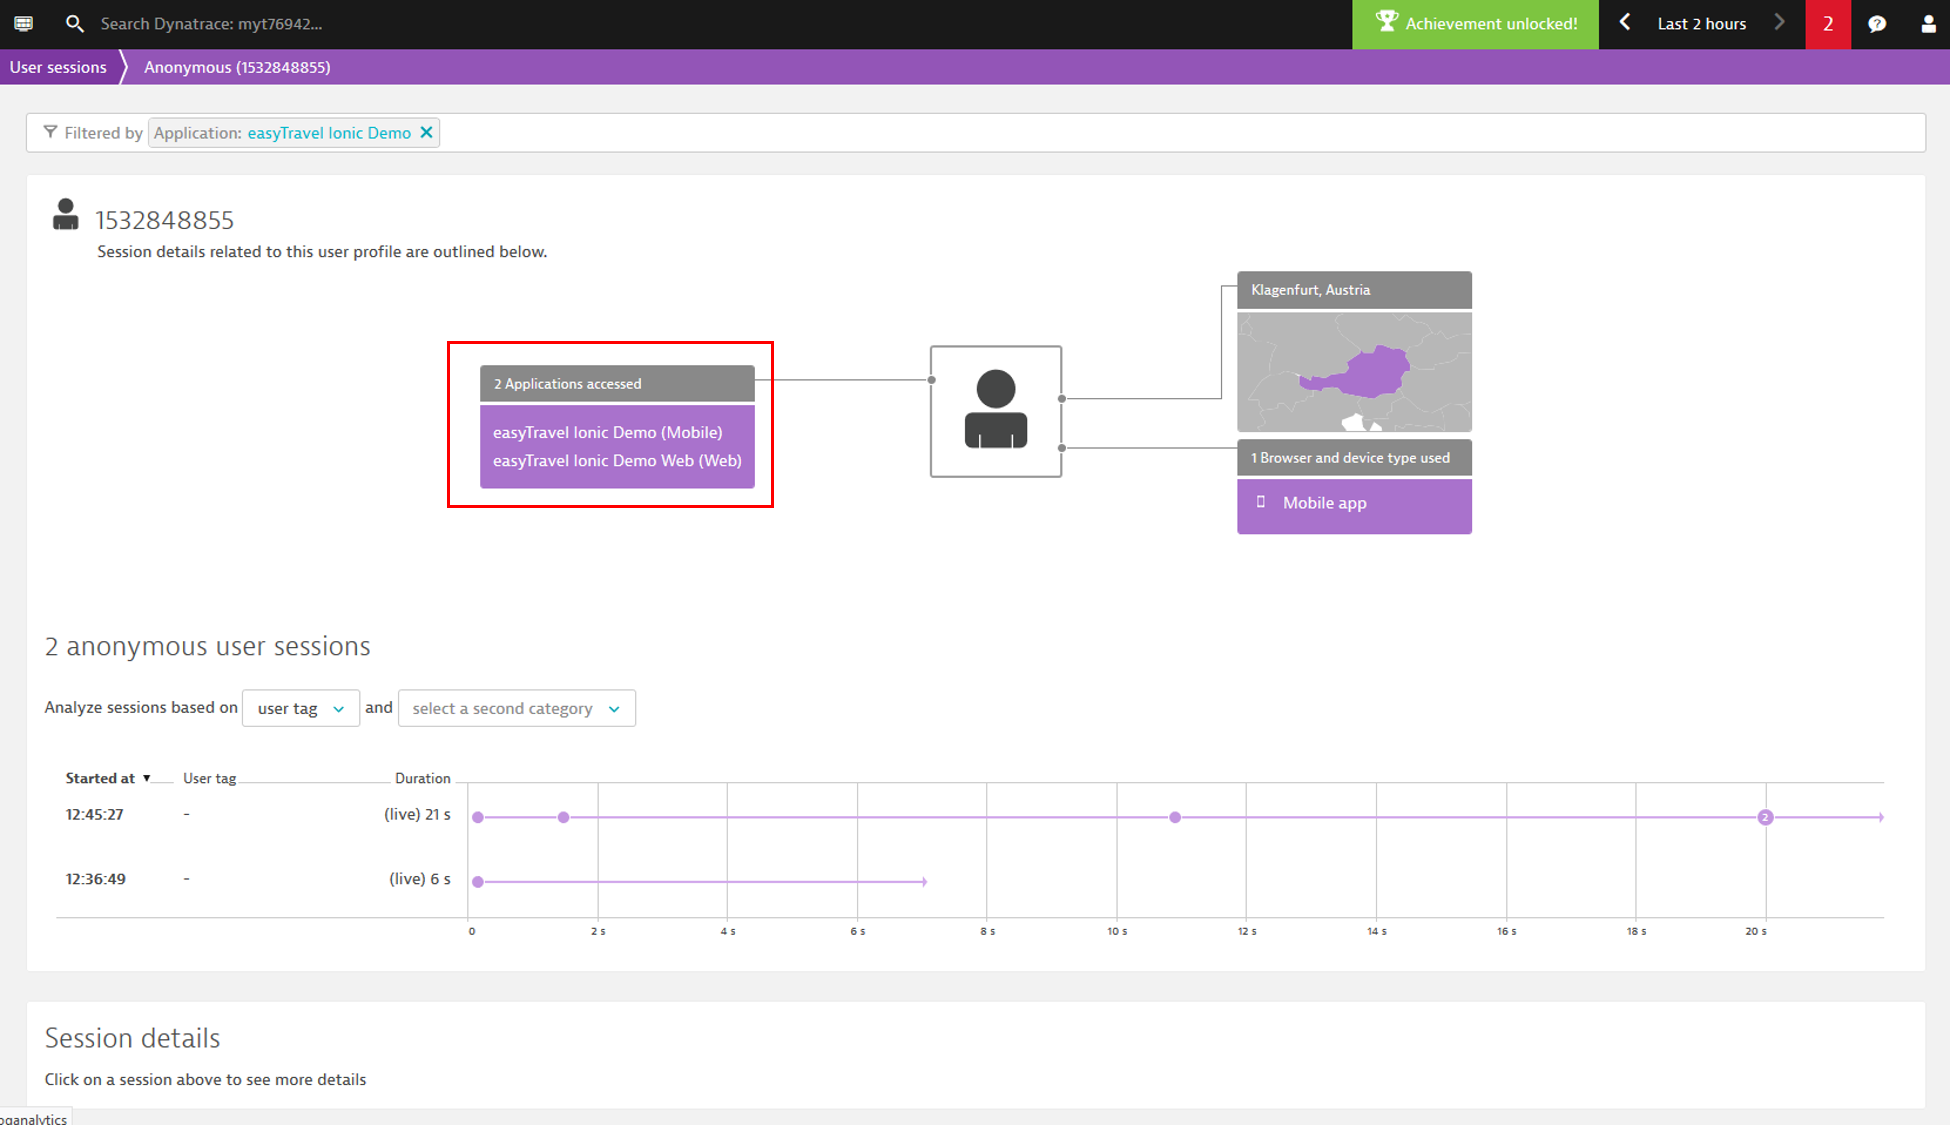
Select User sessions from the navigation menu to access the User sessions view. In the Filtered by field, start typing the name of your hybrid app to focus analysis on your app.
-
Select the default user created for your hybrid app from the Users list at the bottom of the page. Notice that this user has accessed two apps: a Mobile app and a Web app.
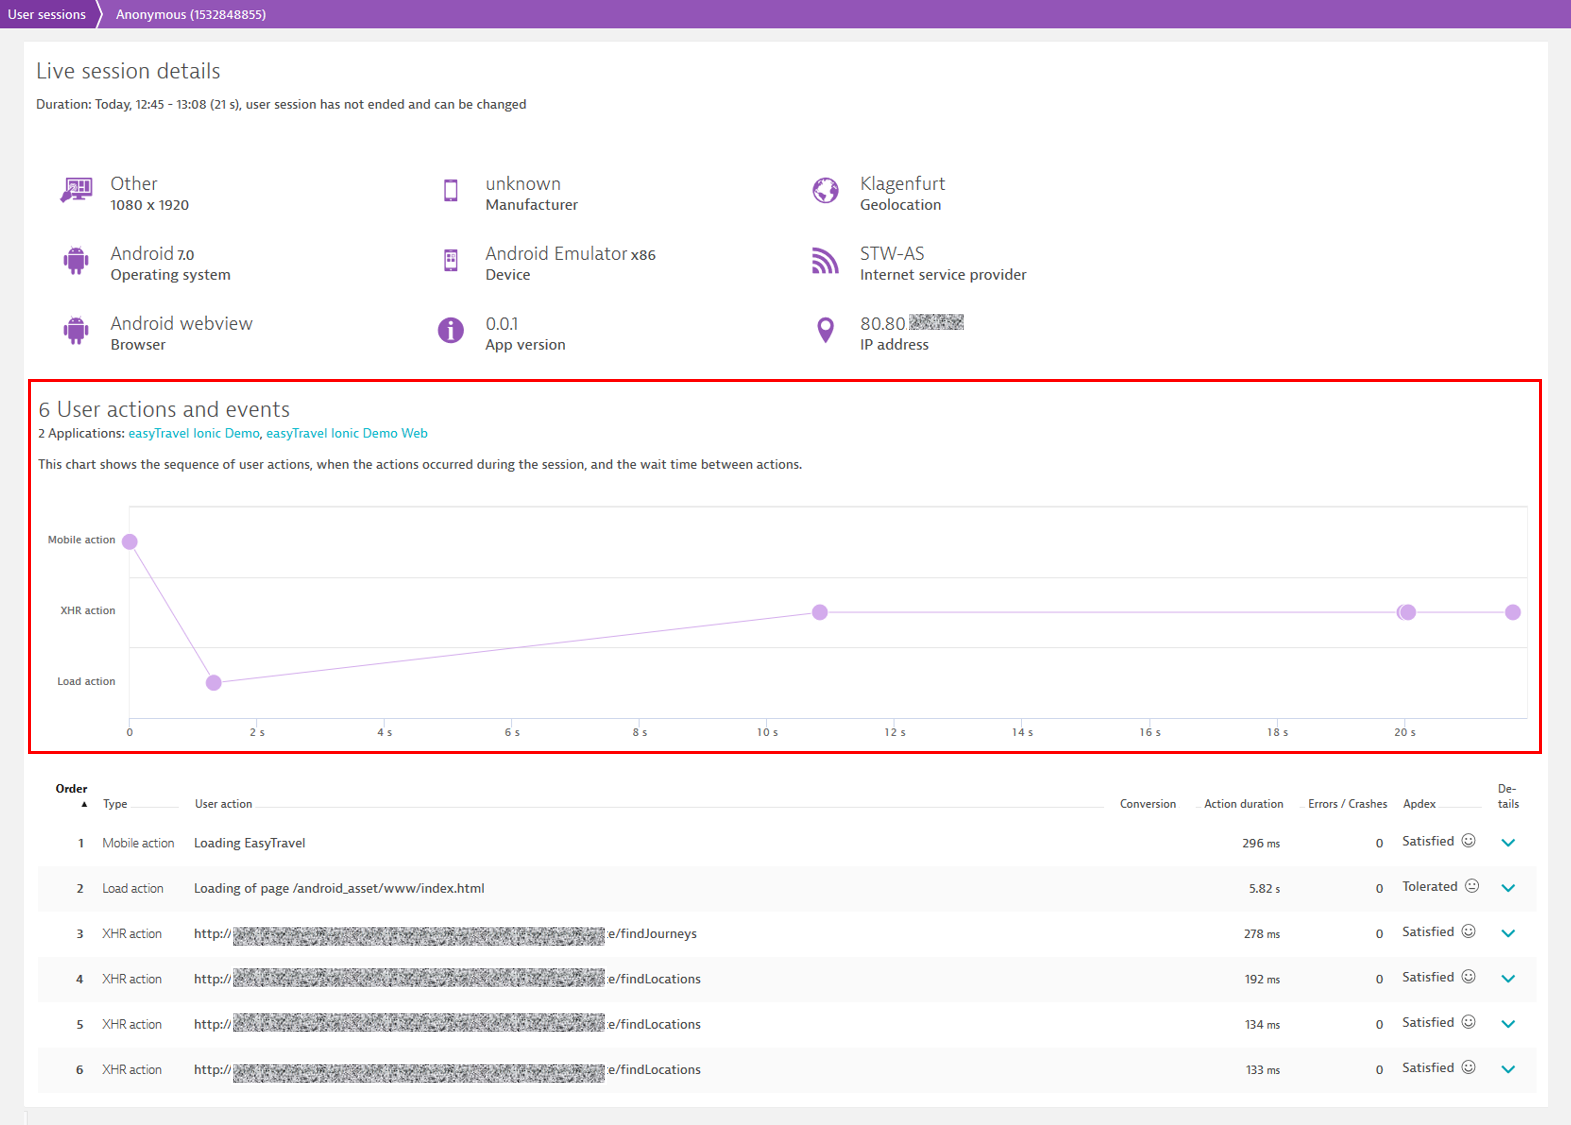
If you select a user session, you'll see that all user actions from the mobile and web sessions have been combined into a single session, along with the metadata that enables DESK to show which user actions were captured by OneAgent for Mobile and which were captured by the JavaScript tag. The following chart shows the sequence of user actions, when they occurred during a user session, and the wait time between the actions.
From here, you can continue with your user-experience analysis. You can add additional filters to focus on the sessions you want to take a closer look at, or you can drill down to the user action waterfalls of your app's web and mobile sessions.