Monitor Docker containers
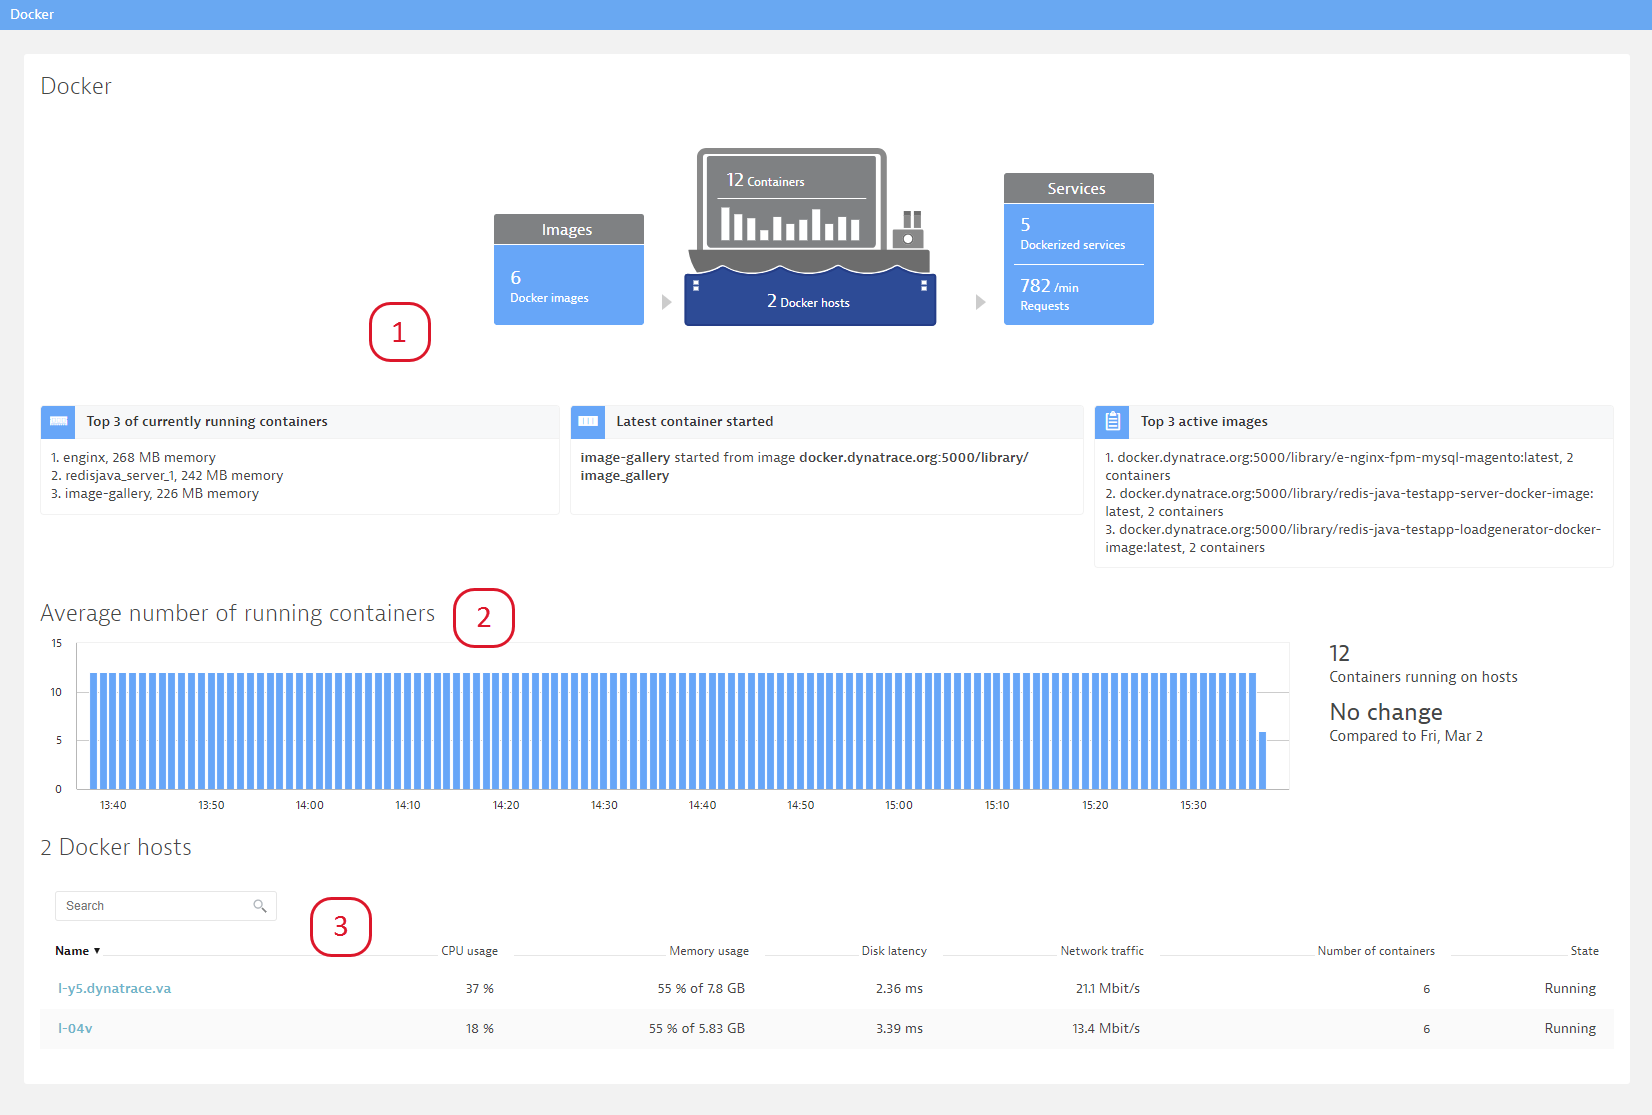
The Docker overview page that can be accessed directly from the navigation menu provides a summary of the most relevant information:
- The infographic at the top of the page displays the following:
- Number of running containers
- Top 3 containers consuming the most memory
- Most recently started container
- Most frequently used images
- The Average number of running containers section of the page provides deep insights into the dynamics of your Dockerized environment by showing you how the number of containers has evolved over the past 7 days.
- The Docker hosts section at the bottom of the page shows resource usage of individual Docker hosts. This information helps you make decisions about capacity planning and container provisioning.
Monitor Docker containers
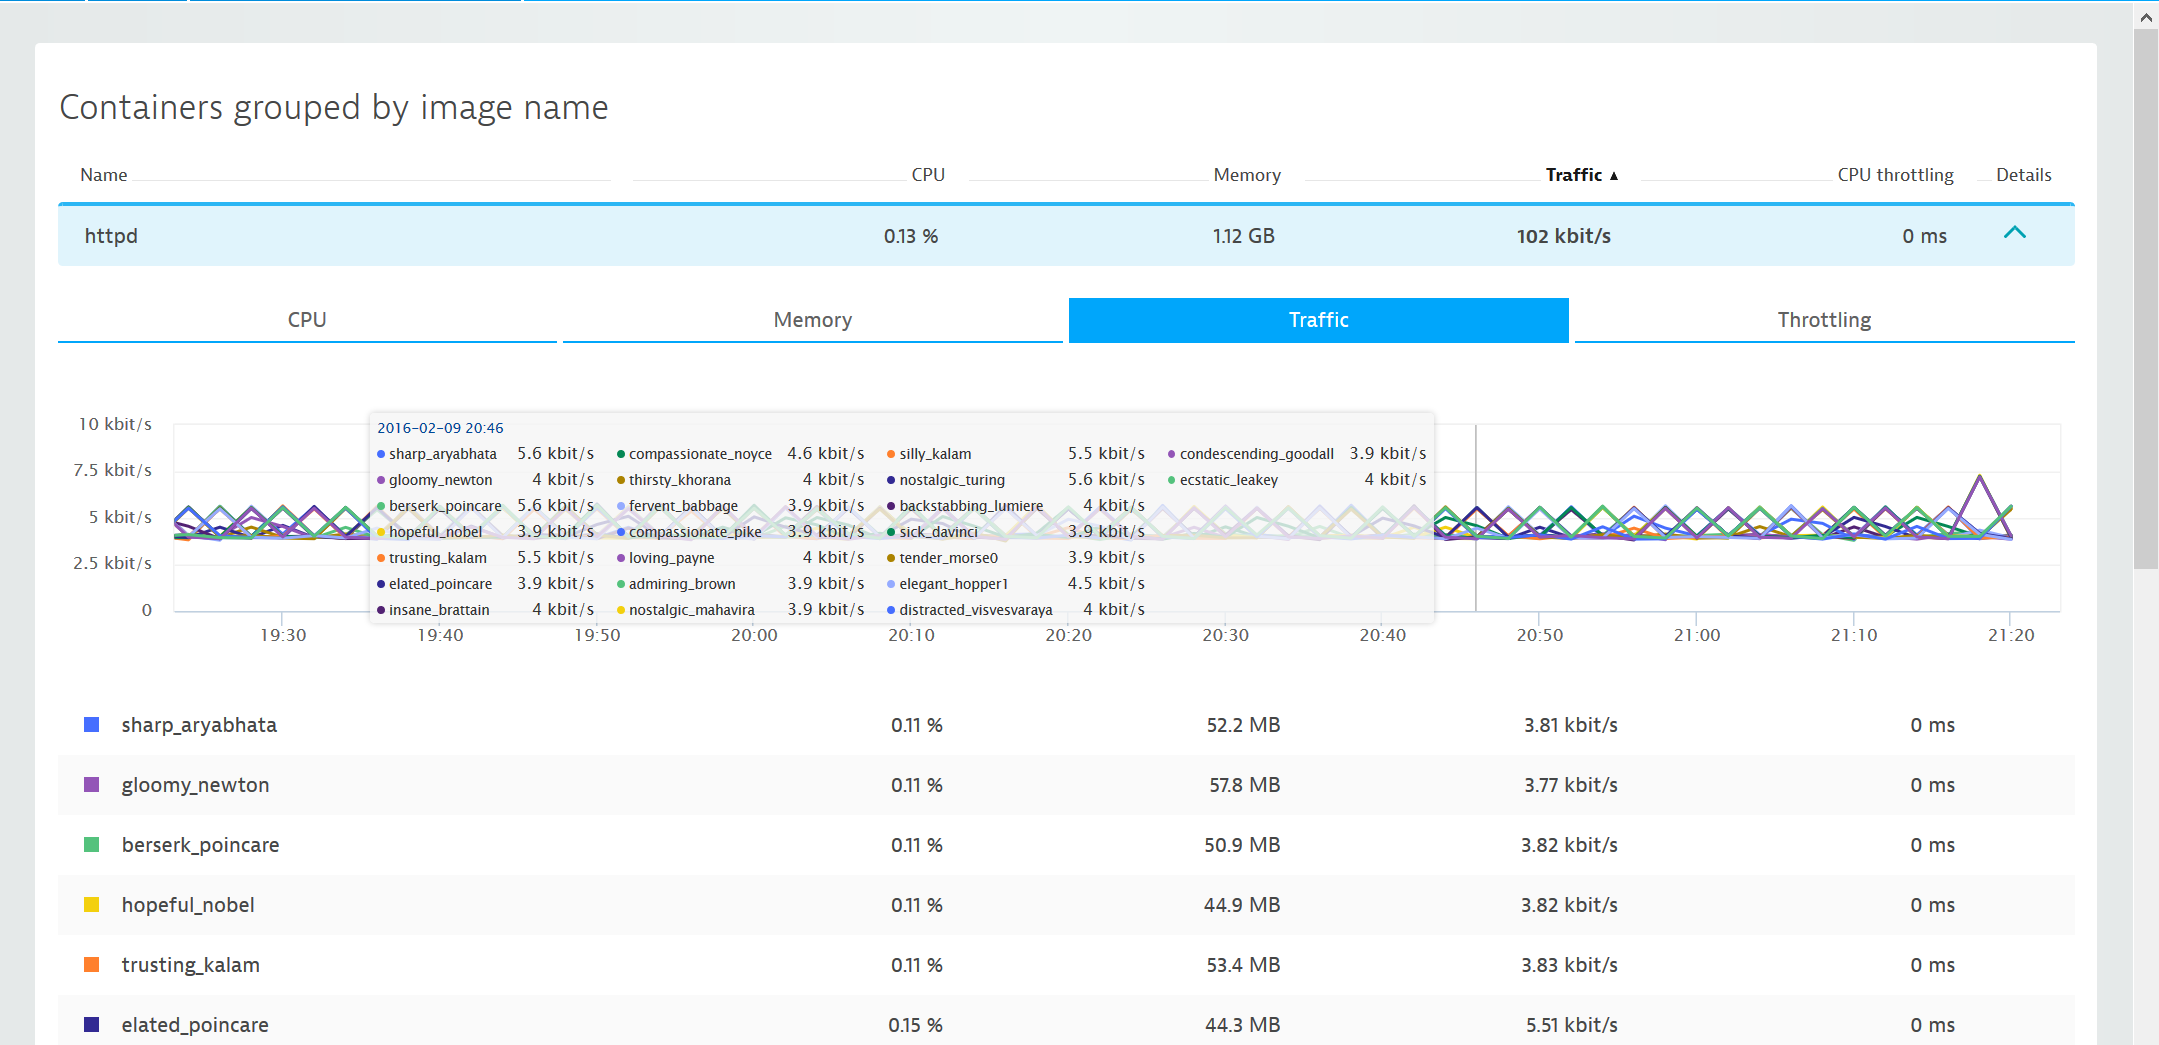
To explore container resource usage, click a host in the Docker host list and then click the View containers button. This is information you could otherwise only get by executing a docker stats command.
On the Containers grouped by image name page you’ll see all containers of the same image running on the same host that are consuming the most resources.
Provided metrics include:
- CPU: CPU user divided by CPU system, expressed as a percentage.
- Memory: Resident Set Size (RSS) and cache memory. RSS reflects data belonging to processes, while cache memory represents the data stored on disk that is currently cached in memory.
- Traffic: Both incoming and outgoing network traffic
- Throttling: Total time that a container’s CPU usage was throttled
Monitor Docker images
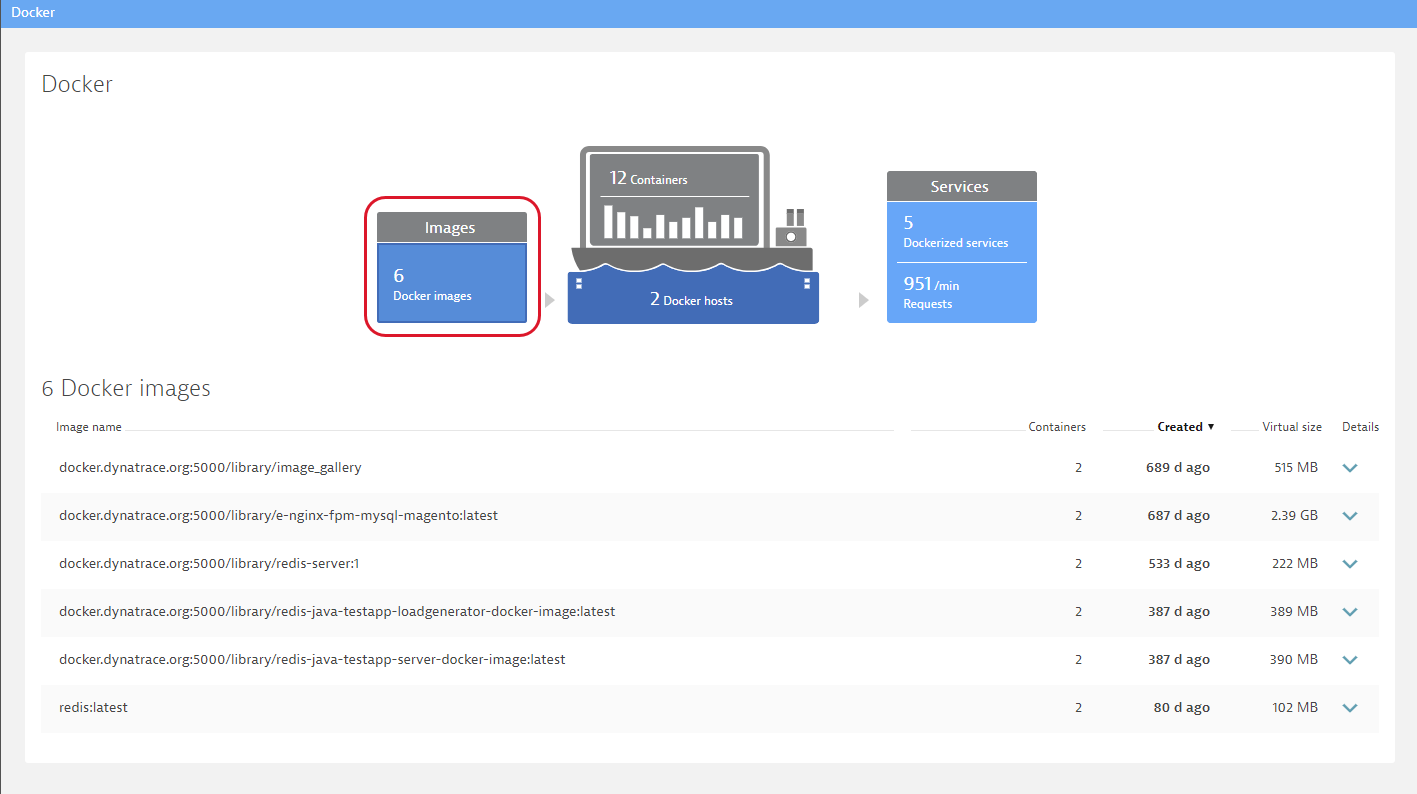
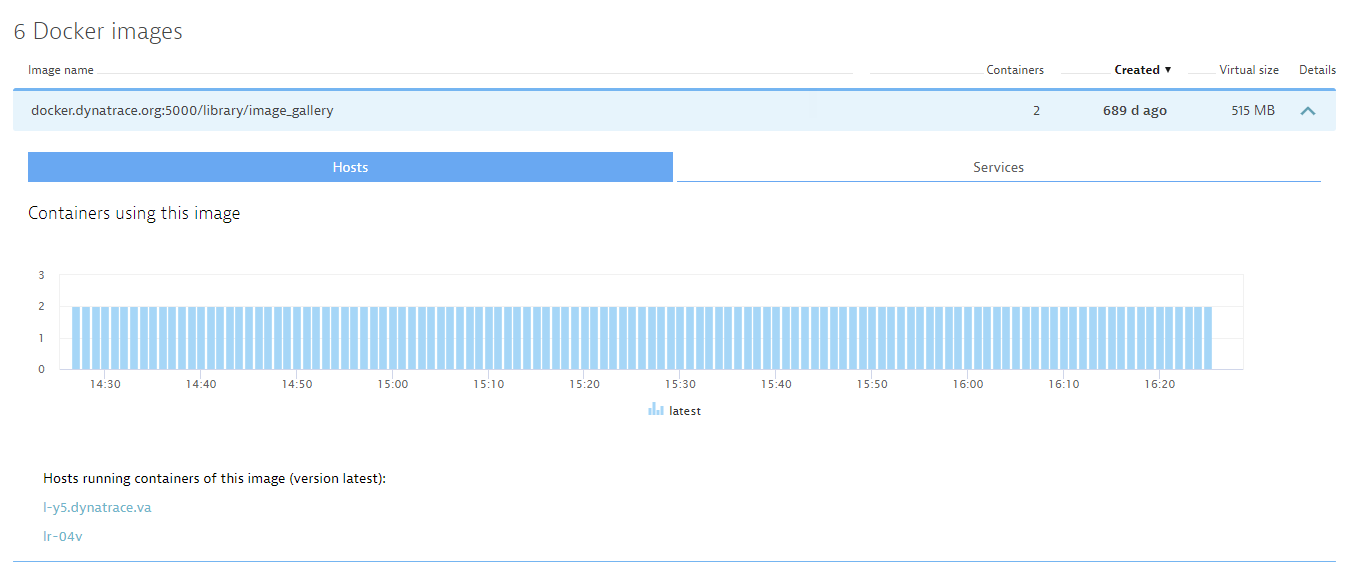
In large environments it can be a challenge to keep up with image versions deployed across hosts and to track the containers of a certain image version. The Docker images page makes it easy to identify hosts running containers of a specific image version. Here you can learn details such as when an image was created and its virtual size (cumulative space taken up by an image).
Monitor Dockerized services
Another valuable perspective is the Dockerized services page. Here you can view all Dockerized services in a list that includes insights into the load and response time of each service. You can correlate these metrics with the number of containers used to provide each service.
Running Docker on AWS Beanstalk?
Have a look at our guidelines for configuring monitoring for Linux.
Limitations
There are performance limitations related to the number of running containers. The total number of containers that can be monitored in parallel isn't strictly defined though; this depends on the type of monitored applications and host resources.
-
Docker containers on Linux can run in any of the following network modes: Host, Bridge, Container, Overlay, None, Macvlan. The default network mode is Bridge. From the available network modes, OneAgent is capable of reporting topology for containers running in network modes: Host, Bridge, and Container. Topology for other network modes isn't reported. OneAgent is however able to detect and report other network modes (with the exception of Macvlan).
-
Docker topology isn't reported when using cloud-infrastructure monitoring mode on Linux.
-
Non-standard Docker binary file locations aren't supported on Linux.
-
Container monitoring isn't supported when OneAgent is deployed on Linux in non-privileged mode (in absence of ambient capabilities and with the
DISABLE_ROOT_FALLBACKflag enabled). -
Only UNIX sockets and unencrypted TCP connections are supported when accessing the Docker API. Encrypted TLS connections aren't supported at this time. Ensure that your Daemon Socket Options don't include the
--tlsverifyparameter.
OneAgent 1.145 or later
-
For containers deployed on hosts running the Windows operating system, we support only Windows Server Containers. Hyper-V containers aren't supported.
-
Docker service needs to be restarted for OneAgent to be able to properly monitor the containers on Windows.
The restart is required only during the initial OneAgent installation, it is not required with subsequent OneAgent updates.
-
Containers inside Windows Server Container can run in one of the following network modes: NAT, Transparent, Overlay, L2Bridge, L2Tunnel. The default network mode is NAT.
From the available network modes, OneAgent is capable of reporting topology for containers that run in NAT network mode. OneAgent is able to detect and report other network modes, but does not report their topologies.
-
For containers deployed on Windows, the network module of OneAgent needs to be running for OneAgent to properly report topology.
-
OneAgent isn't able to report on an inter-docker connection if the containers use only the internal container's addresses (if the connection doesn't go through NAT vNIC).
-
Network statistics are reported for the main process detected inside containers hosted on Windows. This may lead to measurement inaccuracies when there are more processes performing network operations inside a monitored container.
-
We support the default storage and Docker API endpoint locations.
-
The monitoring of Windows Containers is only possible if OneAgent was installed directly on Windows. We currently do not support installing OneAgent through a container on Windows machines.
-
We assume there is one application per container. For containers with more than one application running inside (for example, Apache and MySQL in one container), we report the same listen ports for both applications (process groups). Network traffic either is assigned to one of the process groups or it is divided between the process groups.