PostgreSQL
DESK PostgreSQL monitoring provides you with deep visibility into the performance of your PostgreSQL databases.
Prerequisites
- See list of supported PostgreSQL versions
Viewing PostgreSQL monitoring metrics
Captured PostgreSQL metrics are displayed on each PostgreSQL Process page. Click the infographic or the PostgreSQL metrics and Further details tabs to view metric details.
Collected metrics
| Active connections | Number of active connections to all databases running under PostgreSQL |
| Buffer hit | Number of times disk blocks were found in buffer cache so that a read was not necessary (only includes hits in the PostgreSQL buffer cache, not the OS file system cache) |
| Cache hits ratio | Percentage of accesses that result in cache hits |
| Block reads | Number of disk blocks read in the database per second |
| Rows returned by index scans | Number of live rows fetched by index scans |
| Rows updated | Number of rows updated by queries in the database per second |
| Rows inserted | Number of rows inserted by queries in the database per second |
| Rows deleted | Number of rows deleted by queries in the database per second |
| Rows returned by sequential scans | Number of sequential scans fetched on the table per second |
| Index scans | Number of index scans initiated on the table per second |
| Commits | Number of transactions committed to the database per second |
| Rollbacks | Number of rolled-back transactions in the database per second |
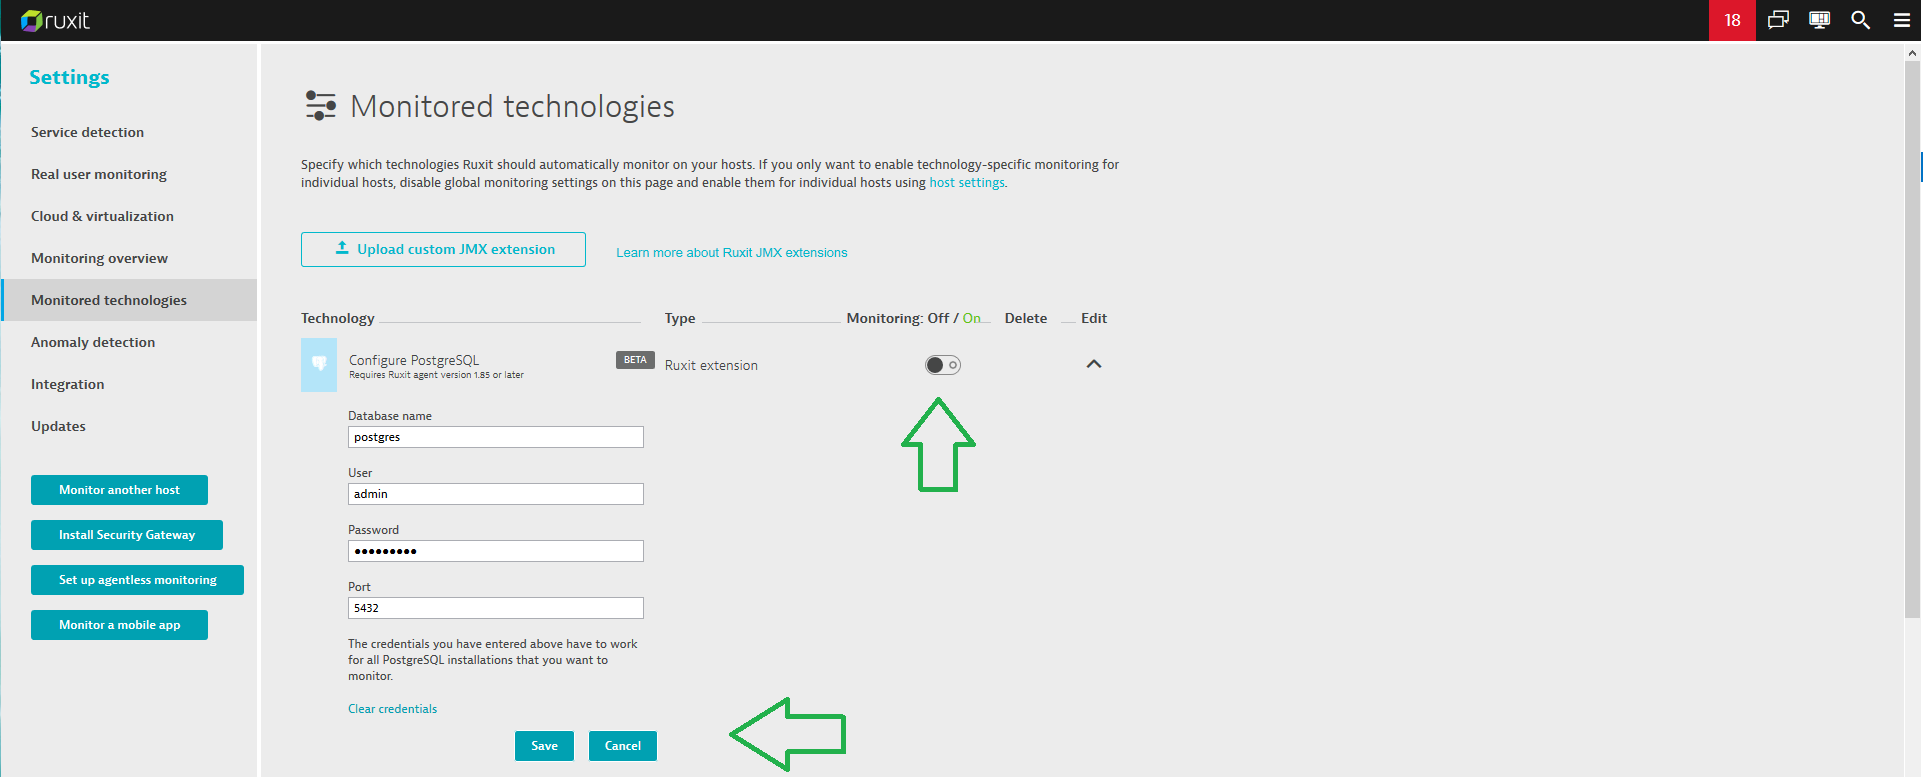
Enabling PostgreSQL monitoring
To enable PostgreSQL monitoring globally:
- In the navigation menu, select Settings.
- Select Monitoring > Monitored technologies.
- Find PostgreSQL and enter your PostgreSQL server Database name, User, and Password credentials.
No special privileges are required, just user “Can login” privileges. - Set the PostgreSQL switch to the On position to enable monitoring with the plugin.
- Click Save.
DESK will verify the credentials and begin collecting PostgreSQL metrics.
Note: With PostgreSQL monitoring enabled globally, when a new host running PostgreSQL is detected in your environment, DESK automatically collects PostgreSQL metrics, assuming that the same credentials are used by the PostgreSQL server or a new DB.
DESK also allows you to enable PostgreSQL monitoring for specific hosts rather than globally. To do this, first disable the global PostgreSQL monitoring setting explained above. Then click the Host settings link and select a host you want to start PostgreSQL monitoring on. Follow the same steps as for global configuration.