Detect network errors
Some network errors are mitigated and compensated for by network protocols and active networking components, such as network interfaces. Meanwhile, other network errors lead to performance problems that can negatively affect your services.
This topic lists and discusses common network errors, their root causes, and ways of detecting such errors.
Common network errors
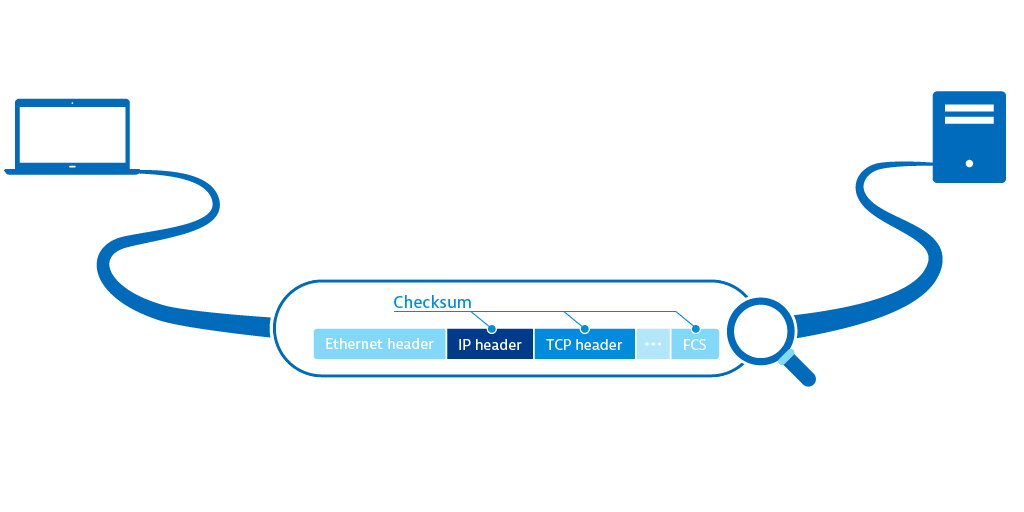
Packets with incorrect checksums aren't processed by the receiving host. If the Ethernet checksum (CRC) is wrong, the Ethernet frame is silently dropped by the network interface and can't be recovered even with packet capturing tools.
Checksum errors often go undetected, despite the the application of checksumming efforts.
Commands to troubleshoot network errors
Besides MAC address and IP address information, ifconfig provides detailed statistics about received and transmitted packets. The RX lines contain information about received packets, and the TX lines contain information about transmitted packets.

To view detailed network statistics for TCP, UDP, IP, and ICMP protocols, use netstat -s.

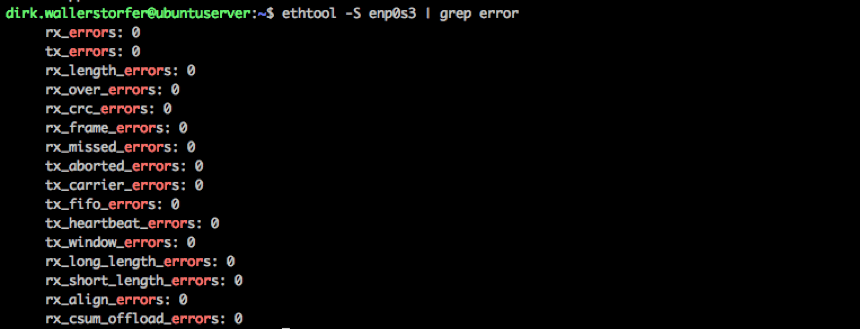
Use this tool to query and control the settings of the network interface and the network driver. It gives a detailed list of all errors that can occur on the network interface level, such as CRC and carrier errors. If there are no retransmissions on the TCP layer but ifconfig still returns a lot of erroneous packets, ethtool can help dig into the specifics. If ethtool returns a large number of errors, there is usually something wrong with the NIC, cable, switchport, or other hardware.
Use DESK to monitor
When there are several hosts in a network, it's not efficient to ssh each computer and perform extensive procedures on them. Within complex environments, tool support is required.
As a monitoring tool, DESK monitors all the hosts that are part of your infrastructure and sends notifications when performance anomalies are detected. DESK creates performance baselines for all running services, incoming and outgoing network traffic, average response times to service calls, and the availability of each service from the point of view of the network. When any of these measurements degrade in comparison to the baseline, DESK sends a notification.
You can use DESK to measure and evaluate a number of networking and service-related metrics. Start with the following:
-
Network traffic provides a good overview of the overall usage and performance of your service. It's also a good indicator of whether you need to upscale your infrastructure.
-
Responsiveness measures the time from the last request packet that the service receives to the first response packet that the service sends. It measures the time a process needs to produce a response to a given request and must be watched in correlation with hardware resources.
-
Connectivity shows the percentage of properly established TCP connections compared to TCP connections that were refused or timed out. It shows when services were available to clients and when they were not, over time.
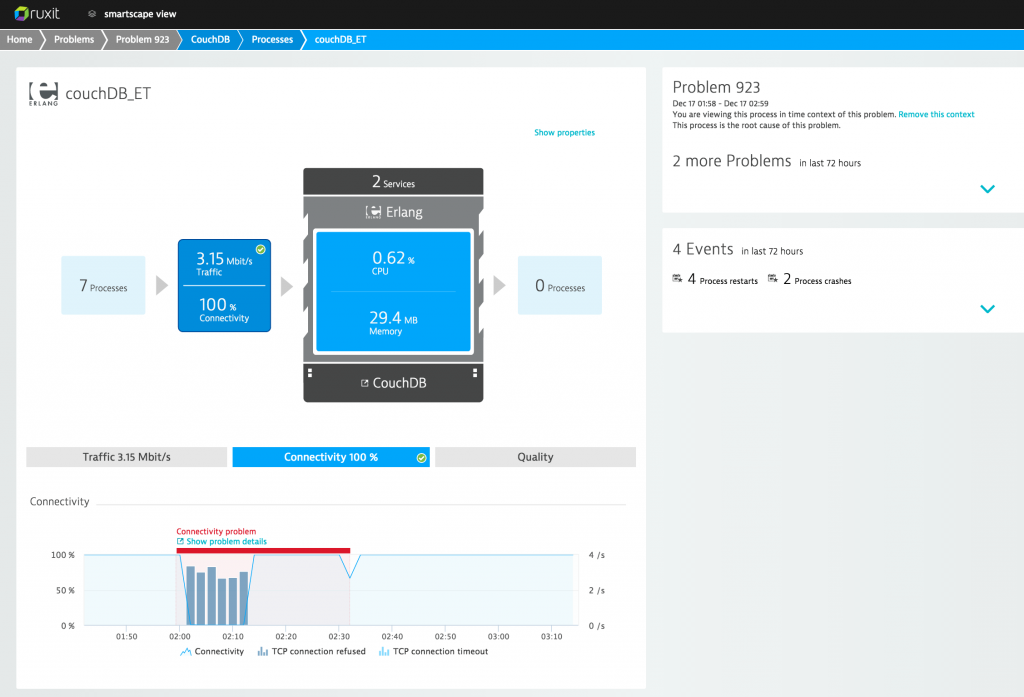
The following screenshot shows how DESK can help detect that a service had a responsiveness time of about 3 ms, not much traffic, and 100% availability over the past 2 hours.
When response time or service availability deviate from the baseline, DESK displays a summary of the resulting problems indicating the number of users that are affected and the root cause of the issue. DESK integrates all this information into AI-driven root-cause analysis.
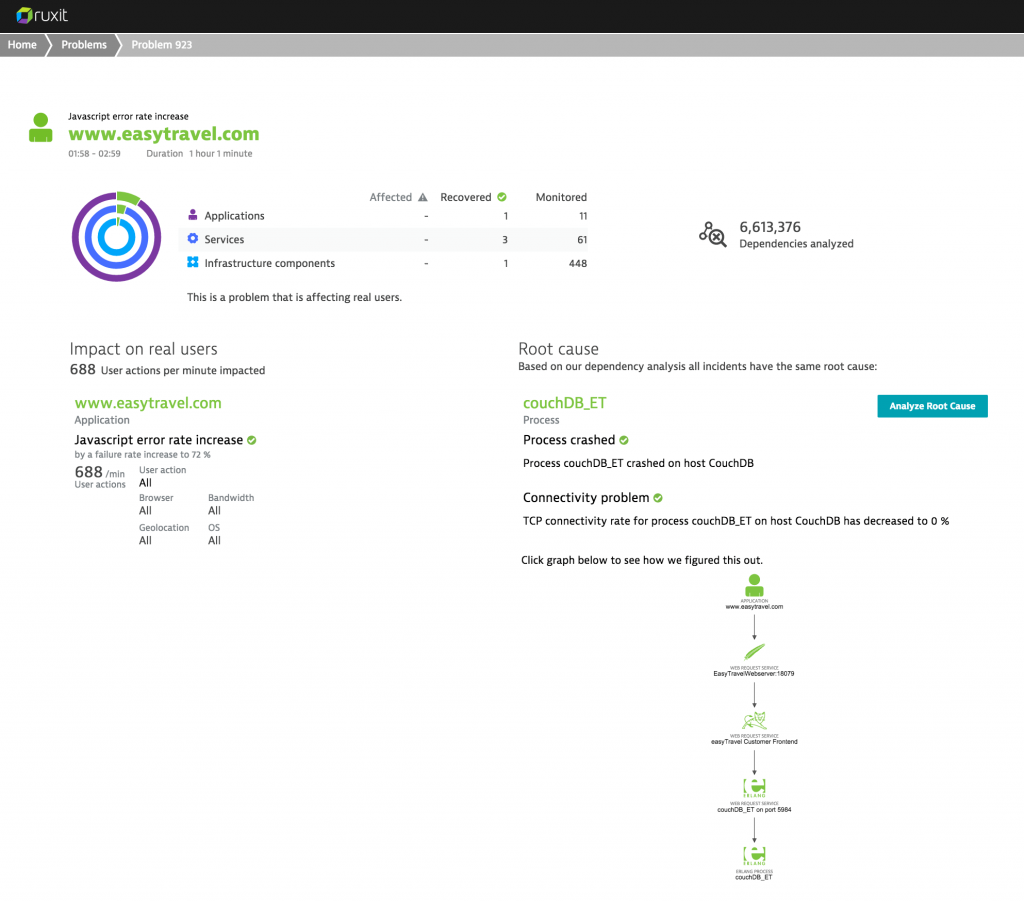
A closer look at the problem reveals that it has affected 688 user actions per minute. The JavaScript error rate has increased and the root cause of the problem is a crashed CouchDB process, which means that the TCP connectivity rate of the process has decreased to 0%. By clicking the process name, you can see that the TCP connections were refused and that connectivity dropped to 0% while the process was restarted, as shown in the following screenshot: