CPU analysis
DESK offers the following capabilities that allow you to perform enhanced code-level analysis:
- Gain insights into processes and process group hotspots
- Access background activity, service activity, single request executions, and specific requests
- Break down and filter data by code execution, network I/O, disk I/O, lock time, and wait times over times
- Break down and filter data by API over time
- View forward stack traces and hotspots with reverse stack traces
- Gain support for Java, .NET, .PHP, .Node.js, and Golang
Perform code-level analysis
-
From the navigation menu, select Diagnostic tools > CPU analysis.
-
Select the process group that contains the process that you want to analyze.
-
Choose the process you want to analyze and click the corresponding Show code level button to view the Hotspots page.
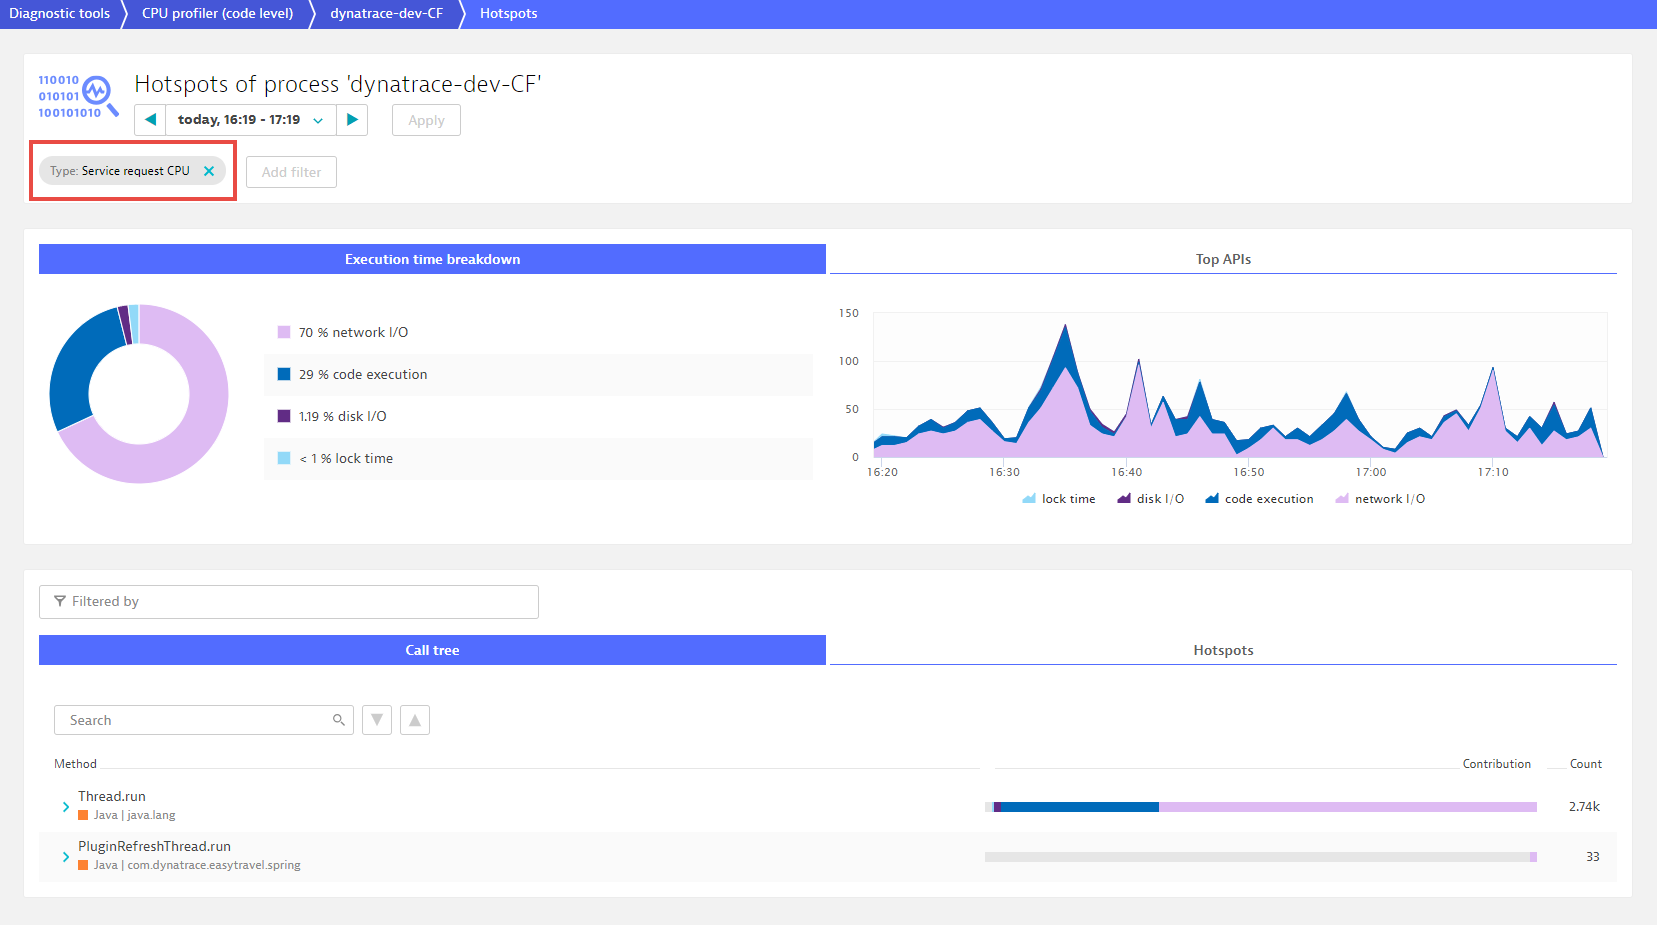
Analysis options
- To analyze a process group, remove the filters.
The color coding of the pie chart, the area chart, and the bars in the code-level stack facilitate code-level diagnostics.
- To access the breakdown of processes, click the Top APIs tab.
Note: You can configure the list of APIs.
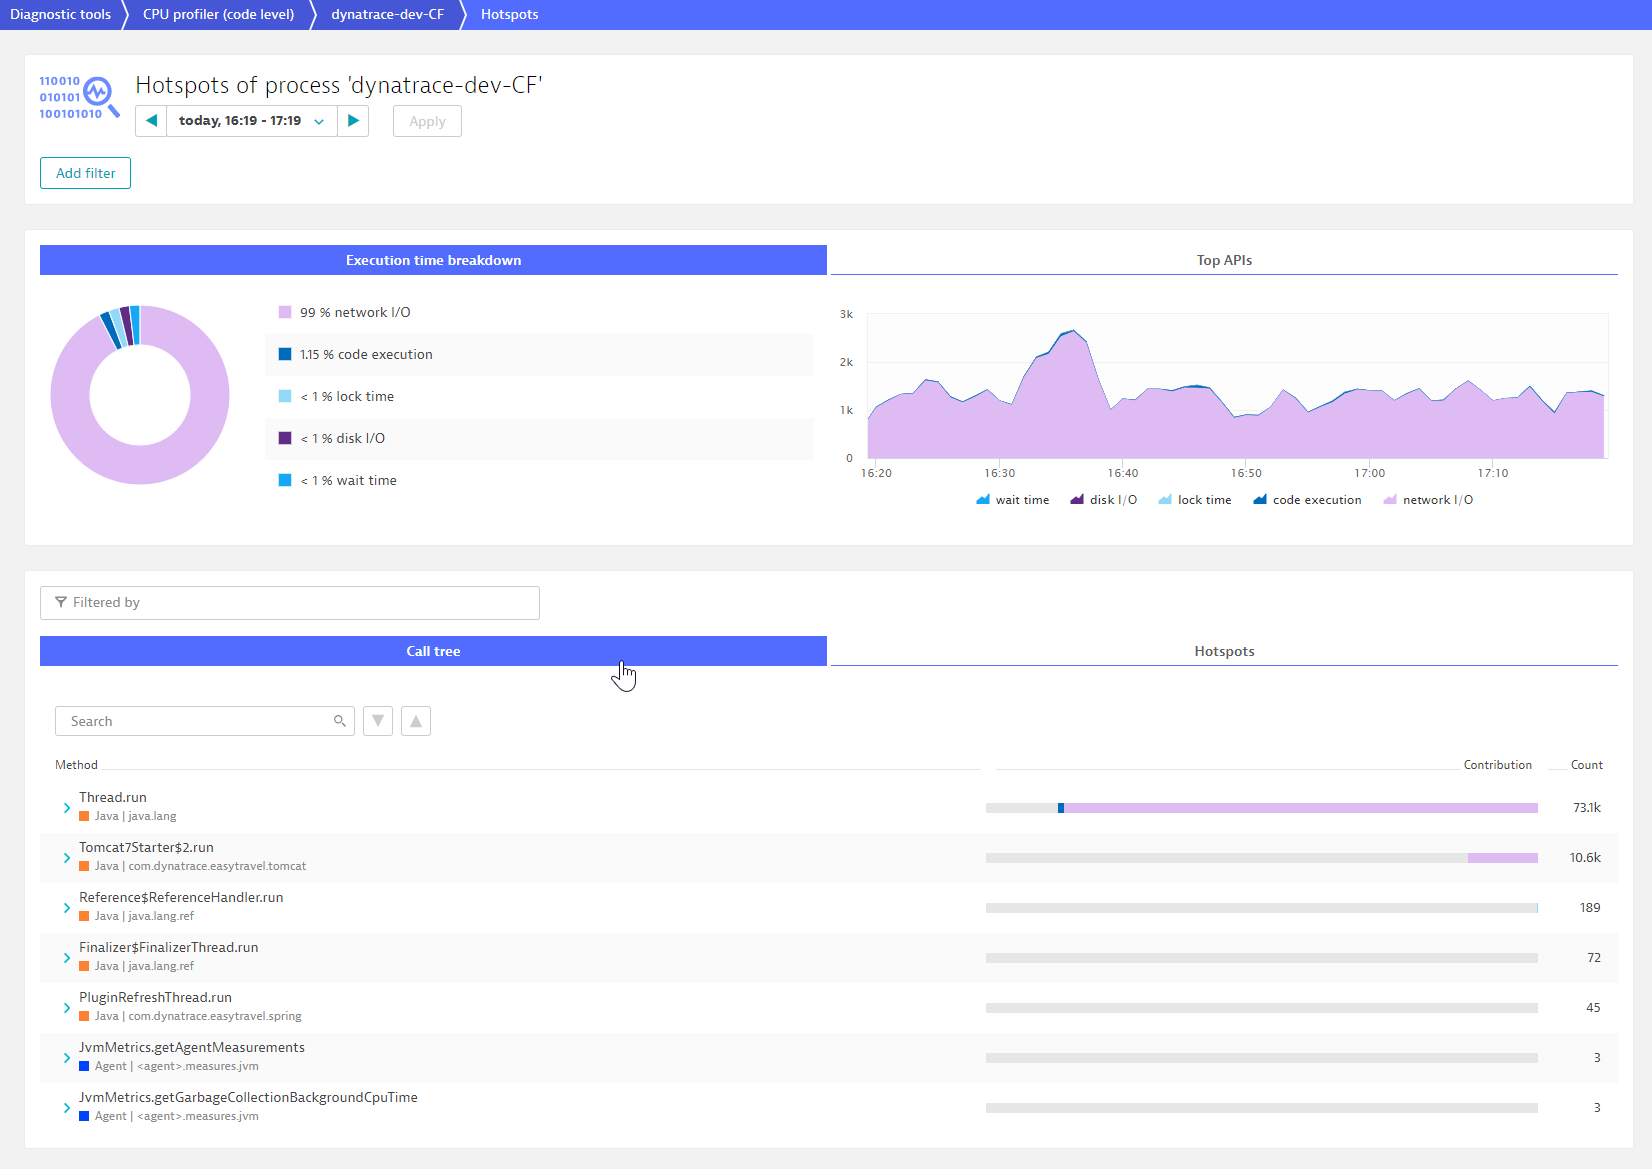
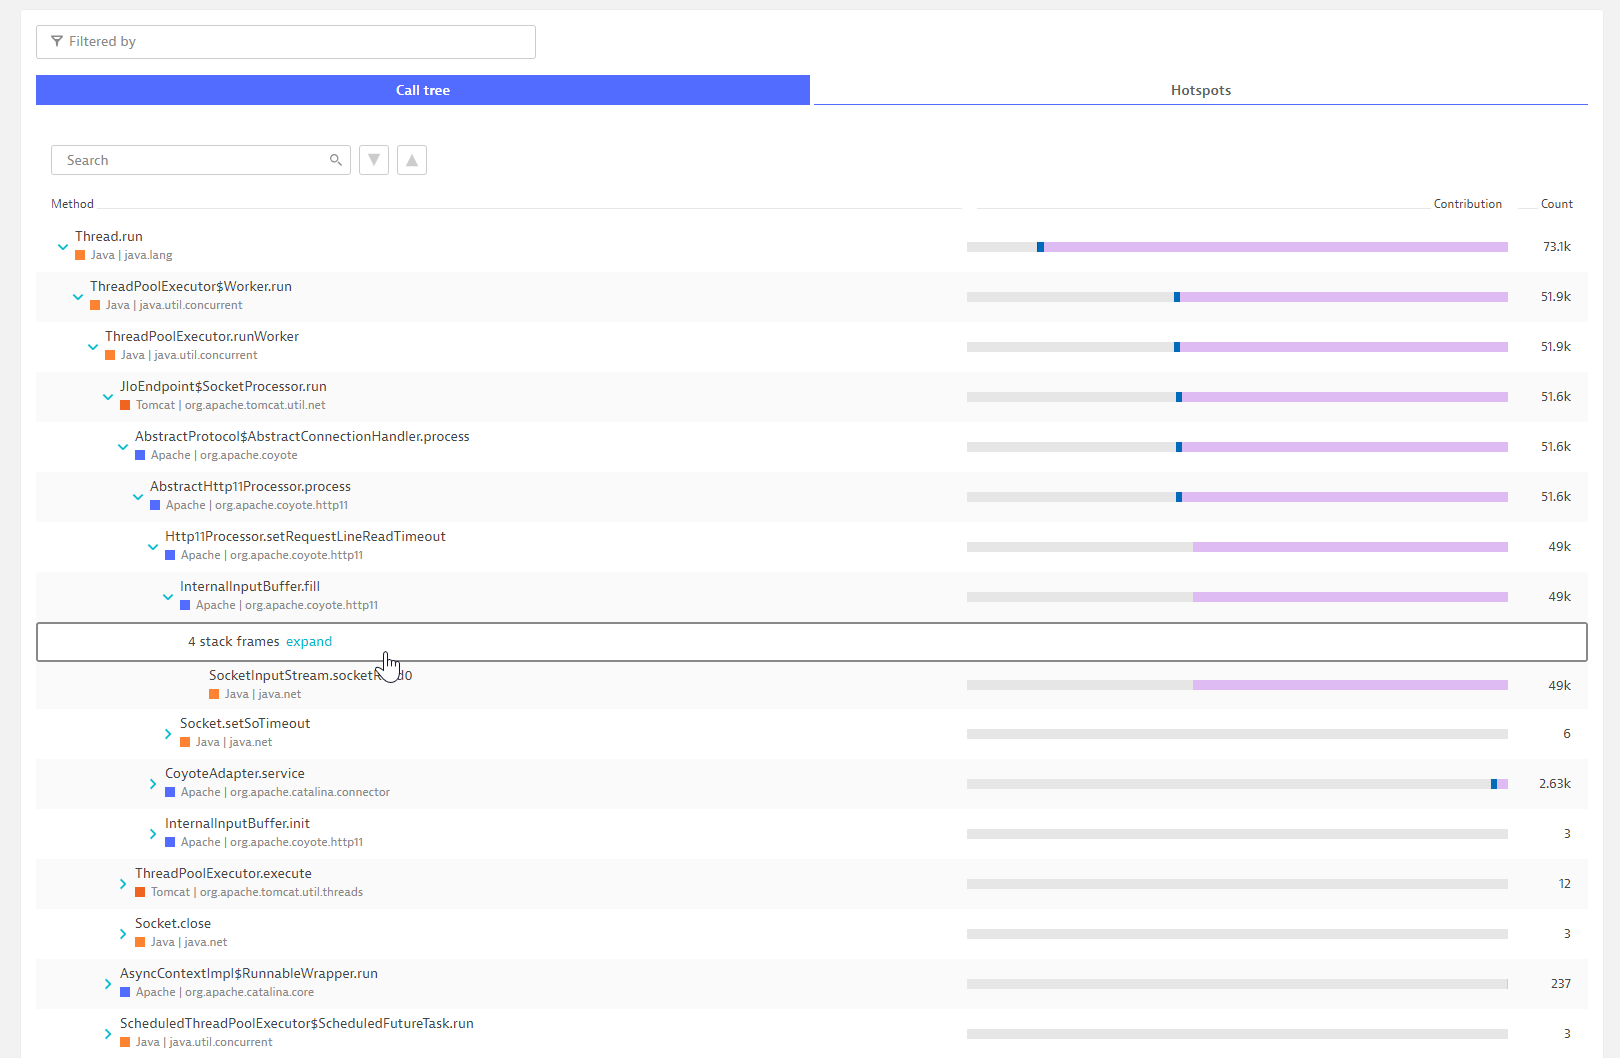
- To view the forward stack trace, click the Call tree tab. Each listed method is tagged with the name and color of the API.
- Click the Hotspots tab to view the top three hotspots with reverse stack traces.
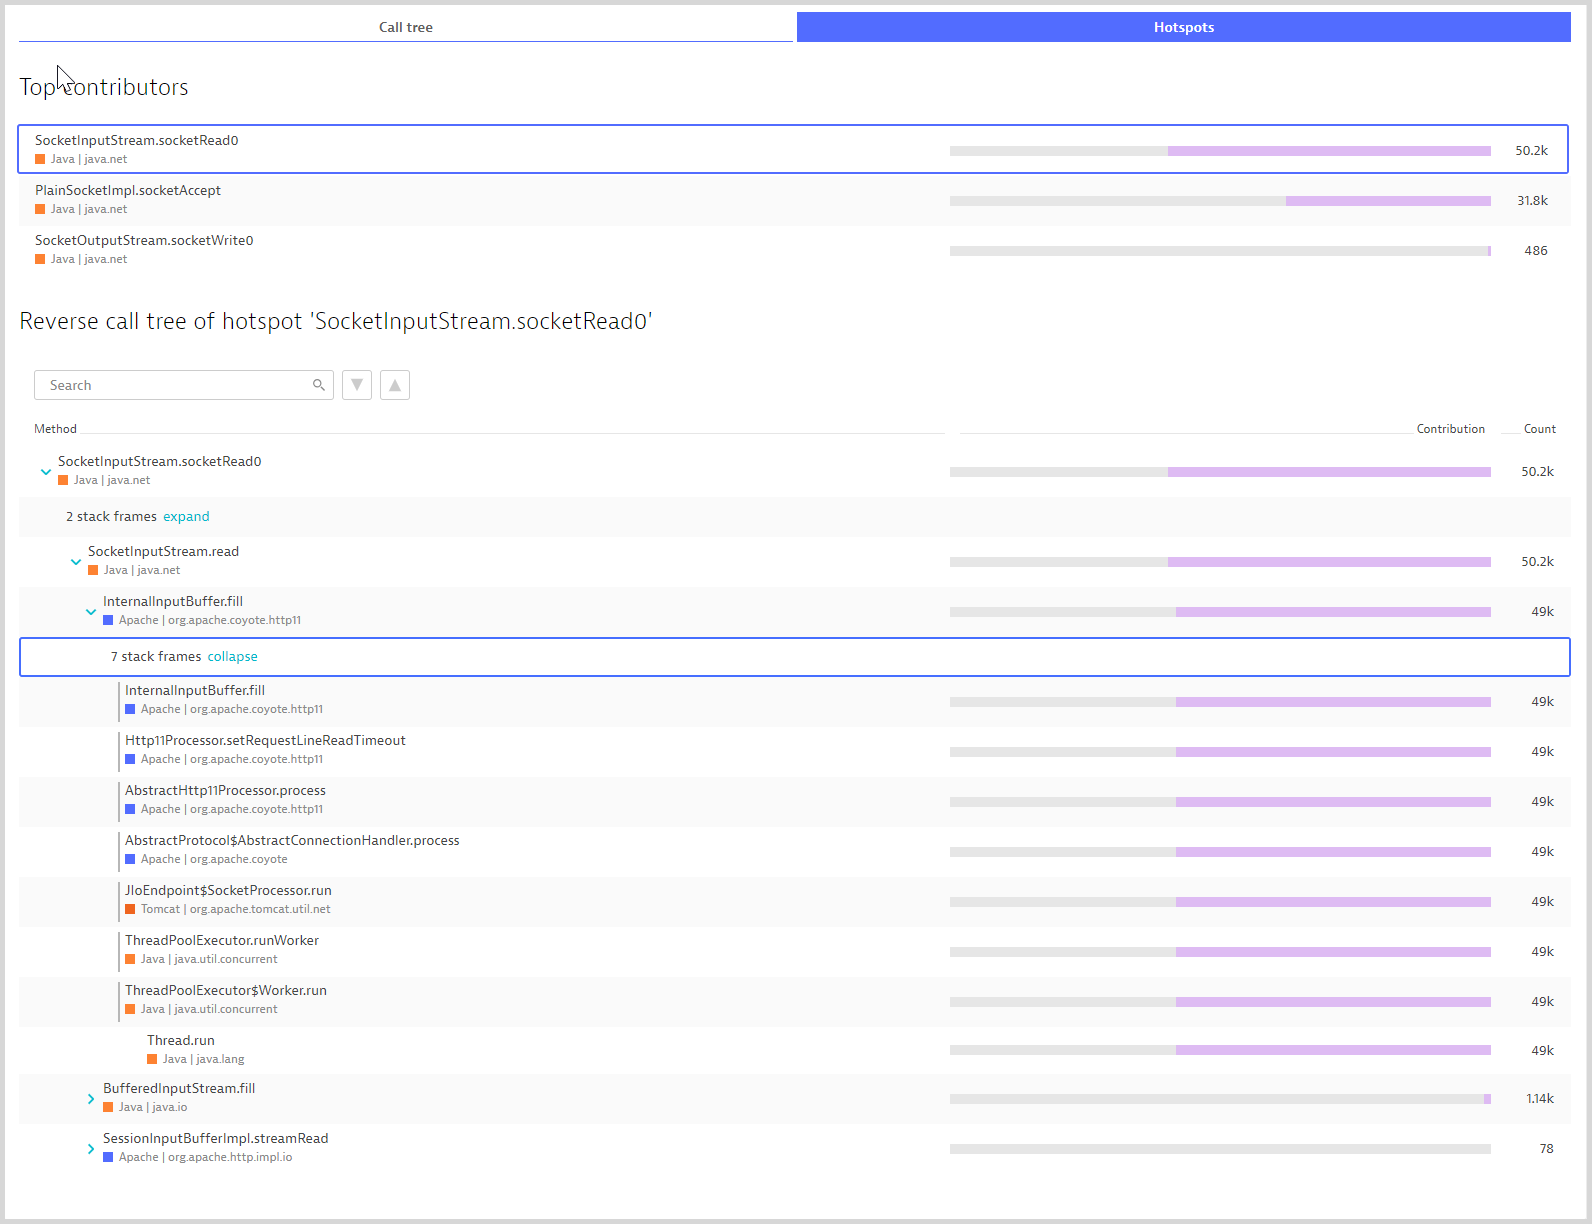
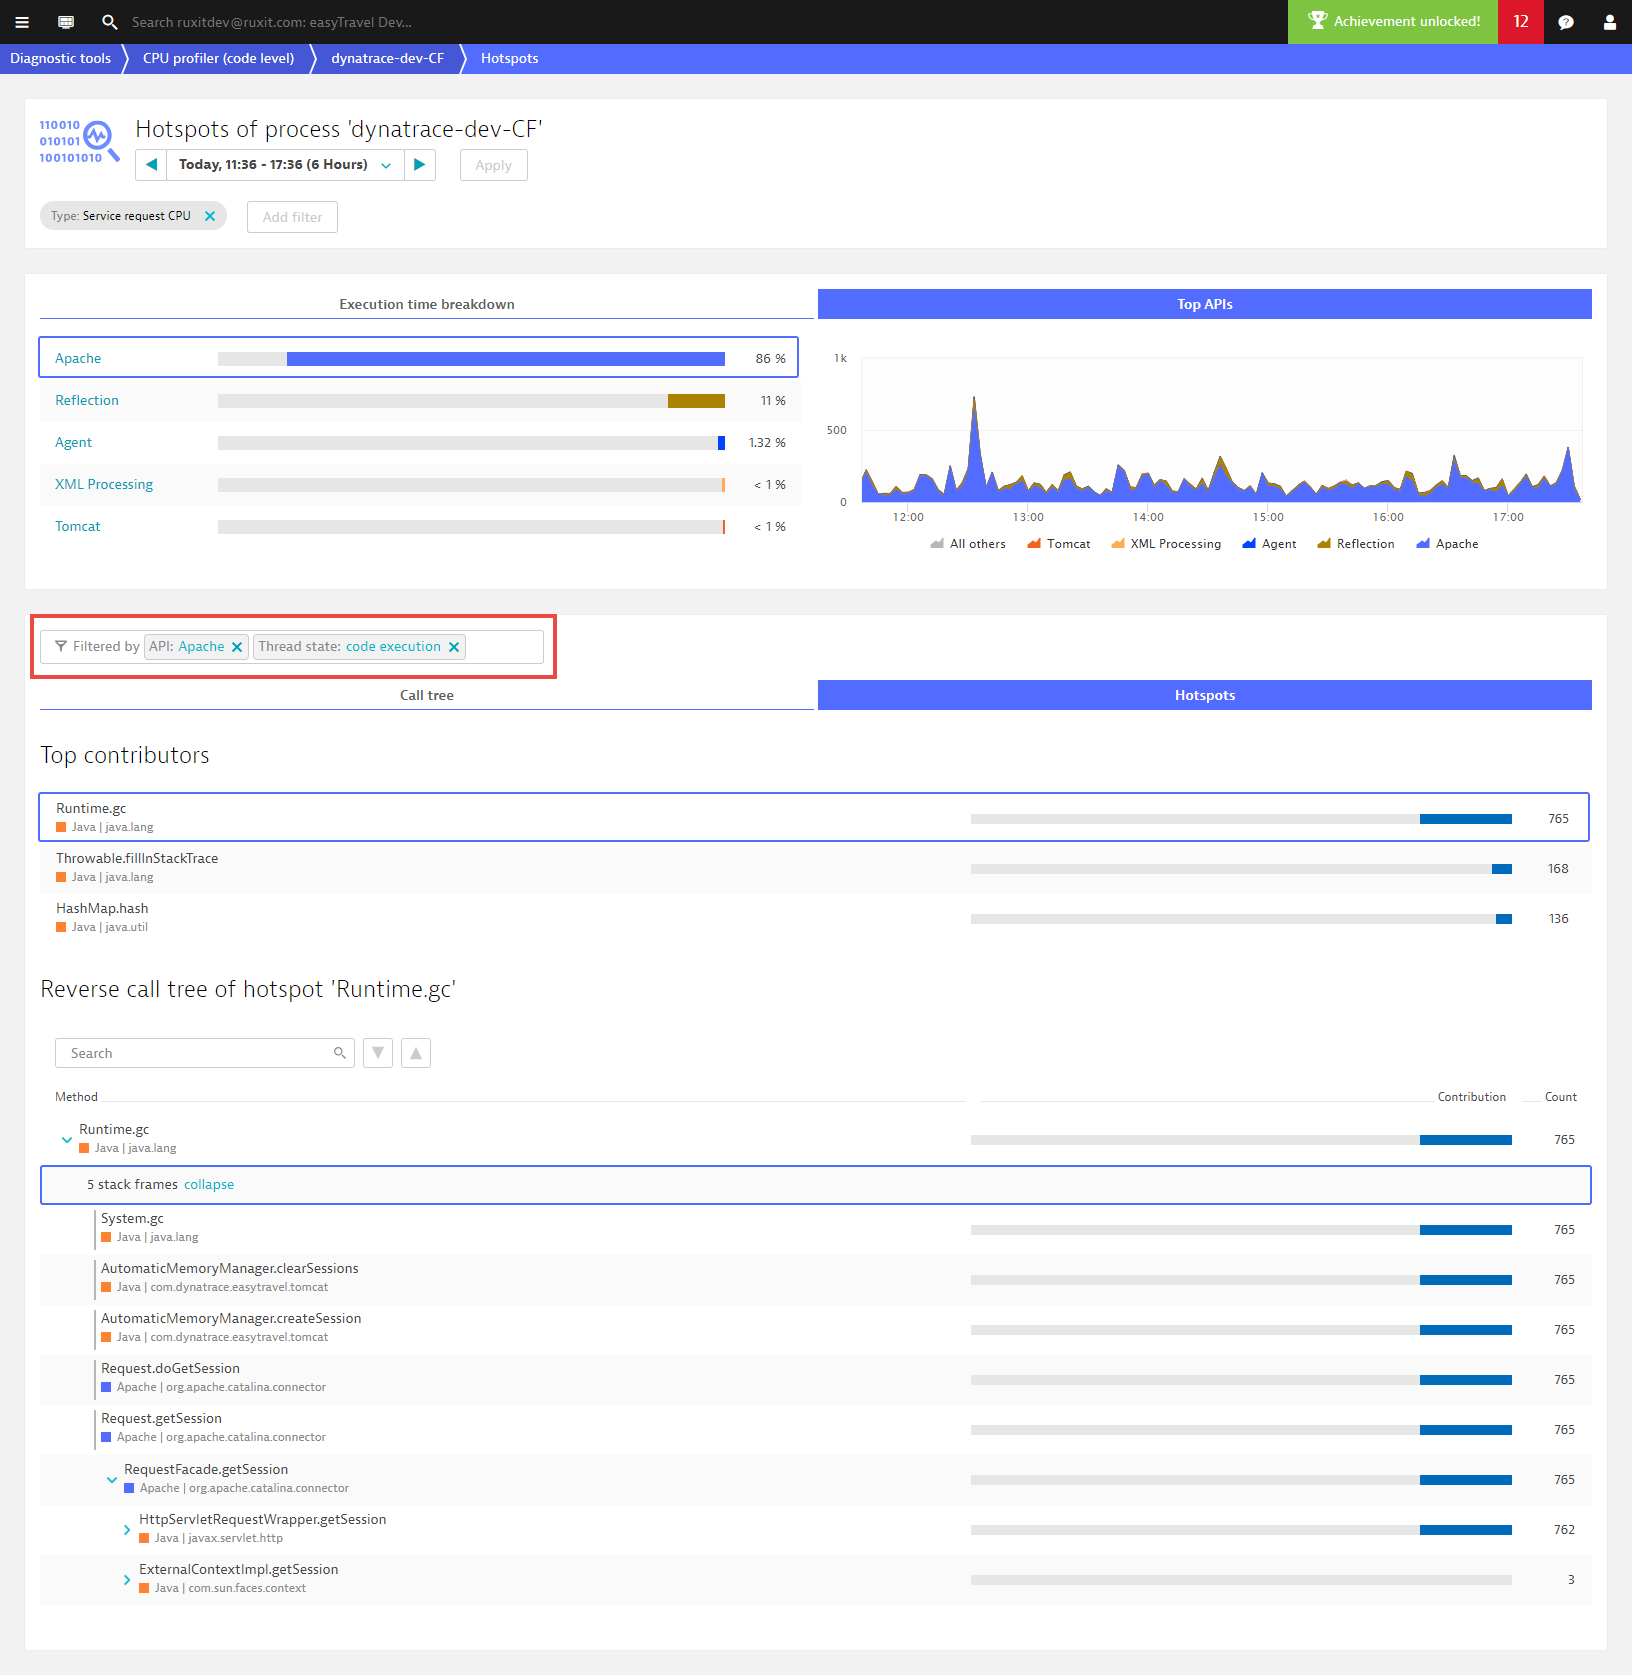
- When you filter the execution times and top APIs, the Call tree and Hotspots views inherit the defined filters.
In the following example, filtering by code execution and Apache (by selecting code execution under the Execution time rundown tab and selecting Apache under the Top APIs tab) reveals that most Apache API execution time is within the Runtime.gc call.
When you open the stack frames, you can deduce that the explicit GC call by easytrace Memory Memory is the culprit.