Exception analysis
Exception analysis is a diagnostics feature that allows you to see which exceptions occurred in your environment during a selected analysis timeframe.
To access exception analysis
- Select Diagnostic tools from the navigation menu.
- Click the Exception analysis tile to access the Exceptions overview page.
How to use exception analysis
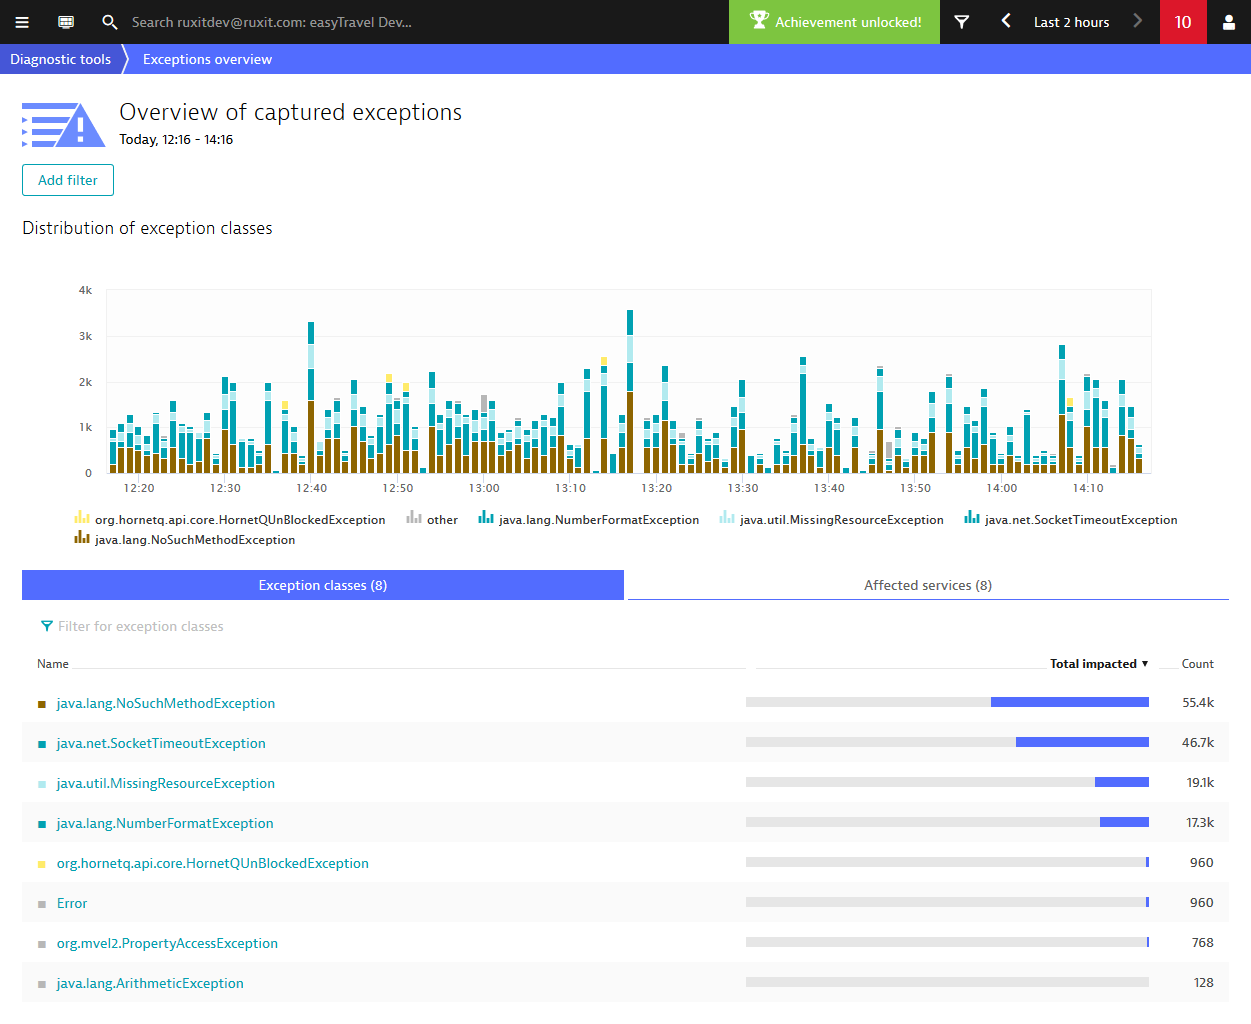
The Exceptions overview page charts the number of exceptions over time (see example below). A comprehensive list of the top exceptions (based on occurrence count) appears beneath the chart on the Exception classes tab. The Affected services tab indicates which services are impacted by each exception and to what extent. You can change the analysis timeframe using the global timeframe selector in the upper right corner of the page. Or use the Add filter button to filter the list of requests or services you’re interested in.
The next typical step is to select a specific exception class (java.net.SocketTimeoutException in this example). This filters the chart and tables to show only the selected exception class (see below).
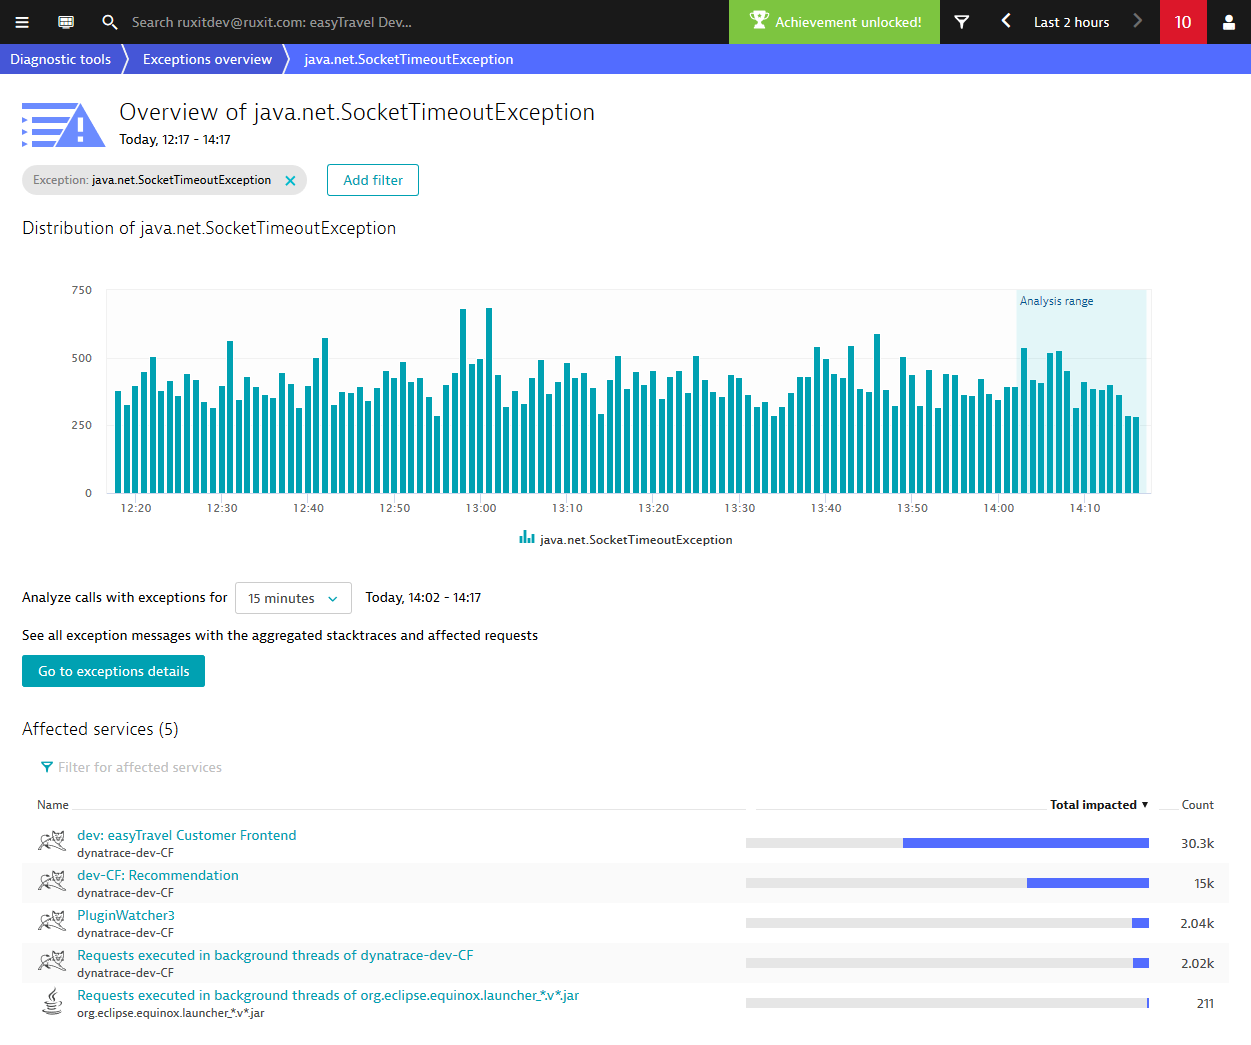
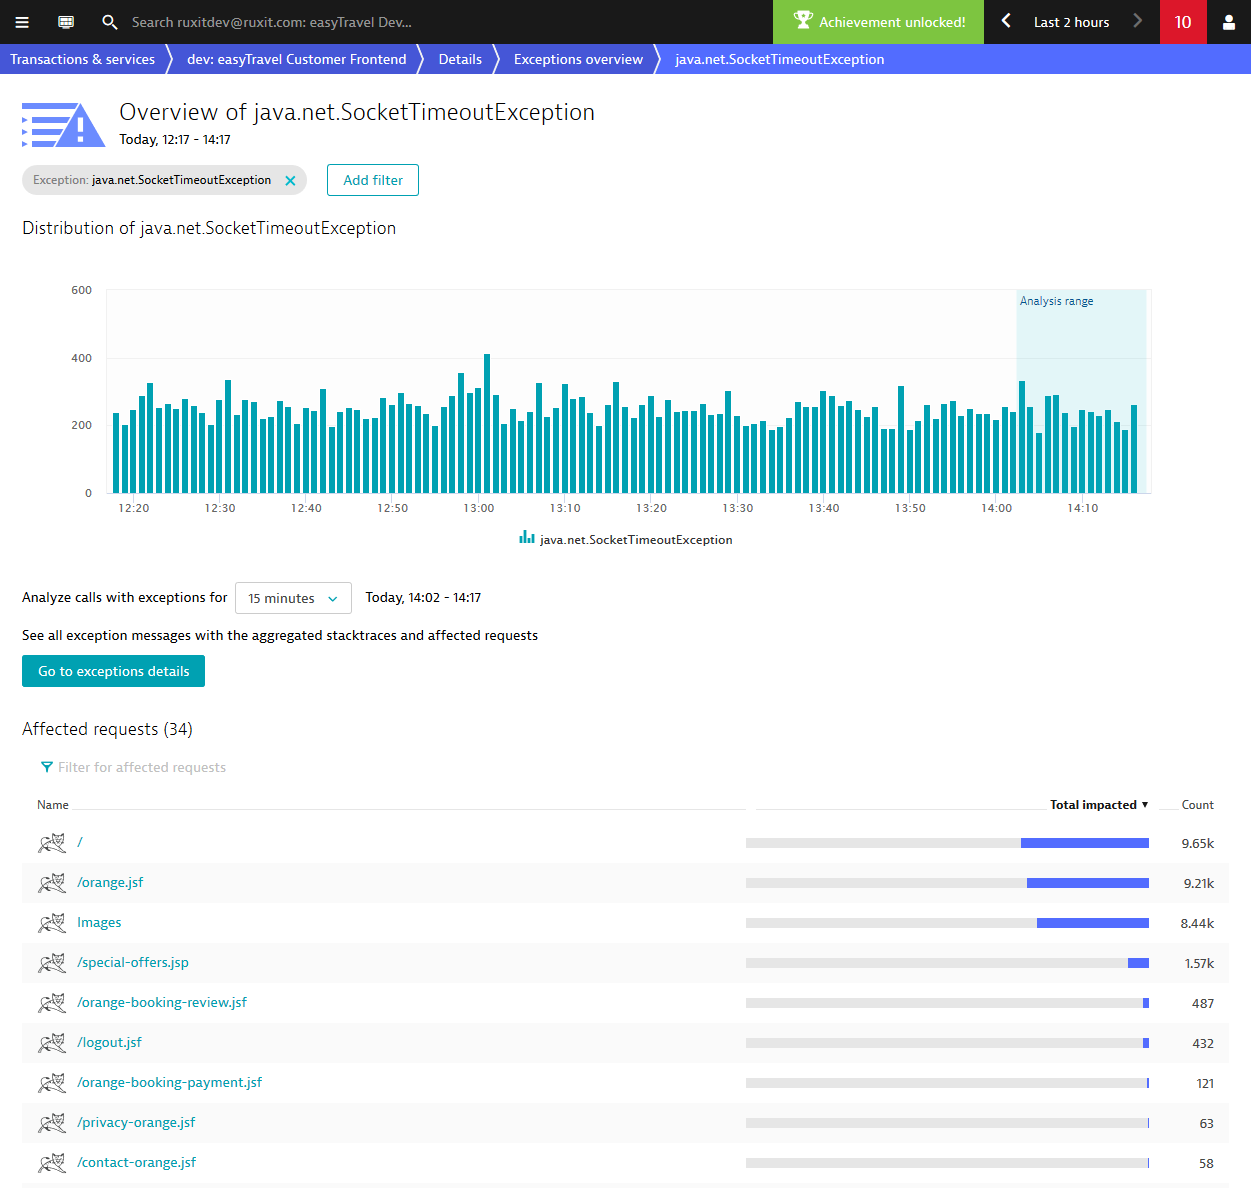
Now you can focus on the trends and details of the selected exceptions or you can analyze how the selected exceptions have impacted certain services. When you click a service name, the view changes to focus on that service. As you can see below, this example frontend service consistently produces the same exception, largely in response to three requests (/, /orange.jsf, and Images).
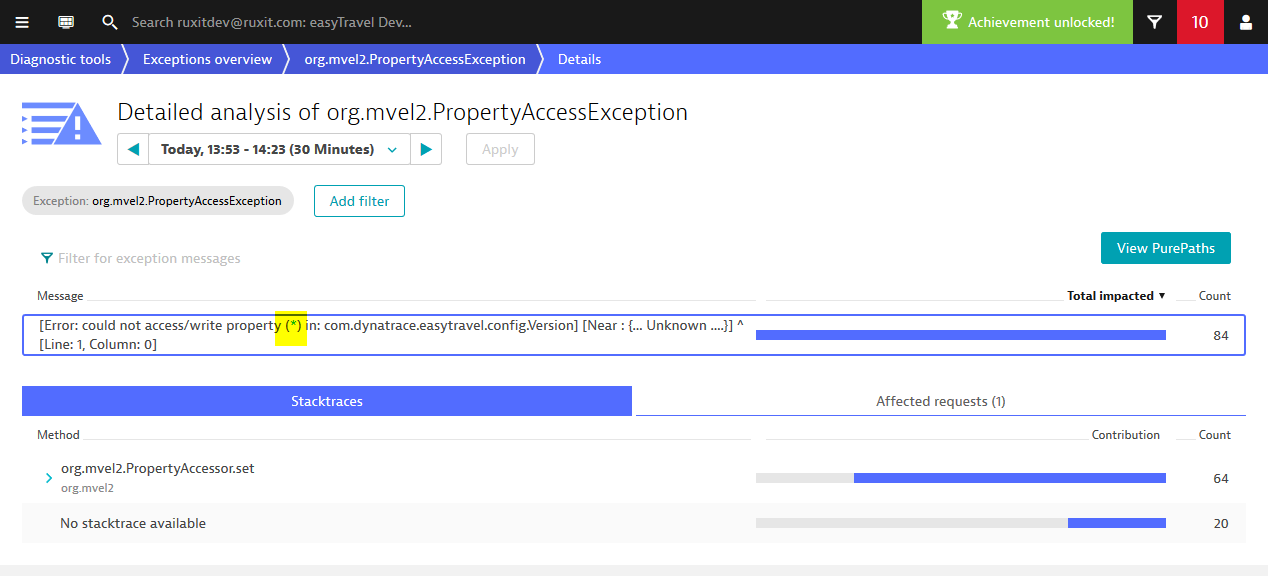
You can drill a little deeper into the details. Click the Go to exceptions details button to view a table that shows if all the exceptions have the same or different messages (see example below). If you have multiple messages, click one of the messages to view the related detail in the table below.
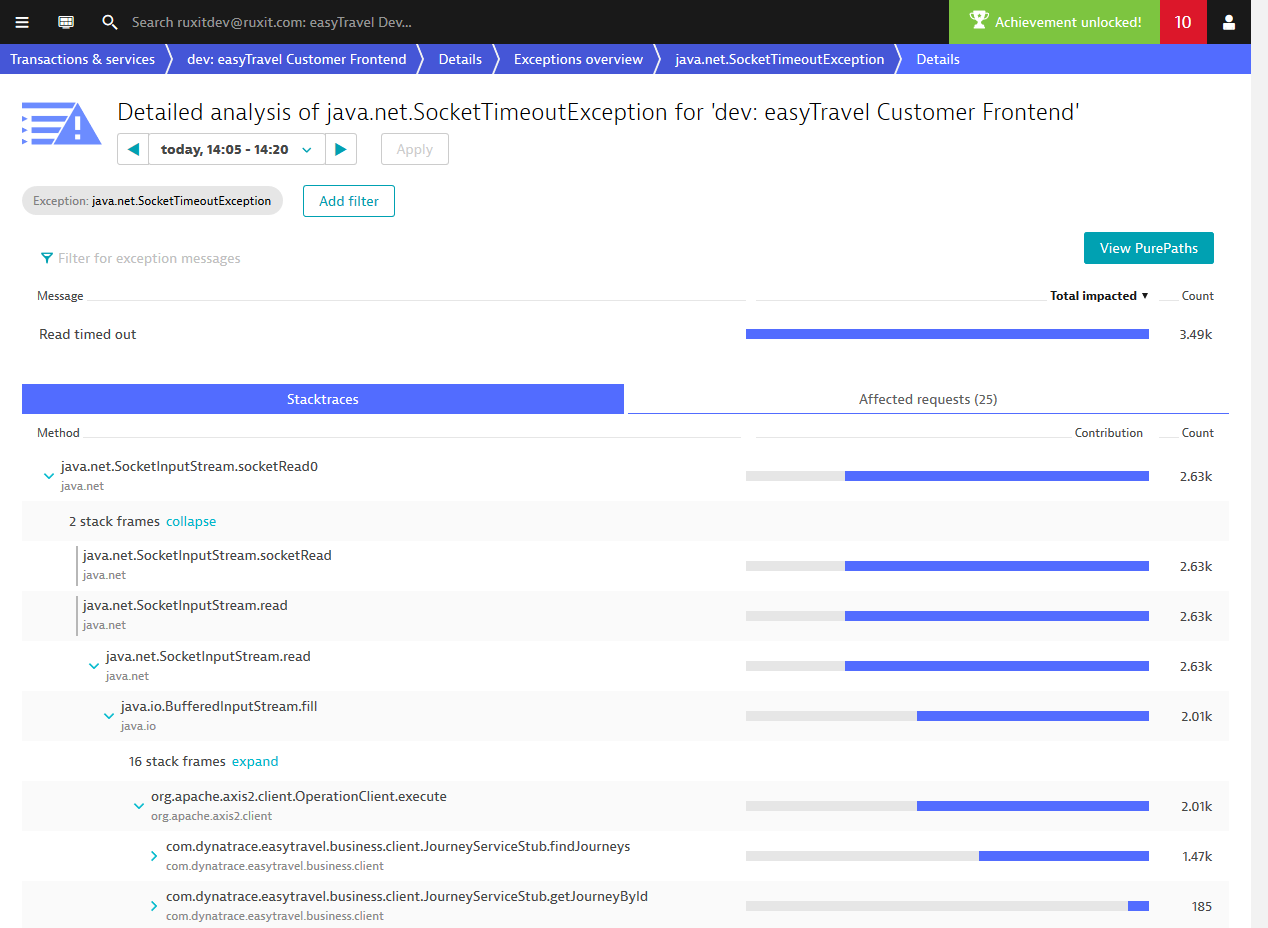
The table shows the aggregated Stacktraces on one tab and the Affected requests on another tab. In this example, the aggregated stack shows over 2,000 exception occurrences that all have more or less the same stack trace. This tells you that the exceptions likely exist in the same location in the code. Such a detail can be very helpful as it provides quick insight into what can be fixed in the code that will result in the greatest improvement. The stack trace can also branch (as it does in this example). This tells you that there are different parts of your code that lead up to the same common code where the selected exception exists.
Of course, a given exception may trigger many different messages. The Details page of an exception relies on the same logic we already use in our logging view to display the top messages. This logic enables us to match messages that are mostly the same and merge them in the Details view. If you want to view the actual messages, click the View PurePaths button to look at the actual requests that contain them. You’ll find the full exception message there.
In addition to Diagnostic tools, you’ll also find this feature in other drill-down sections as well.