Dashboard timeframe selector
The globally available timeframe selector is available for use across all pages and views. You'll find the timeframe selector in the upper-right corner.
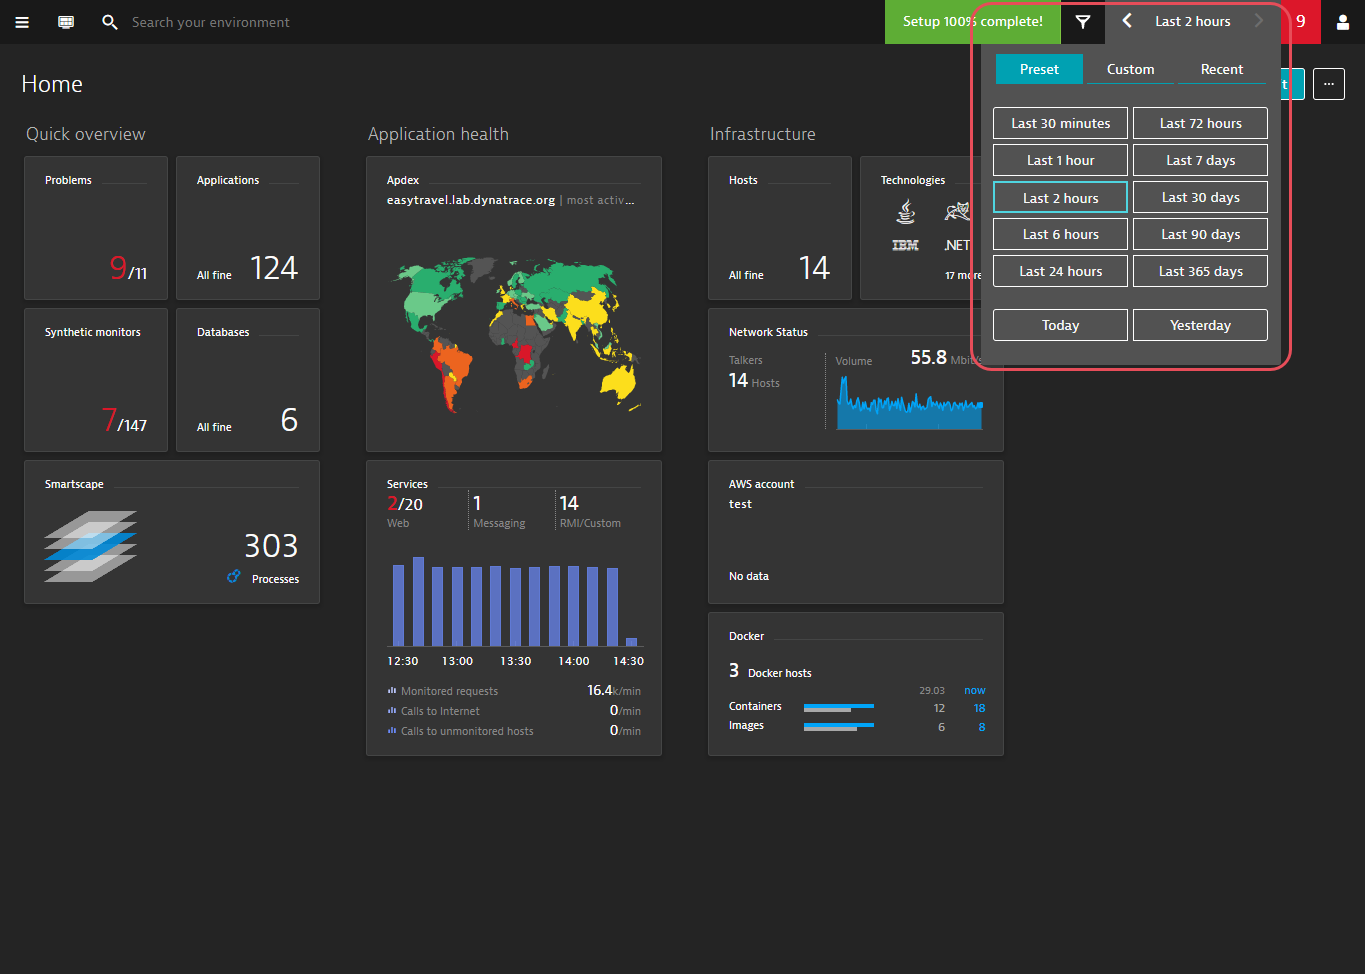
Just select the timeframe you're interested in analyzing. The timeframe selector affects data page-wide.
Previous and Next buttons enable you to move forward and backward in time.
timeframe selection is sticky—selected timeframes are propagated to all pages you visit where timeframe selection is supported. For example, after changing the analysis timeframe on your home dashboard, timeframe selection is preserved as you drill down from the Applications tile to individual application pages. The exception is when you click the Dashboard button in the header. The Dashboard button resets the timeframe to your current dashboard's default timeframe.
Custom dashboards can be built for many different purposes, for example, infrastructure health or Real User Monitoring. This is why it makes sense to have different analysis timeframes for different dashboards—you don't have to reset the timeframe to the default each time you switch dashboards.
Recently used timeframes
In some instances it makes sense to switch back to a recently used timeframe. The timeframe selector includes a list of the most recently used timeframes (up to 10).