Automated multi-dimensional baselining
Context-rich data collection and baselining are the two fundamental pillars that anomaly detection is built on. A huge amount of high-quality and accurate data is necessary to determine baselines that can effectively be used to distinguish between normal and anomalous situations. This distinction however is often blurred due to high data fluctuation or simply because the definition of “normal” is very much context-specific and changes as applications, platforms, infrastructure, and algorithms evolve. This makes the generation of accurate alerts a real challenge.
When an alert is created for a situation that is indeed anomalous, it is a true positive, while if the situation is in fact normal, the alert is false positive. It's also possible that an abnormal situation is missed and therefore no alert is generated. This is characterized as a false negative. True negatives are normal cases that were correctly identified as non-anomalous events. To generate accurate alerts an anomaly detection system should aim at maximizing true positives and true negatives while minimizing false positives and false negatives. To achieve this goal, DESK has developed an intelligent baselining approach.
DESK AI learns the typical reference values of application and service response times, error rates, and traffic.
Traffic
DESK application traffic anomaly detection is based on the assumption that most business traffic follows predictable daily and weekly traffic patterns. DESK automatically learns each applications’ unique traffic patterns. Alerting on traffic spikes and drops begins after a learning period of one week because baselining requires a full week’s worth of traffic to learn daily and weekly patterns. Following the learning period, DESK forecasts the next week’s traffic and then compares the actual incoming application traffic with the prediction. If DESK detects a deviation from forecasted traffic levels that falls outside of reasonable statistical variation, DESK raises an alert.
Error rate
DESK also alerts on failures. Alerting on error rate increases begins once the baseline cube is ready and the application or service has run for at least 20% of a week (7 days). Again, each baseline cube cell also contains the measured error rate. This perfectly adapts to individual browser versions that can show either a higher or lower error rate compared to other browser types.
Response time
For response times, DESK collects references for the median (above which are the slowest 50% of all callers) and the 90th percentile (the slowest 10% of all callers). A slowdown event is raised if the typical response times for either the median or the 90th percentiles degrade.
DESK places special emphasis on the 10% of slowest response times experienced by your customers. This is because if you only know the average (median or mean) response times experienced by the majority of your customers, you'll miss a crucial point: Some of your customers are experiencing unacceptable performance problems! Consider a typical search service that performs some database calls. The response time of these database calls may vary greatly depending on whether or not the requests can be served from cache or if they must be pulled from the database. Median response time measurements in such a scenario are insufficient because although the majority of your customers (those having their database requests served from the cache) are experiencing acceptable response times, a portion of your customers (those having database requests pulled from the database) are experiencing unacceptable performance. Placing monitoring emphasis on the slowest 10% of your customers resolves such issues. Alerting on response time degradations begins once the baseline cube is ready and the application or service has run for at least 20% of a week (7 days).
Multi-dimensionality
Multi-dimensionality offers a highly granular baselining scheme, leading to a more sophisticated baselining approach that ultimately results in more accurate thresholds. The more accurate the thresholds are, the more intelligent the overall anomaly detection process becomes.
Consider as an example the application baseline cube that is generated for the calculation of the response time thresholds. Suppose that you have a web application called "easyTravel". A non-multidimensional system would learn a reference value for the response time of the entire application. A more fine-grained approach however would delve into each user action and learn a separate reference value for each of them. Let’s assume that easyTravel is comprised of four user actions login, logout, getBookingPage and getReportPage. For each user action, a separate response time baseline would be specified.
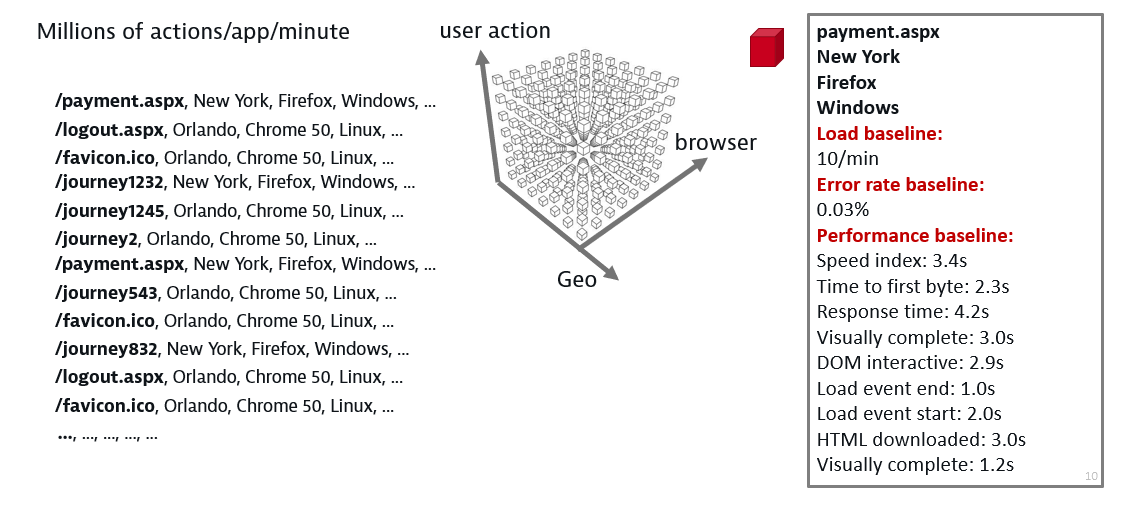
In addition to user actions, DESK takes into account the geographical location. This means that DESK AI will identify baselines for the combinations of each user action with each geolocation. A response time baseline of 90msec could be, for example, the response time baseline for the logout action in the US. But multi-dimensionality in DESK AI goes even deeper. Each geolocation is combined with the browser type and each browser type in turn is combined with the operating system, ultimately resulting in the specification of a separate threshold for each combination of user action, geolocation, browser, and operating system. The generated baseline cube, offers a high-level baseline granularity and accuracy.
For geolocations, DESK offers multiple levels of granularity. For example, DESK calculates not only the response time for the entire US region, but also the response time for each state, as well as for each city in each state. The same is true for other regions (for example, Europe, Asia). Conversely, a more coarse-grained view is possible for user actions, as user actions can be grouped into XHR and load actions.
Baselining dimensions
The identification of reference values is based, as explained above, on a baseline cube calculation. For applications, this cube is generated by the combination of four application dimensions while for services, they are based on two dimensions.
Application baselining dimensions
- User action: An application's user action (for example,
orange.jsf,login.jsp,logout, orspecialOffers.jsp). - Geolocation: Hierarchically organized list of geolocations where user sessions originate. Geolocations are organized into continents, countries, regions, and cities.
- Browser: Hierarchically organized list of browser families, such as Firefox and Chrome. The topmost categories are the browser families. These are followed by the browser versions within each browser family.
- Operating system: Hierarchically organized list of operating systems, such as Windows and Linux. The topmost categories are the operating systems. These are followed by the individual OS versions.
Service baselining dimensions
- Service method: A service's individual service methods (for example,
getBookingPageorgetReportPage). In the case of database services, the service method represents the different SQL statements that are queried (e.g.,call verify_location(?) select booking0_.id from Booking booking0_ where booking0_.user_name<>?). A reference value is additionally calculated for the predefined service method groups, static requests, and dynamic requests. - Service method group: Static or dynamic groups for web services, and for database services, groups that correspond to database operations like insert, update, select and so forth. For database services, a reference value is calculated for the predefined service method groups
inserts,updates, andselects.
How automated baselining works
Automated baselining attempts to figure out the best reference values for incoming application and service traffic. To do this, DESK automatically generates a baseline cube for your actual incoming application and service traffic. This means that if your traffic comes mainly from New York, and most of your users use the Chrome browser, your baseline cube will contain the following reference values:
USA - New York – Chrome – Reference response time : 2s, error rate: 0%, load: 2 actions/min
If your application also receives traffic from Beijing, but with a completely different response time, the baseline cube will automatically adapt and thereafter contain the following reference values:
USA - New York – Chrome – Reference response time : 2s, error rate: 0%, load: 2 actions/min
China – Bejing - QQ Browser - Reference response time : 4s, error rate: 1%, load: 1 actions/min
DESK checks when your applications and services are initially detected by OneAgent. The baseline cube is calculated two hours after your application or service is initially detected by OneAgent so that it can analyze two hours of actual traffic to calculate preliminary reference values and identify where your traffic comes from. Calculation of the reference cube is repeated every day so that DESK can continue to adapt to changes in your traffic.
Smart alerting
For the generation of alerts, baselines are evaluated within 5-min and 15-min sliding time intervals. The 5-min window serves for quick alerting in case a sufficient number of sample values surpassing a baselines are identified. A 15-min interval is used for generating alerts with higher confidence. However, in case a large amount of sample values is found to be above the baselines within one minute, DESK will generate an alert at this point of time as well.
To avoid over-alerting and reduce notification noise, the automated anomaly detection modes don't alert on fluctuating applications and services that haven't run for at least 20% of a full week (7 days). Alerting on response time degradations and error rate increases begins once the baseline cube is ready and the application or service has run for at least 20% of a week (7 days).
DESK application traffic anomaly detection is based on the assumption that most business traffic follows predictable daily and weekly traffic patterns. DESK automatically learns each applications’ unique traffic patterns. Alerting on traffic spikes and drops begins after a learning period of one week because baselining requires a full week’s worth of traffic to learn daily and weekly patterns.
Following the learning period, DESK forecasts the next week’s traffic and then compares the actual incoming application traffic with the prediction. If DESK detects a deviation from forecasted traffic levels that falls outside of reasonable statistical variation, DESK raises either an Unexpected low traffic or an Unexpected high traffic problem.
In general, newly detected anomalous events in an environment won't necessarily result in the immediate raising of an alert. Raised alerts always provide insight into the underlying root cause. To identify the root causes of problems, DESK follows a context-aware approach to detect interdependent events across time, processes, hosts, services, applications, and both vertical and horizontal topological monitoring perspectives. By taking into account all these monitoring perspectives, DESK pinpoints the root causes of problems. And only then will alerts be generated for a detected problem.