How to define a maintenance window
There are typically some planned or ad-hoc periods of time, during which your system undergoes maintenance activities that can cause service disruption. During such periods, you wouldn't like annoying alerts to be generated. In addition, you wouldn't like such periods to be taken into account when calculating the availability percentage of your system. To avoid such unpleasant situations, DESK enables you to define maintenance windows.
In general, it’s good practice to keep your performance monitoring system informed of scheduled maintenance windows to ensure accurate monitoring data. DESK enables you to define maintenance windows using either the REST API or the web user interface.
Maintenance window types
DESK distinguishes between two types of maintenance windows: planned maintenance windows and unplanned maintenance windows. Planned maintenance windows are configured in advance while unplanned windows can be added retroactively to notify DESK of unexpected downtimes that shouldn’t be factored into overall performance and availability baselines.
The main differences between planned and unplanned maintenance windows are:
- Planned maintenance windows are defined in advance and can be used to disable alerts on problems detected during the window.
- Planned maintenance window times are excluded from synthetic SLA report calculation.
- Response times and error rates during maintenance windows are excluded from regular baseline calculation.
Maintenance window effects on baseline calculation
Once a maintenance window is defined, DESK automatically excludes the configured time period from its baseline calculations. With this approach, any response time anomalies that occur during the corresponding rolling update won’t negatively influence your overall service and application baselines.
With respect to baselining, it’s a good idea to define your maintenance windows before performing any load testing. Using maintenance windows during load testing ensures that any load spikes, longer-than-usual response times, or increased error rates won’t negatively influence your overall baselining.
Configure a maintenance window via the web UI
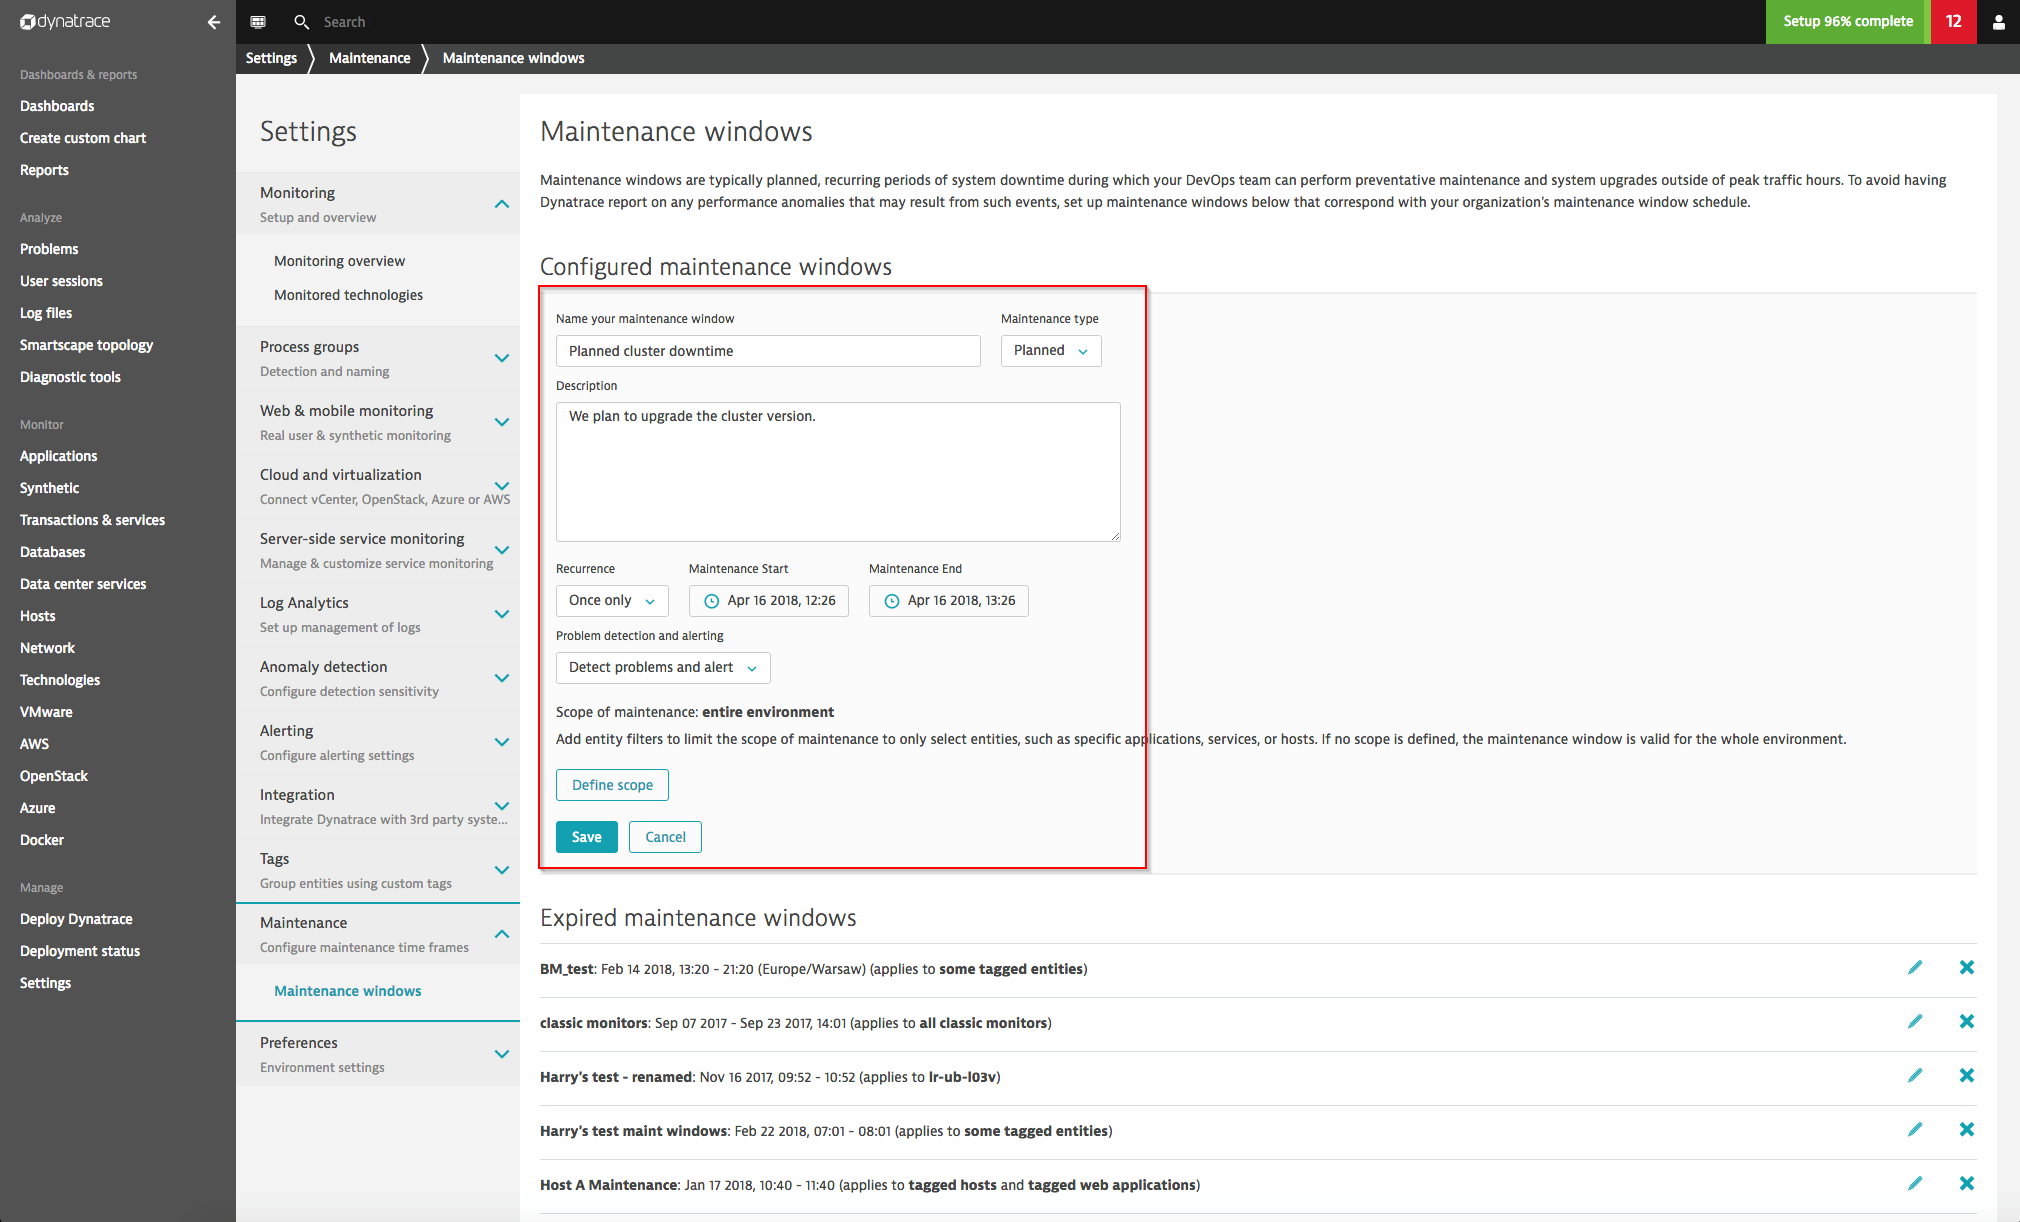
Each maintenance window you configure has a name and description that you can use to provide contextual information about the purpose of the maintenance window.
To define a maintenance window
- Go to Settings > Maintenance > Maintenance windows.
- Define a Name for the maintenance window.
- Provide a Description of the purpose of the maintenance window.
- From the Maintenance type drop list, select Planned or Unplanned.
- If the maintenance window is to recur on a regular schedule, use the drop lists to define a daily, weekly, or monthly recurring schedule.
- From the Problem detection and alerting drop list, specify the action that DESK should take if a monitored component experiences a problem during a scheduled maintenance window:
Detect problems and alert: DESK will automatically detect and report all problems as usual and display a maintenance window icon (wrench and bolt icon, see below) on each problem that is detected during a maintenance window.
Detect problems but don’t alert: Problems will be detected but DESK won’t send out alerts for the problems. Each problem will be listed on the Problems page with a maintenance window icon.
Disable problem detection: Detection and alerting of problems is disabled. Problems that occur during scheduled maintenance windows will not be included on the Problems page and no alerts will be sent out.
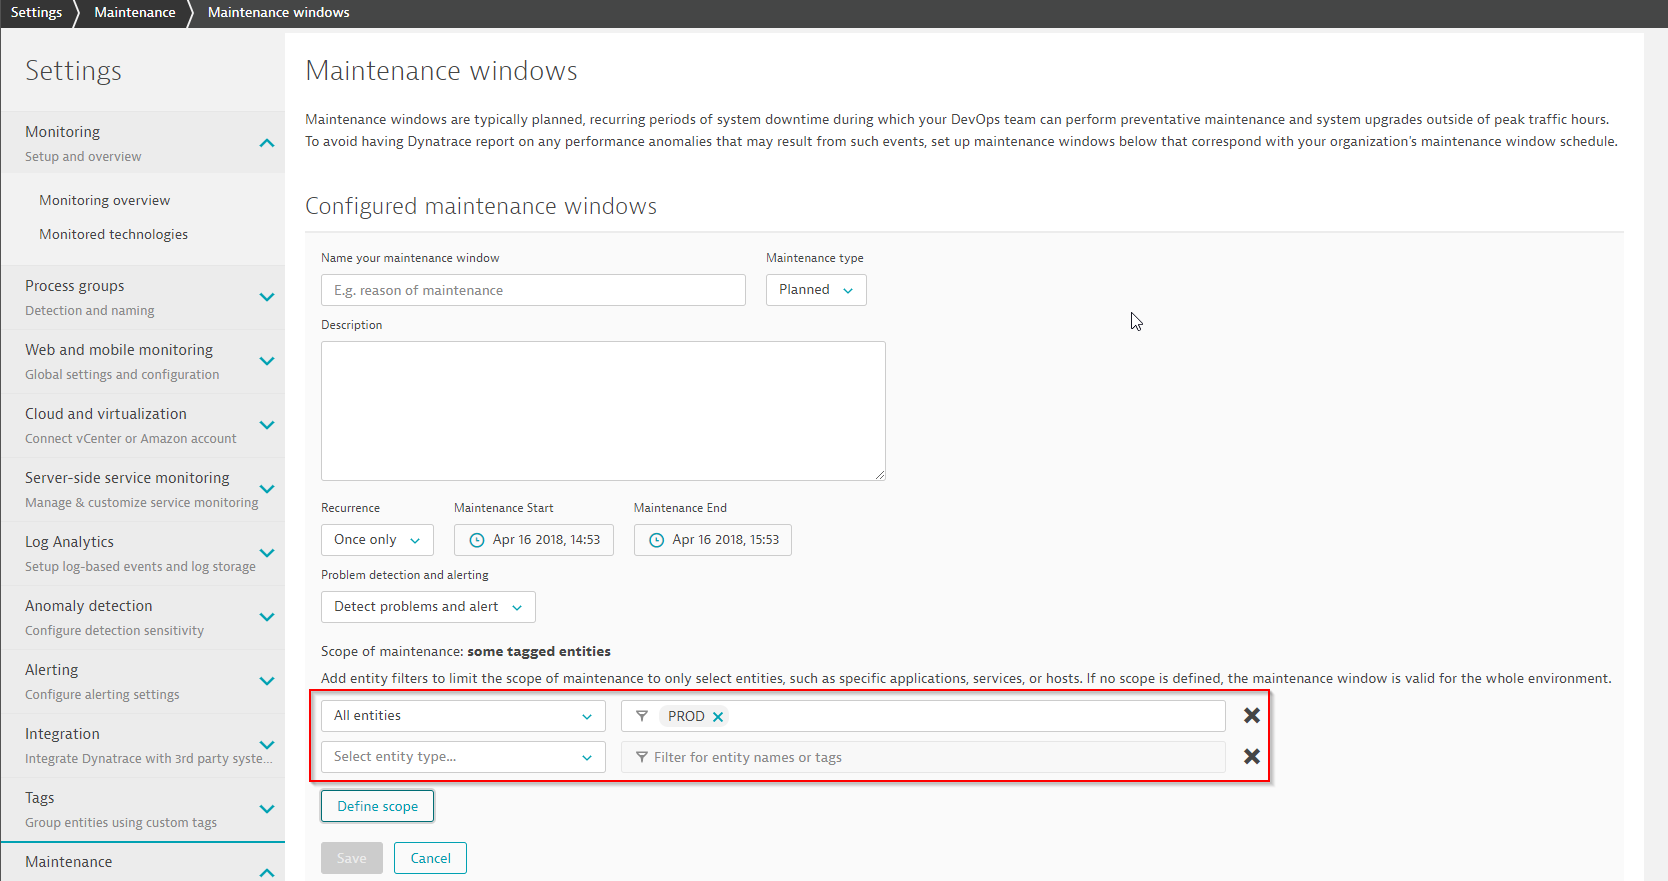
Define the scope of your maintenance window
By default a maintenance window is defined for your entire environment. By using scopes you can define fine-grained boundaries for monitored entities that are affected by a maintenance window.
You can include entity tags for specific Applications, Services, or Hosts (see host tag example in the image below) or for tagged groups of components (for example, all hosts that have the tag PROD.
The scope can also be set to any process group where every process that is grouped under the same process group is affected.
Define maintenance windows using the REST API
Your DevOps team may prefer to use our automation REST API to define maintenance windows. With our REST API, you get all the functionality you need to read, create, and update maintenance window configurations.
To view all defined maintenance windows, execute an HTTP GET call to /api/v1/maintenance/.
The result is shown below:
[
	{
		"id":"New application deployment",
		"type":"Planned",
		"description":
		"We will deploy a new easyTravel application version",
		"suppressAlerts":false,
		"suppressProblems":false,
		"scope":null,
		"schedule":{
			"type":"Day",
			"timezoneId":
			"Europe/Vienna",
			"maintenanceStart":"2017-08-29 14:43",
			"maintenanceEnd":"2017-08-29 15:43",
			"recurrence":{
				"start":"14:43","duration":556
			}
		}
	}
]
An HTTP POST request to /api/v1/maintenance/ with the payload below creates a new maintenance window:
{
	"id" : "theWindowId",
	"type": "Planned",
	"description" : "Again another release",
	"suppressAlerts" : true,
	"suppressProblems" : false,
	"scope" : {
		"entities" : [
			"HOST-0B3371A5AC53FF12", "SERVICE-13FA1F30530CDEE1"
		],
		"matches" : [
			{
				"type" : "HOST",
				"tags" : [
					{
						"context" : "AWS",
						"key" : "myTag1",
						"value" : "myValue1"
					},
					{	"key" : "myTag2" }
				]
			}
		]
	},
	"schedule" : {
		"type" : "Month",
		"timezoneId" : "Universal",
		"maintenanceStart" : "2017-01-01 00:00",
		"maintenanceEnd" : "2017-10-01 00:00",
		"recurrence" : {
			"dayOfMonth" : 4,
			"start" : "11:00",
			"duration" : 30
		}
	}
}
Refer to DESK Help for more details about our maintenance window API.
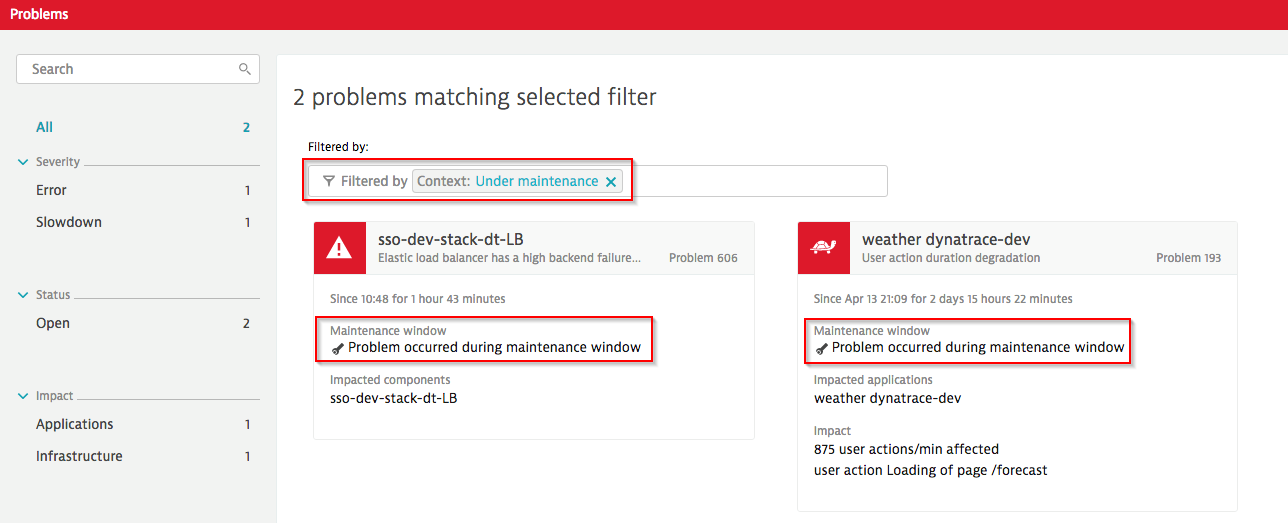
How maintenance windows work
Once you’ve defined your maintenance windows, DESK flags all problems that occur during maintenance windows with a special maintenance icon (wrench and bolt, see examples below). The Problems page filters include an Under maintenance filter that enables you to view a list of problems that occurred during maintenance windows. If you choose to completely disable problem detection during maintenance windows, no detected problems will be displayed on the Problems page (see example below). Note that in this case the detected problems will never be displayed, even if they still exist after the maintenance period is over.
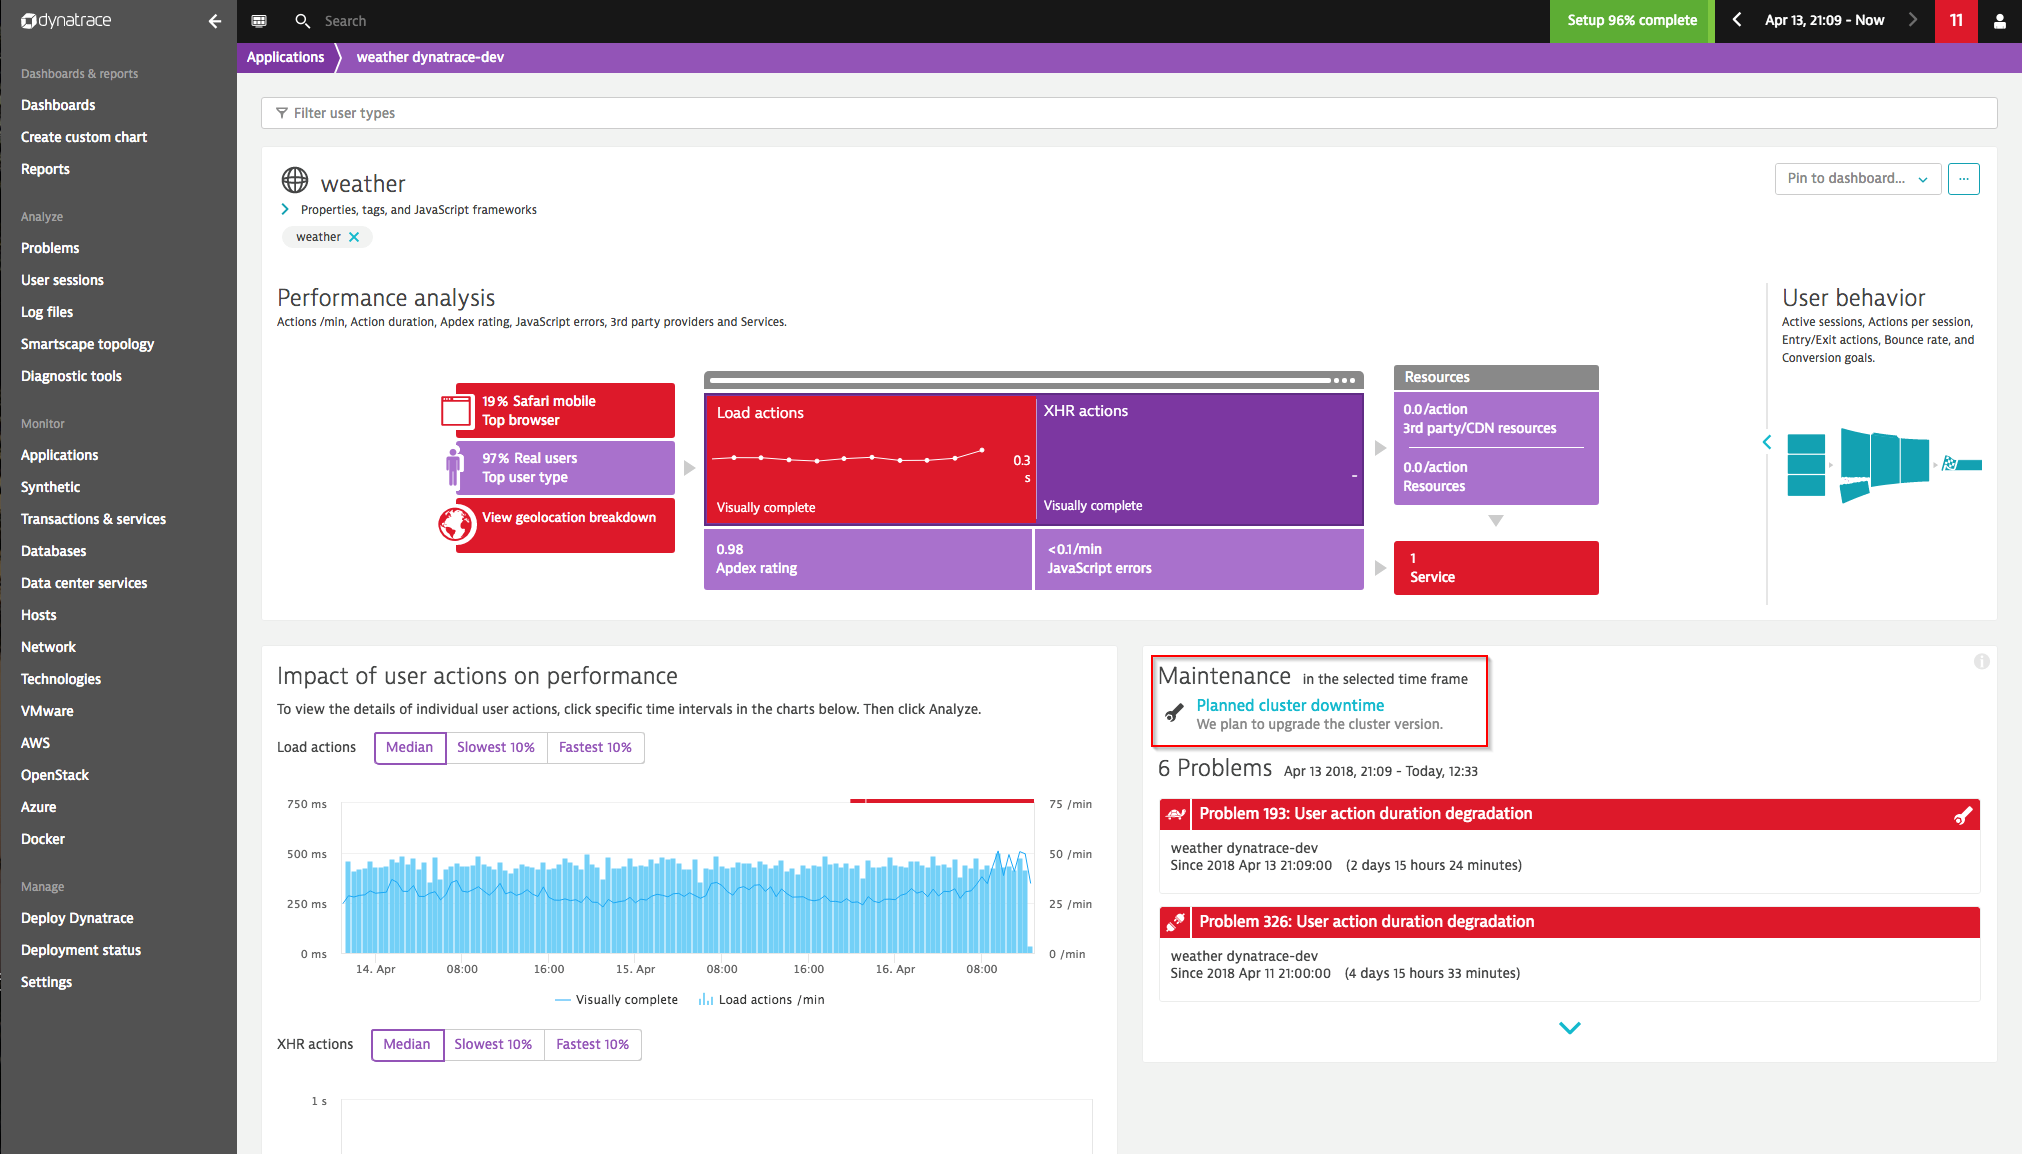
Even if you're viewing a host overview page and you select a global timeframe in which the selected host was under maintenance, DESK shows you the details on the Maintenance tile. If the host is included in multiple maintenance periods, DESK shows you the most recent window and a count of how many maintenance windows the host experienced during the selected timeframe.
Maintenance windows enable DESK to identify periods of possibly abnormal operation, such as downtimes, reduced performance periods, and high-traffic events during load tests. Defining maintenance windows during abnormal operation times helps you reduce alert spam and keep your baseline clean for accurate monitoring and alerting. By providing a convenient and powerful automation API your DevOps teams can automatically create or modify maintenance windows in sync with your release pipeline.