Visualize your environment topology through Smartscape
To access Smartscape, select Smartscape topology from the navigation menu. Smartscape can also be accessed from the default Smartscape tile on your DESK home dashboard. Your full technology stack, extending from your data centers up through the application layer, is displayed on the left.
Each Smartscape tier includes a health indicator and a dedicated tab (Data centers, Hosts, Processes, Services, and Applications). In the example image below, the 1/33 health status on the Hosts tier means that, of the 33 monitored hosts, 1 host is currently experiencing a problem. The other health indicators in this example display whole numbers, indicating that all the entities of these respective Smartscape tiers are healthy.
Note: Smartscape displays data from the past 72 hours and therefore can't be adjusted using the global timeframe selector. To view the dependencies among entities of the same tier, just click the associated tab on the left.
Applications
In the following example, the Applications tab is selected and the 12 detected applications in this environment are displayed on the right. There are no application connections or dependencies because, in DESK, applications are viewed from the perspective of the user and therefore only constitute user endpoints. Therefore, multiple applications may use the same services, but applications can't be connected directly to one another.
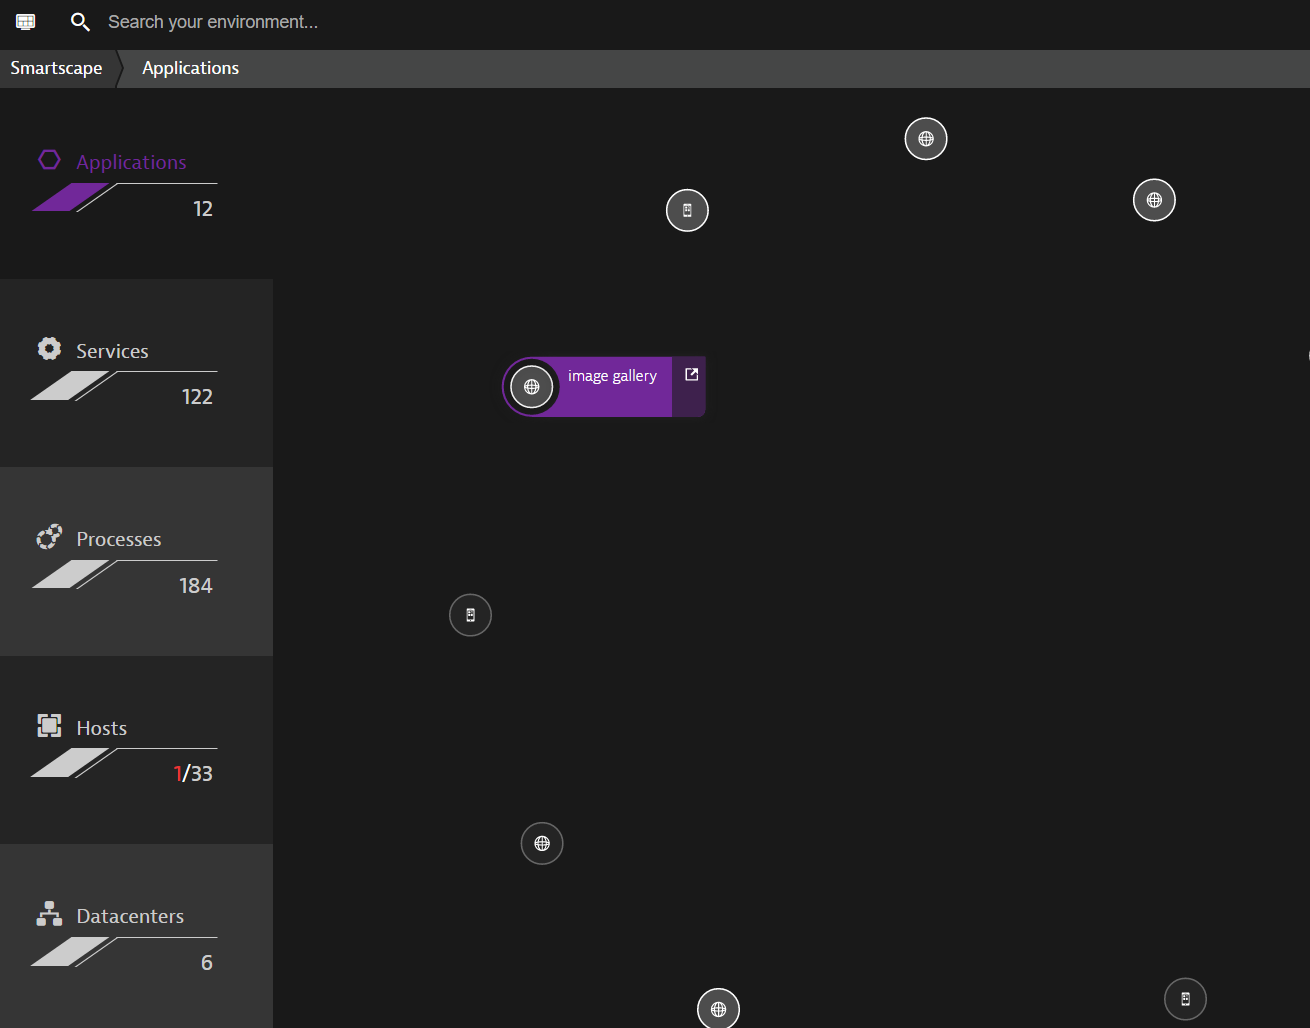
Use the +/- buttons at the top-right corner to zoom the view in/out. Click anywhere in Smartscape and hold down the mouse button to drag the view to different positions.
DESK supports monitoring of web-based applications and mobile apps. See the following table to understand the two entity symbols. If you hold your cursor over an application symbol, you can view the name of the application. If you click the small arrow next to the application’s name, you will be taken to that application's overview page.
| Symbol | Entity |
|---|---|
 |
Web application |
 |
Mobile app |
Services
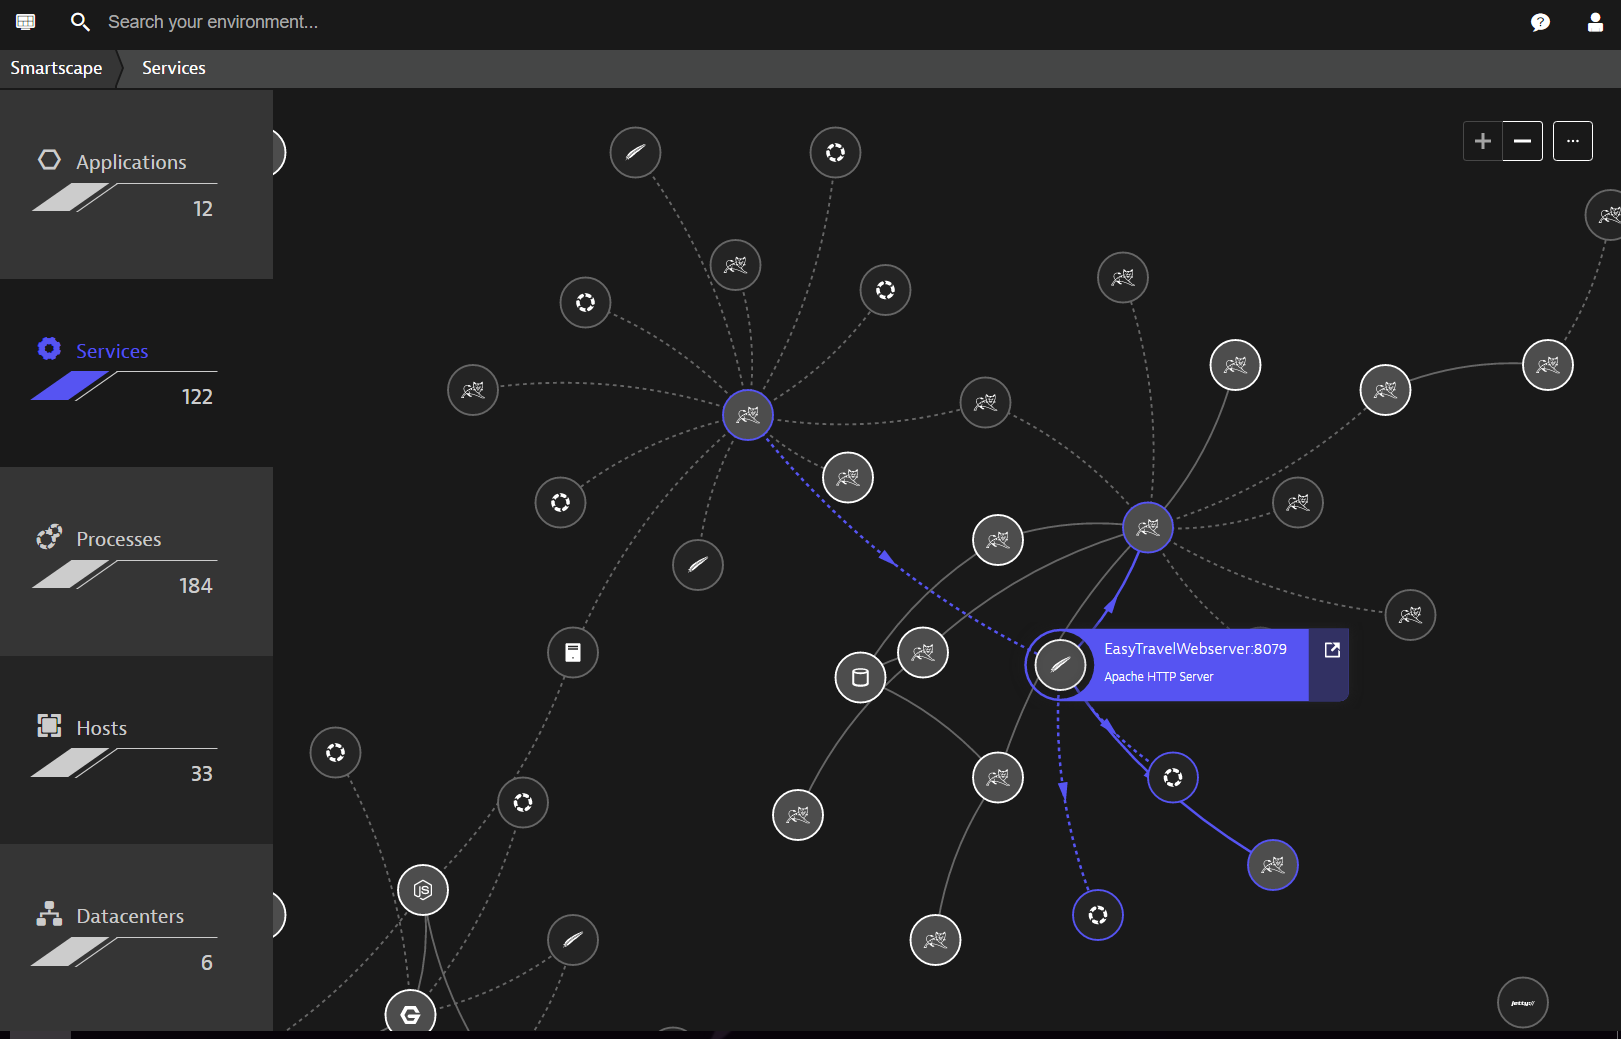
The Services tab displays the topology of all the services that are running in your environment. Each node represents a different service. Each service node is represented by a symbol that signifies the underlying service type. These symbols are the commercial logos of the respective service technologies supported by DESK.
Services of unrecognized technologies are depicted using a generic service symbol. These are typically opaque services.
| Symbol | Entity |
|---|---|
 |
Unrecognized or "opaque" service technology |
If you hold your cursor over a service node, you can view the name of the service. Click the small arrow next to the service’s name to navigate to the service's overview page. Note that the connections to and from the selected service are highlighted with arrows so that you can easily see if they are incoming or outgoing service calls.
If there hasn't been a request between two services during the last two hours, the respective connection between the services is illustrated with a dashed line. Likewise, if a service hasn't forwarded or received anything during the past 2 hours, the connection is represented with a dashed line. If a connection is inactive for more than 72 hours, the connection “ages out” and is no longer shown in Smartscape. The same is true for any service that hasn't received any load during the past 72 hours.
To hide/show inactive requests, click the Browse (…) button in the top right corner and choose Hide inactive. You can also use the Hide unconnected option to hide/show services that aren't connected to other services.
Note that you might observe a discrepancy in the number of services presented on the Services tab and the Transactions & services page. Smartscape takes into account a broader scope of service categories.
Processes
The Processes tab provides a visualization within which each node corresponds to a process and each connection represents a TCP/IP request. Not all processes running in your environment are shown because the number of running processes is often quite high. For clarity, only the most important processes are shown.
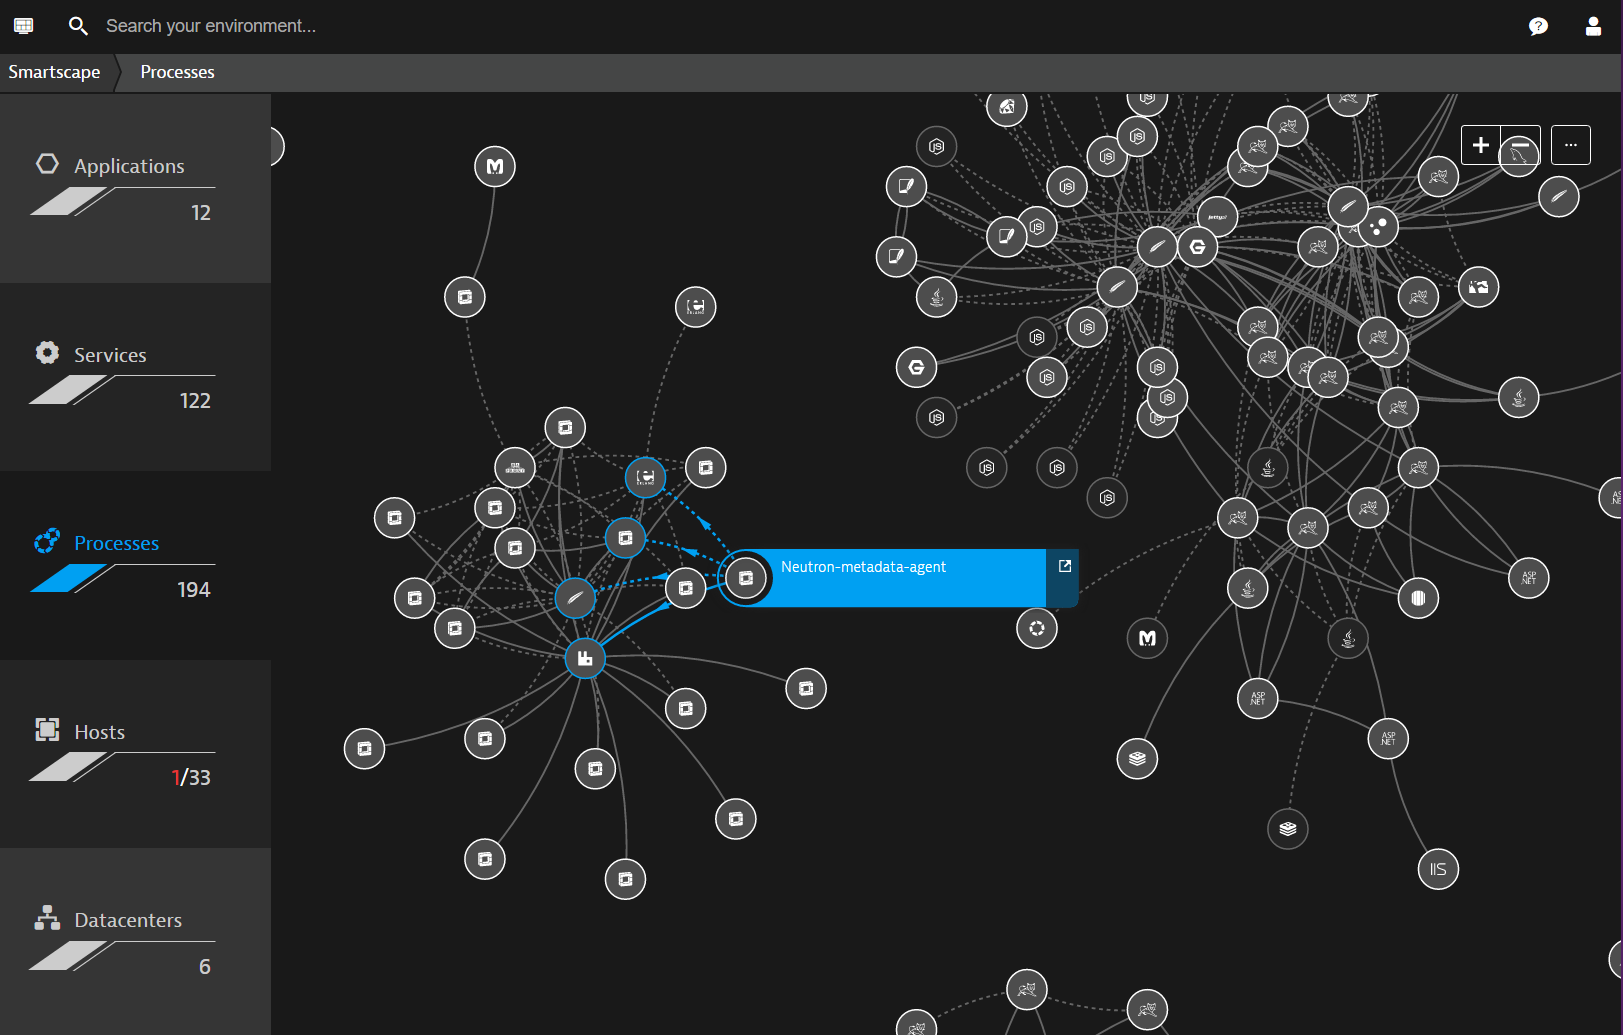
Hold your cursor over any process node to view the name of that process. Click the tiny arrow next to the process' name to navigate to that processes' overview page.
Connections between processes that are inactive or have timed out are depicted with dashed lines.
Hosts
The Hosts tab shows the topology of your infrastructure from the perspective of your hosts. The connections represent TCP/IP requests. Hosts, whether physical or virtual machines, are signified with the respective commercial logos of the host operating systems.
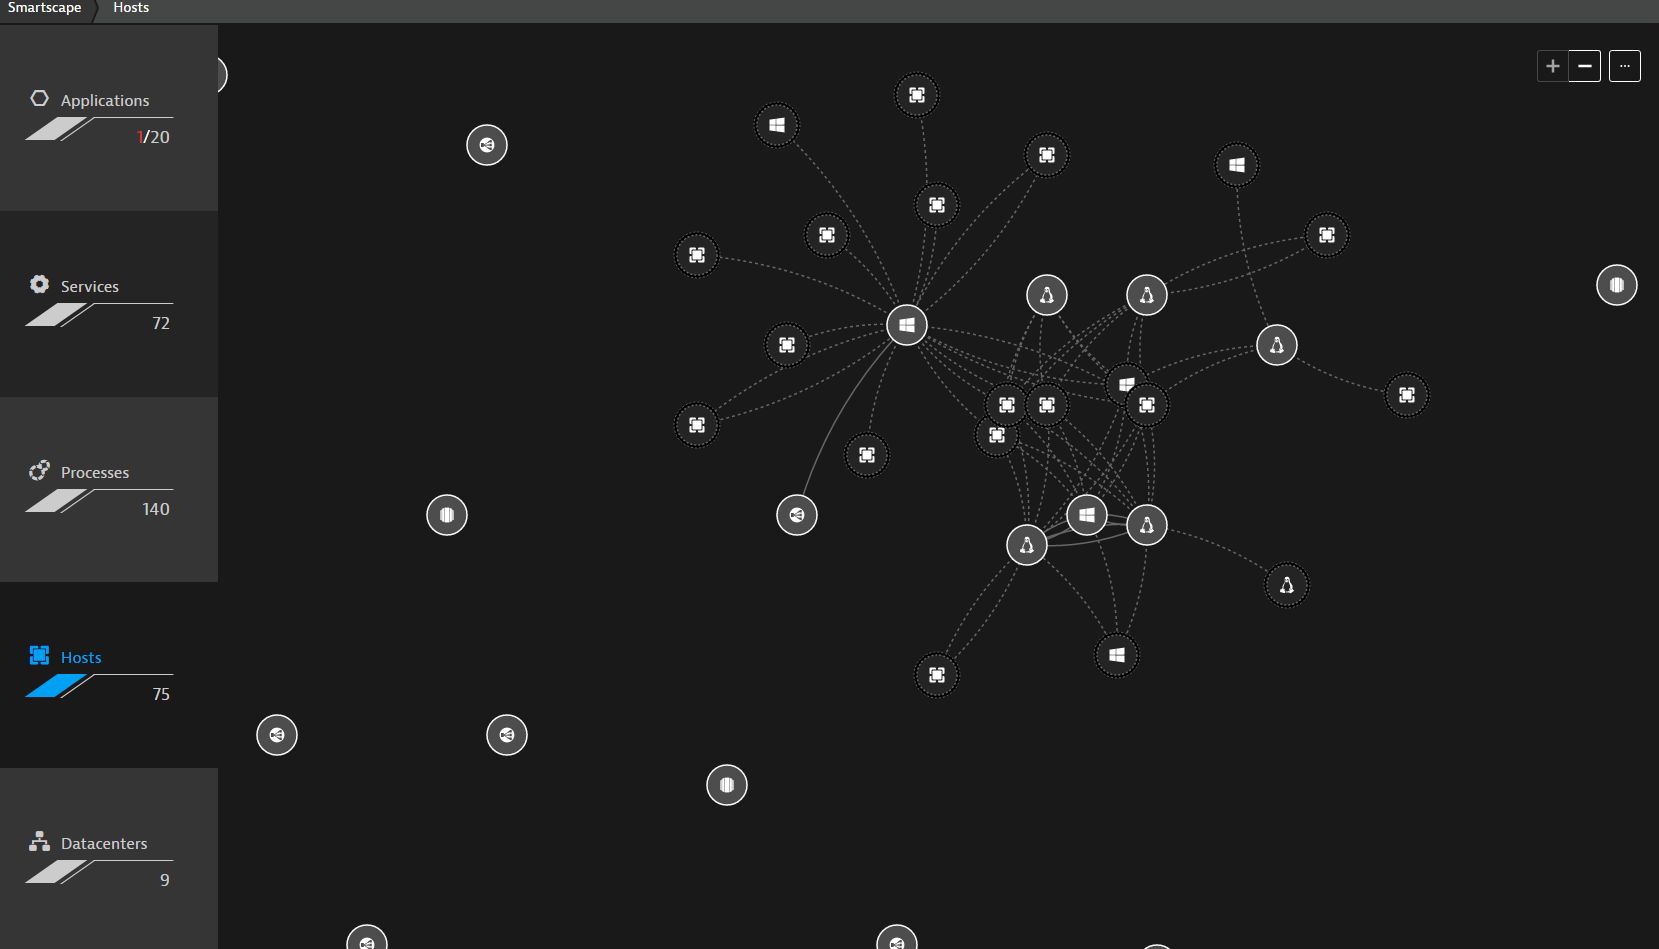
Generic host symbols are used to signify monitoring candidates (unknown hosts that are detected because they receive TCP/IP requests from monitored hosts). If possible, it's recommended that you install DESK OneAgent on monitoring candidates in your environment. To access the overview page of a host shown in Smartscape, click the arrow next to the host name.
| Symbol | Entity |
|---|---|
 |
monitoring candidate |
Inactive monitoring candidates are monitoring candidates that haven’t communicated with a host. Inactive connections between hosts and connections to timed-out hosts are visualized with dashed lines.
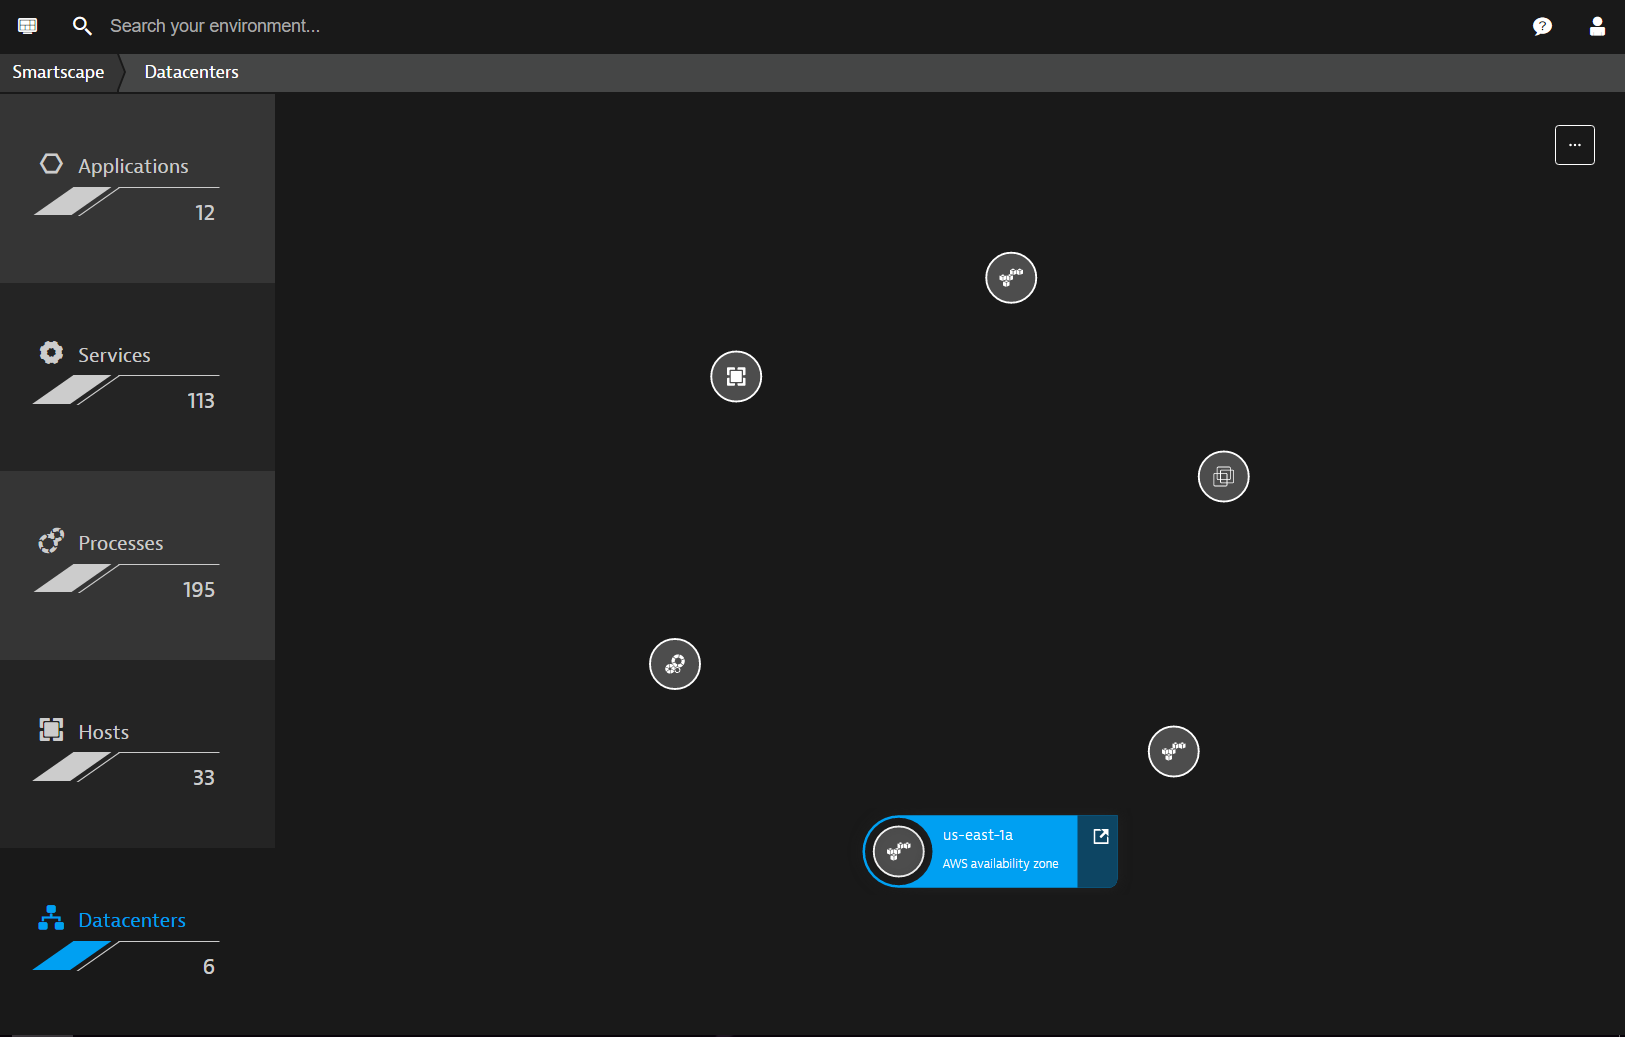
Data centers
The Data centers tab displays nodes that indicate where your hosts reside. If you have physical servers in your infrastructure, the corresponding data center nodes indicate the cities where the data centers are located. These are signified with generic host icons (see above).
If you use virtual servers or you have a PaaS-based infrastructure, the data center nodes will be labeled accordingly (for example, VMware data center, AWS Availability Zone, or Azure region) and visualized with the corresponding company logos.
Cross-tier interconnections
To view cross-tier connections, click any entity in any Smartscape tier. The vertical dependencies of the entity are then displayed on the left. A web application called easytravel-desk-dev is selected in the image below. On the left you can see how the application dependencies extend downward to the Data centers tier.
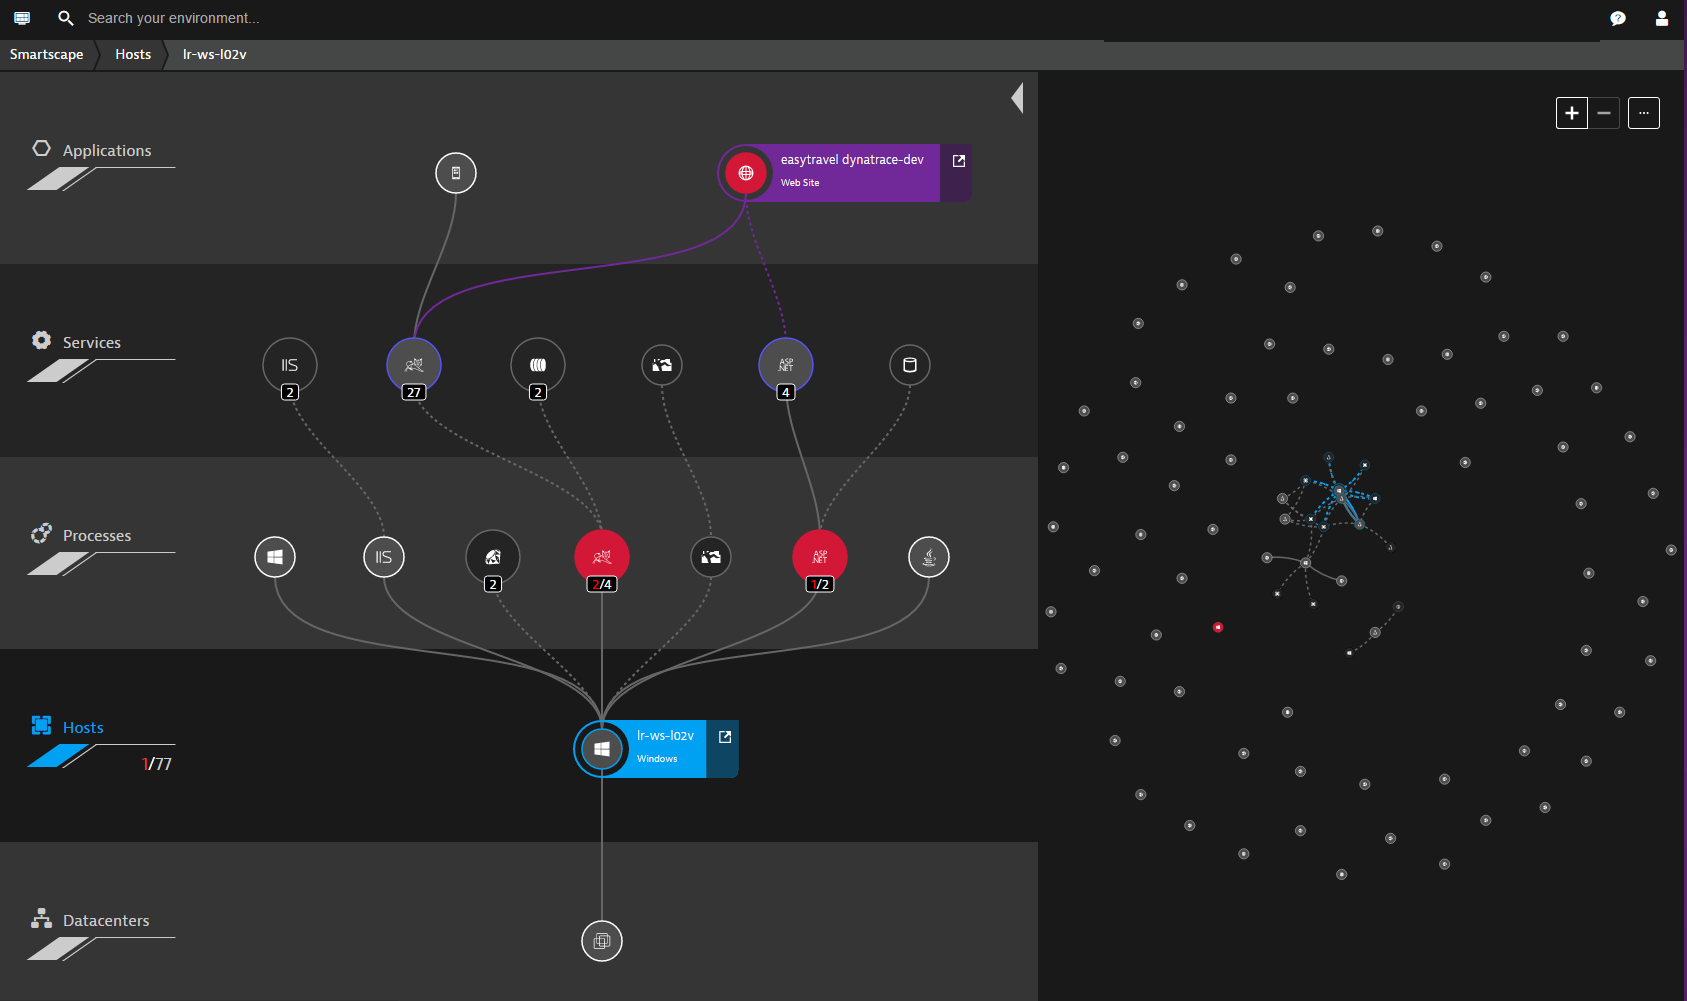
The easytravel-desk-dev application is depicted in red because it's experiencing a problem. Moving downward through the related dependencies, we can see that this application calls 27 Tomcat services and 4 ASP/.NET services. These services run on processes of the same technology types (those shown in red are experiencing problems). You can see that these processes reside on a Windows-based host called lr-ws-l02v (to see this detail, hold your cursor over the host node). Since the unhealthy processes are running on this host, this host is also unhealthy (note the red ‘1’ on the Hosts tile on the left).
This example reveals how you can easily discover the root cause of a problem and considerably reduce problem resolution time by exploring the related entities in Smartscape.