Improve database performance
Database access is a core feature of many applications. Simple database performance tuning can significantly speed up most applications. This topic explains practical steps you can take to use DESK to improve the performance of your databases.
Databases are sophisticated applications. To avoid failures or poor performance, it's important that your databases be hosted securely and resourced well enough to perform at their best.
You can optimize your databases with:
- Server data that supports host health monitoring
- Hypervisor and virtual machine metrics that support monitoring of your virtualization layer
- Application data that optimizes database access
- Network data that provides insight into the network impact of database communications
Step 1: Check the health of your database
The first step is to ensure that the host that's serving your database process has sufficient resources (CPU, memory, and disk space).
CPU
In most cases, the CPU isn't a bottleneck. However, database servers induce continuous base load on machines. To keep the host responsive, ensure that it has at least two CPU cores.
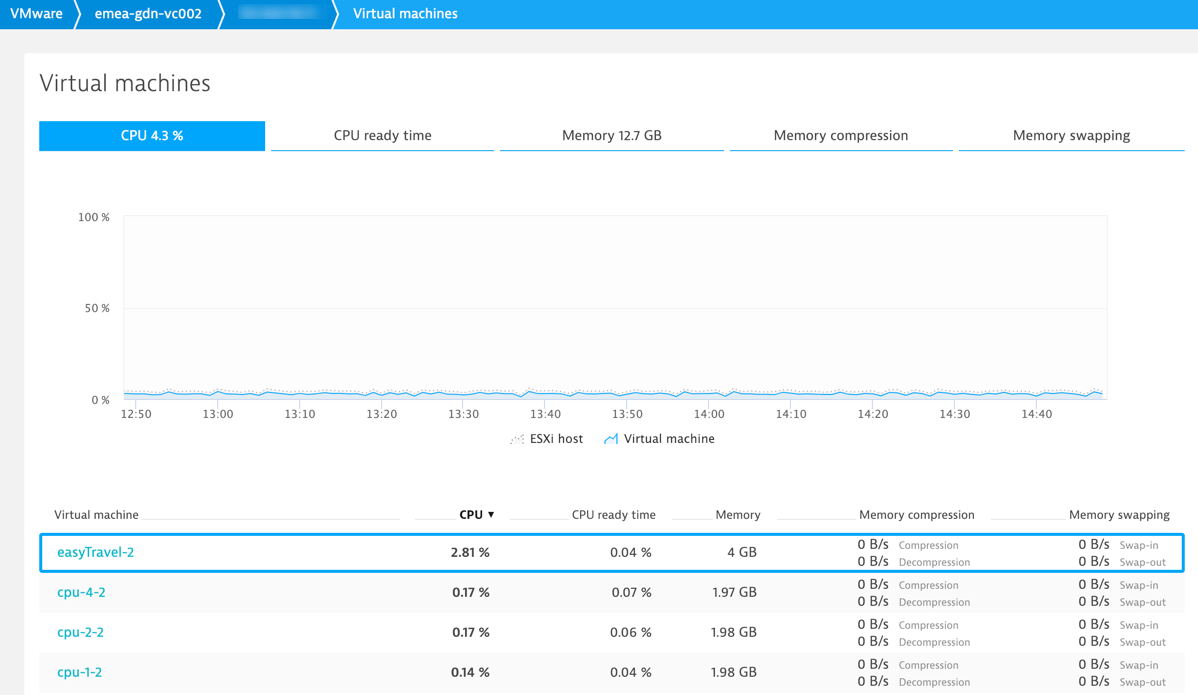
As a general rule of thumb, when virtual machines are monitored, the host that the virtual machines run on must also be monitored. CPU metrics of individual virtual machines don’t show the full picture—they can only tell you how much CPU time is available for each virtual machine to utilize.
Besides the technical implications, the number of CPUs also impacts database-server licensing. Ensure that your database server license matches your CPU count. Otherwise, you may overspend or be unable to fully leverage your hardware.
Memory
Memory usage isn't the only metric to keep an eye on because it doesn't tell you how much additional memory is required. The important number to look at is page faults per second.
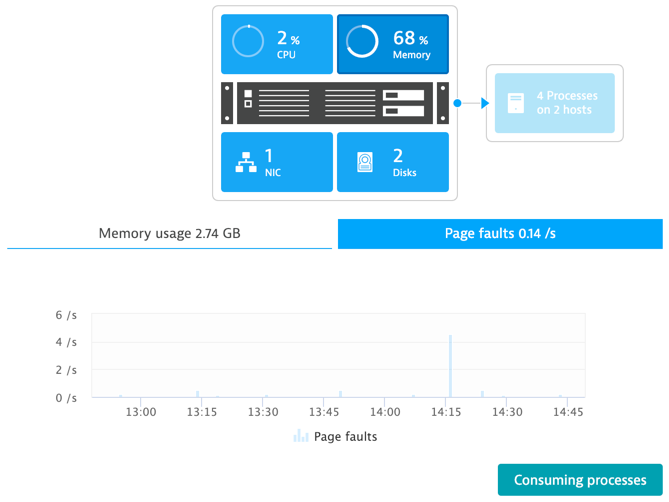
Having thousands of page faults per second indicates that your host is out of memory. Hint: You can hear your server’s hard drive grinding away when this happens.
Disk space
Because of indices and other performance improvements, databases use up a lot more disk space than what the actual data itself requires. NoSQL databases, such as Cassandra and MongoDB, consume a lot more disk space than expected. And while MongoDB might take up less RAM than a common SQL database, it consumes a lot of disk space.
Ensure that you have lots of storage available for your database server. Also, ensure that your database runs on dedicated hard drives so that there is minimum disk fragmentation caused by other processes.
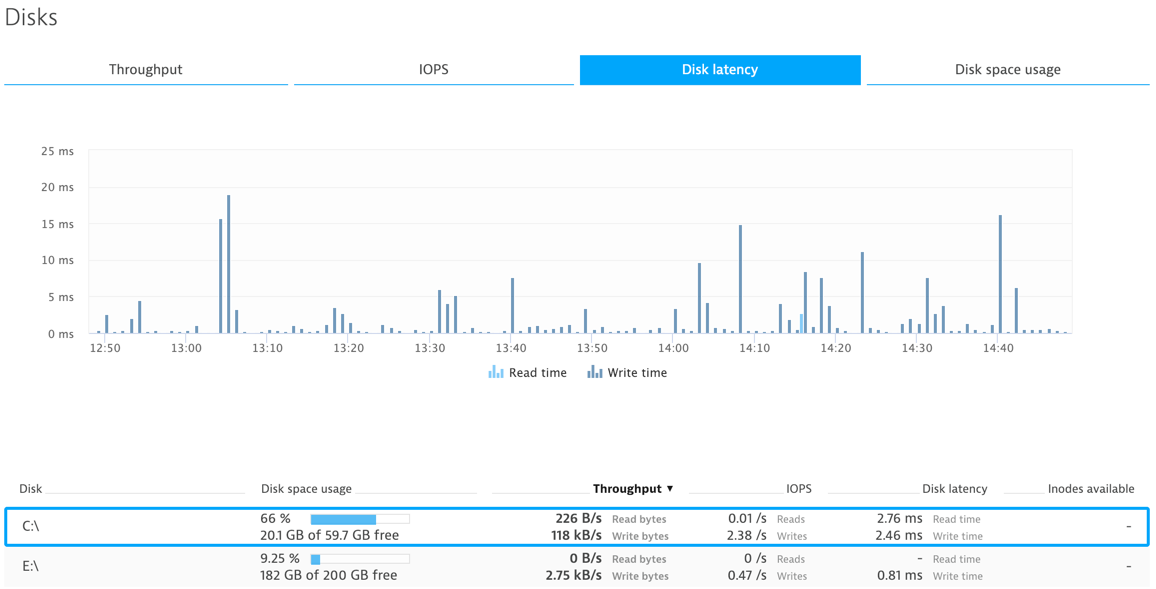
Also check disk latency. Depending on hard drive load, disk latency will increase, leading to a decrease in database performance. To avoid this, leverage your application’s and database’s caching mechanisms as much as possible.
If this fails to yield the expected result, add additional hard drives. Read performance can be multiplied by simply mirroring hard drives. Write performance benefits from using RAID 1 or RAID 10 instead of RAID 6.
If this still doesn’t help, try solid state drives. Ensure that you select a model that’s designed for database usage, as databases apply more read/write cycles to storage than most common applications. While these are more expensive than traditional hard disks, they do offer a substantial boost in performance.
Step 2: Understand how your database is accessed
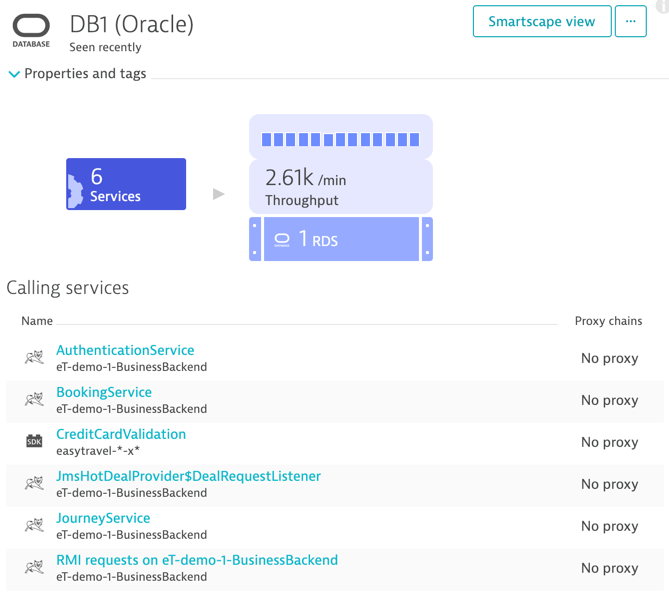
Once your database resides on healthy hardware, take a look at the applications that access it. If you know of an application or service that has bad database performance, don’t assume that it's the application that's affecting the performance of your database—it may be another application or service entirely.
There are two categories of inferior database performance:
- The entire database is affected
- A single client is experiencing poor performance
If all clients experience bad performance, check if the host is healthy. In most cases, the cause is hardware that isn't capable of handling the work. If there’s only a single service that’s suffering from poor response times, dig deeper into the service’s metrics to find out the root cause of the problem.
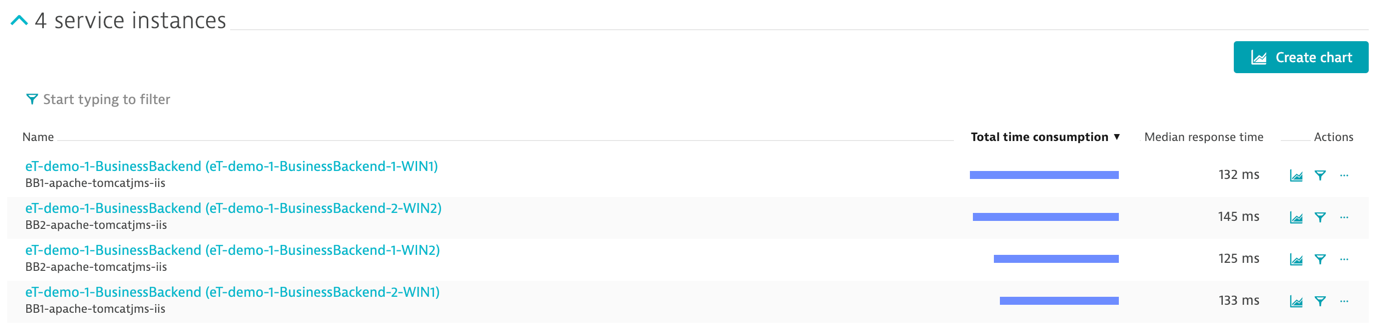
Step 3: Understand the load and individual response time of each service instance
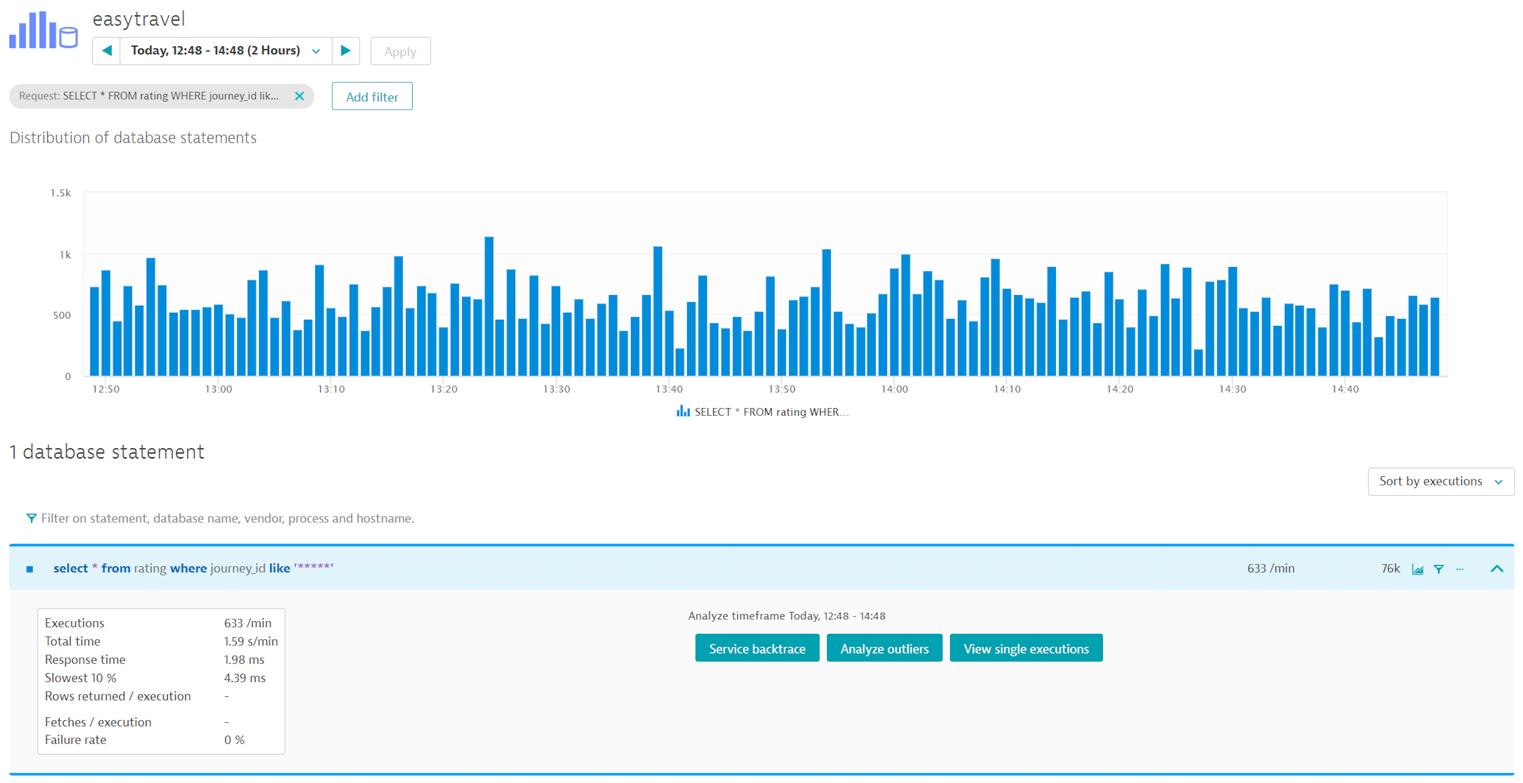
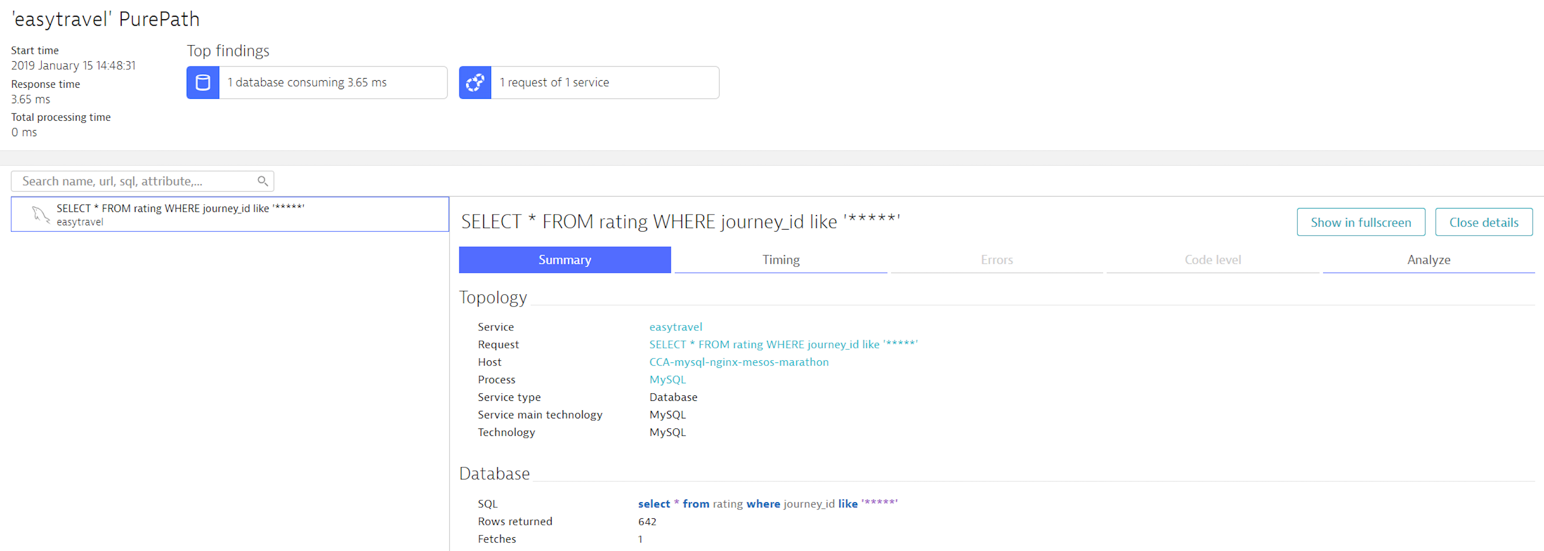
If a service has poor database performance, look at its communication with the database. Look at the executed queries, how often the queries are executed per request, the number of rows each query returns, and so on.
If you're running multiple instances of a service, check if all the instances are affected or if it's only a single instance of the service.
Issues that materialize on the database level are oftentimes rooted elsewhere. In most cases, issues relate to the way a database is accessed.
Check how often the queries are called per request. You may be able to reduce the number of actual database queries by improving the database cache of your service. If a single query is executed more than once per request, you can unlock potential performance by applying smart caching strategies.
Step 4: Check the number of database connections
Even if the way you query the database is perfectly fine, you may continue to face inferior database performance. In such a case, check that the application’s database connection is correctly sized.
When configuring a connection pool, consider the following:
- The maximum number of connections the database can handle
- The correct size connection pool required for the application
Because your application may not be the only client connected to the database, ensure that the connection pool size isn't set to the maximum. If the application takes up all the connections, the database server won’t perform as expected.
Determine the maximum number of connections
The maximum number of connections to the database is a function of the resources on the database. To find the maximum number of connections, gradually increase the load and the number of allowed connections to your database.
While doing this, keep an eye on your database server’s metrics: CPU, memory, and disk performance. Once any of these maxes out, you’ve reached the limit. If the number of available connections isn't enough for your application, consider upgrading your hardware.
Determine the correct size for your application's connection pool
The number of allowed concurrent connections to your database is equivalent to the amount of parallel load that your application applies to the database server. There are certain tools that you can use to determine the right number.
Increasing the load leads to higher transaction response times, even if your database server is healthy. Measure the transaction response time from end-to-end to see if Connection acquisition time increases under heavy load. If that's the case, your connection pool may be exhausted. If not, review your database server metrics to determine the maximum number of connections that your database can handle.
A connection pool’s size should be constant. Therefore, set the minimum and maximum pool sizes to the same value.
Step 5: Check your network
Remember the physical constraints of your virtualized infrastructure: cables can fail and routers can break. Check your network metrics. If problems appear after months or even years of flawless operation, it may be that your infrastructure is suffering from a non-virtual, physical problem. Check your routers, cables, and network interfaces.
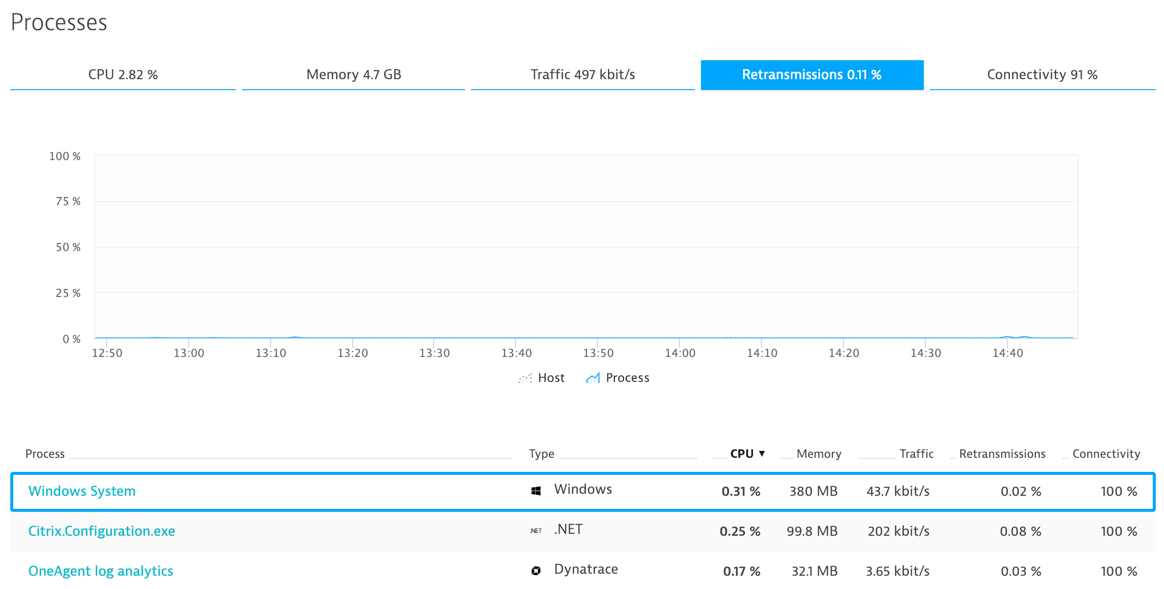
Most often, over-stressed processes start dropping packets when resources are depleted. If your network issue isn't a hardware problem, process-level visibility will help you in identifying any failing component.