Analyze individual service instances
DESK offers the ability to detect clustered services. Clustered services are services that are served via multiple processes. DESK enables you to analyze the load distribution, response time distribution, and failure rates of each individual service instance.
To view service instances
- Select Transactions & services in the navigation menu.
- Select the clustered service you want to analyze.
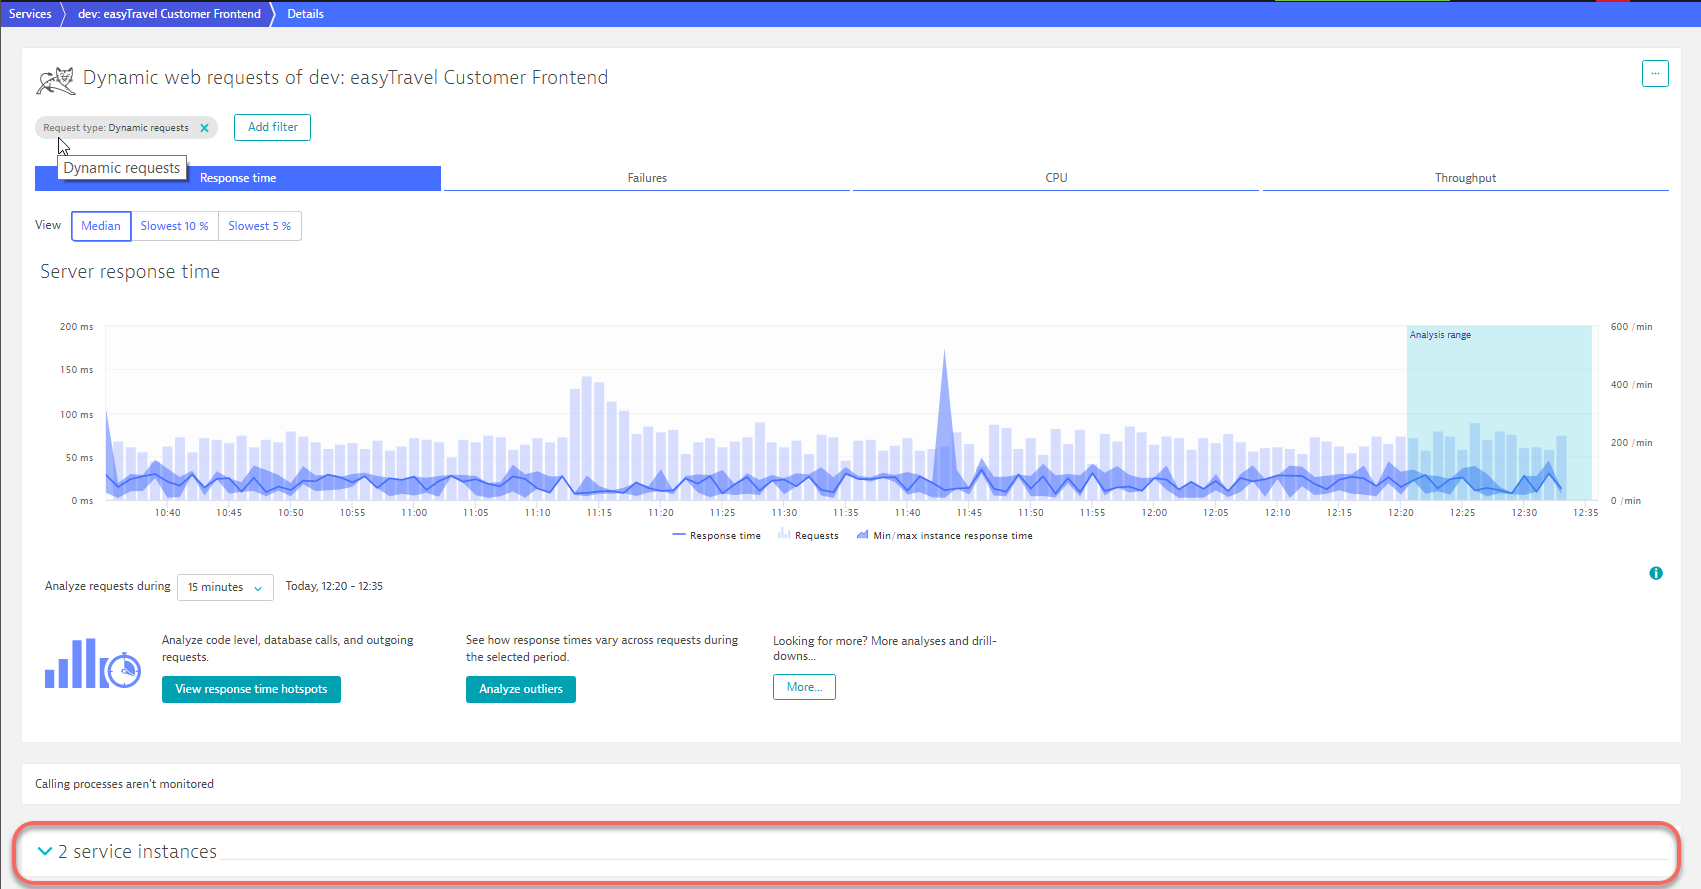
- On the service overview page, click the View... button (View requests, View dynamic web requests, or View resources).
- Scroll down and expand the Service instances section to view the details.
- Click the service instance you want to analyze. See further details below.
Analyze service-instance metrics
The Service instances section includes an entry for each instance of this service that currently exists (or that did exist during the analysis timeframe). For each instance, you can see the cluster node that the instance runs on (included beneath the service instance name), the instance's Total time consumption, as well as the Median response time.
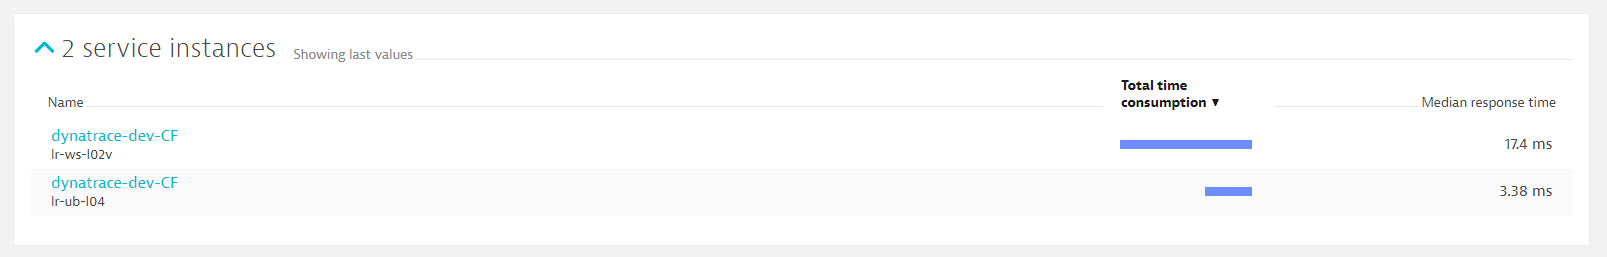
In the example above, note the variation of total time consumption and median response time across the service instances. This means that the load isn’t distributed equally across all cluster nodes.
Click an individual service instance to display instance-specific Response time, Failure rate, CPU consumption, and Throughput. This enables you to understand if a spike in the overall service response time is occurring on all instances or only on a single instance. Note that the name of the specific instance appears as a filtering criterion.
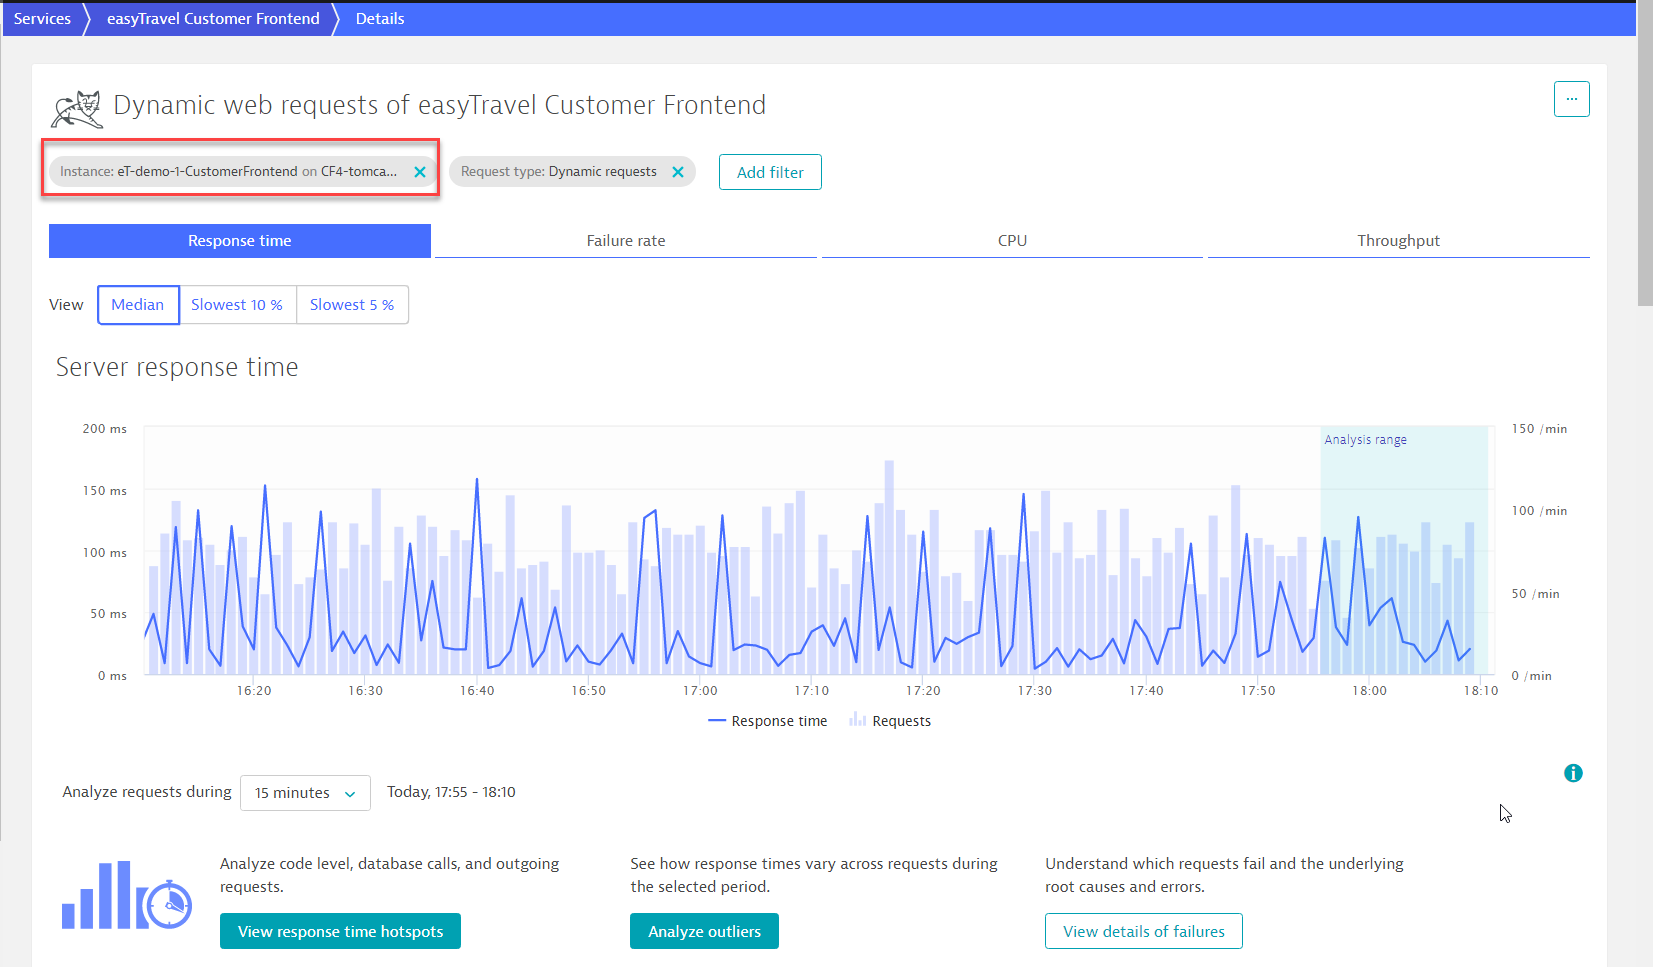
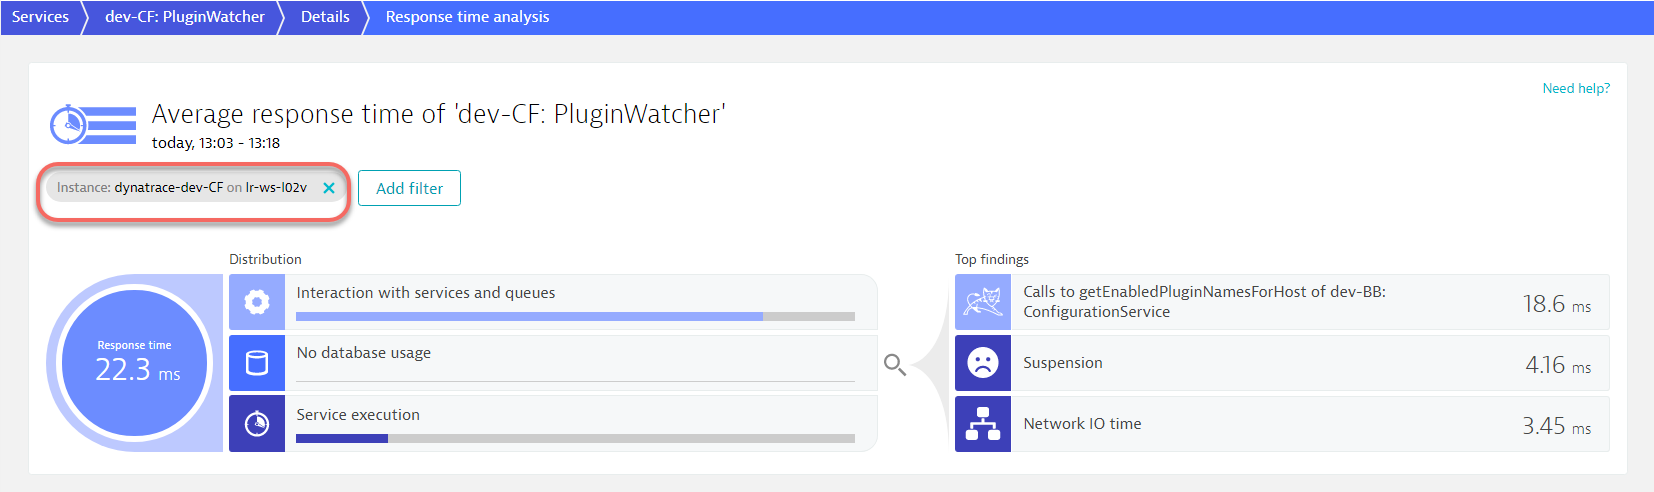
Click View response time hotspots to further investigate the differences in response time between nodes. The example below shows response time analysis for a single instance. Note the node name of the instance is presented beneath the page title in the form of a filter.
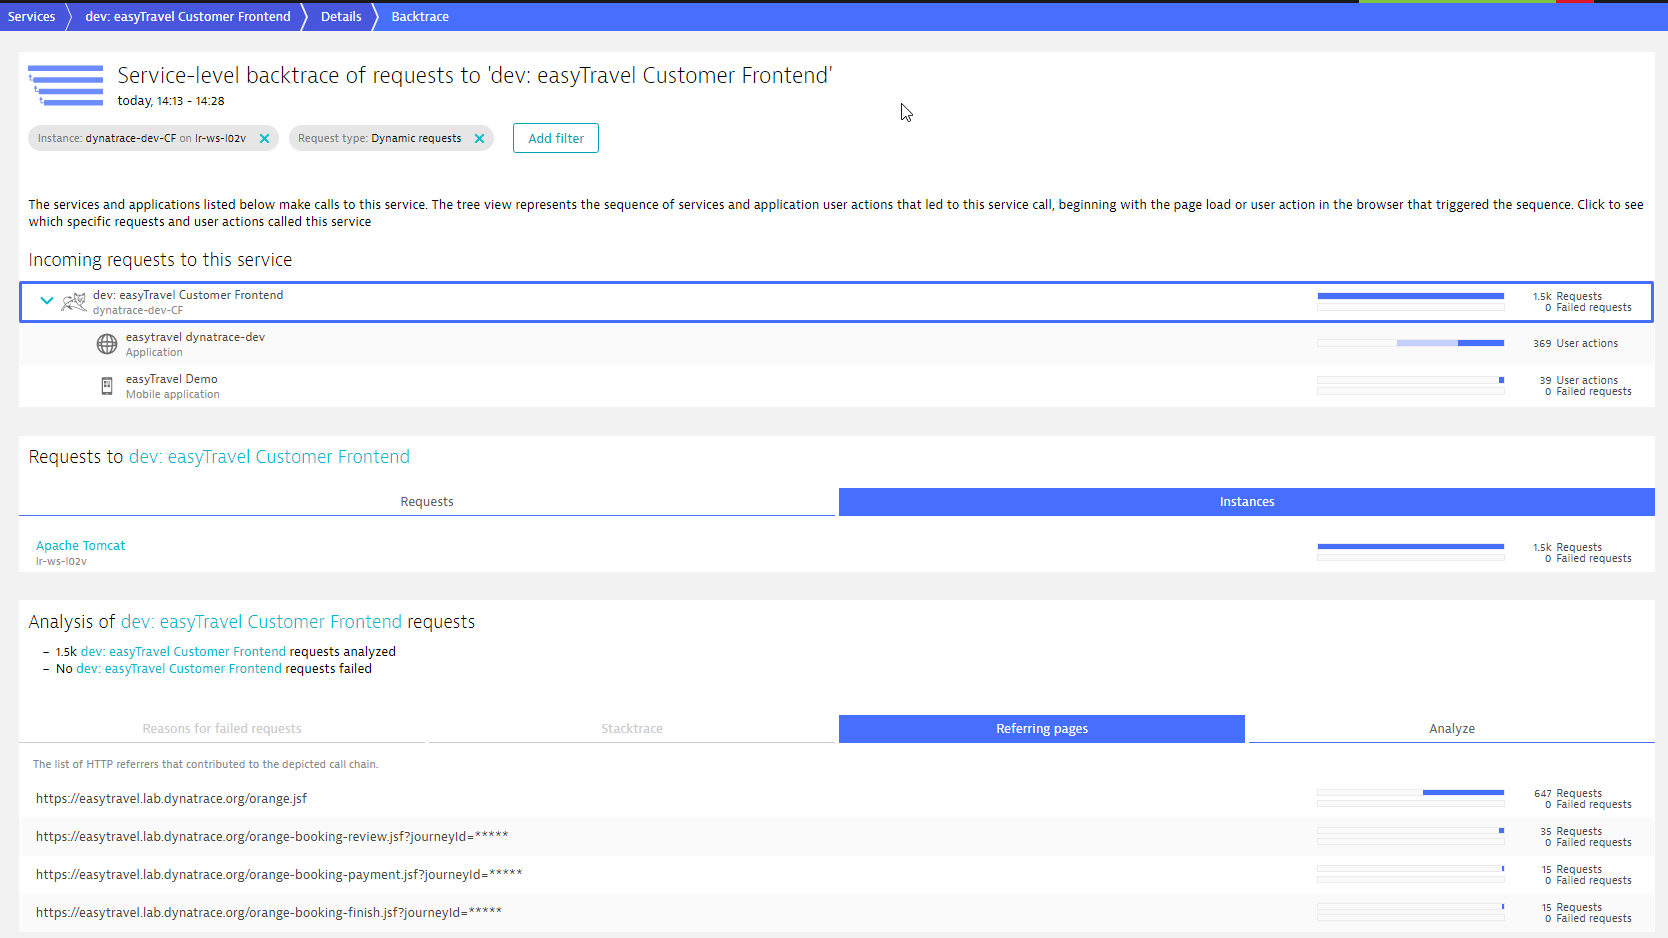
See which instances make calls to other services
Another interesting bit of insight you get with service-instance analysis is detail about the specific instances that particular calls originates from. Just click Analyze backtrace on any service instance page. Backtrace analysis provides an instance breakdown for each service. Notice the Instances tab in the example below.