Source map support for JavaScript error analysis
JavaScript source maps provide immediate access to all the details of detected JavaScript errors, making it easy for you to analyze, reproduce, and fix JavaScript errors faced by the users of your application.
To improve performance, JavaScript is transformed when it's deployed into production within web applications.
The following image depicts a minified JavaScript file:
While this approach does improve performance, the disadvantage is that transformed JavaScript sources aren't human-readable. This makes them difficult to debug. DESK source maps can be used to map these transformed JavaScript files back to their original sources so that they can be read easily and debugged.
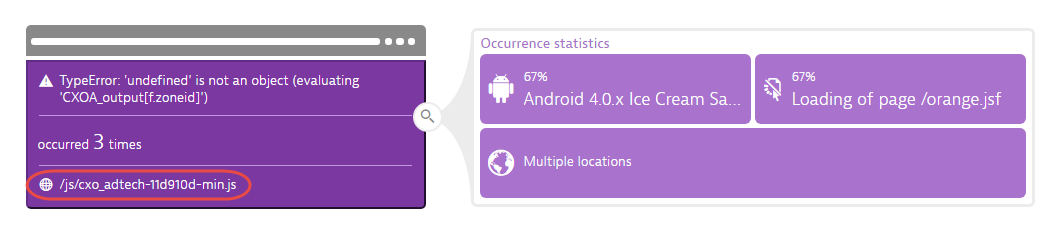
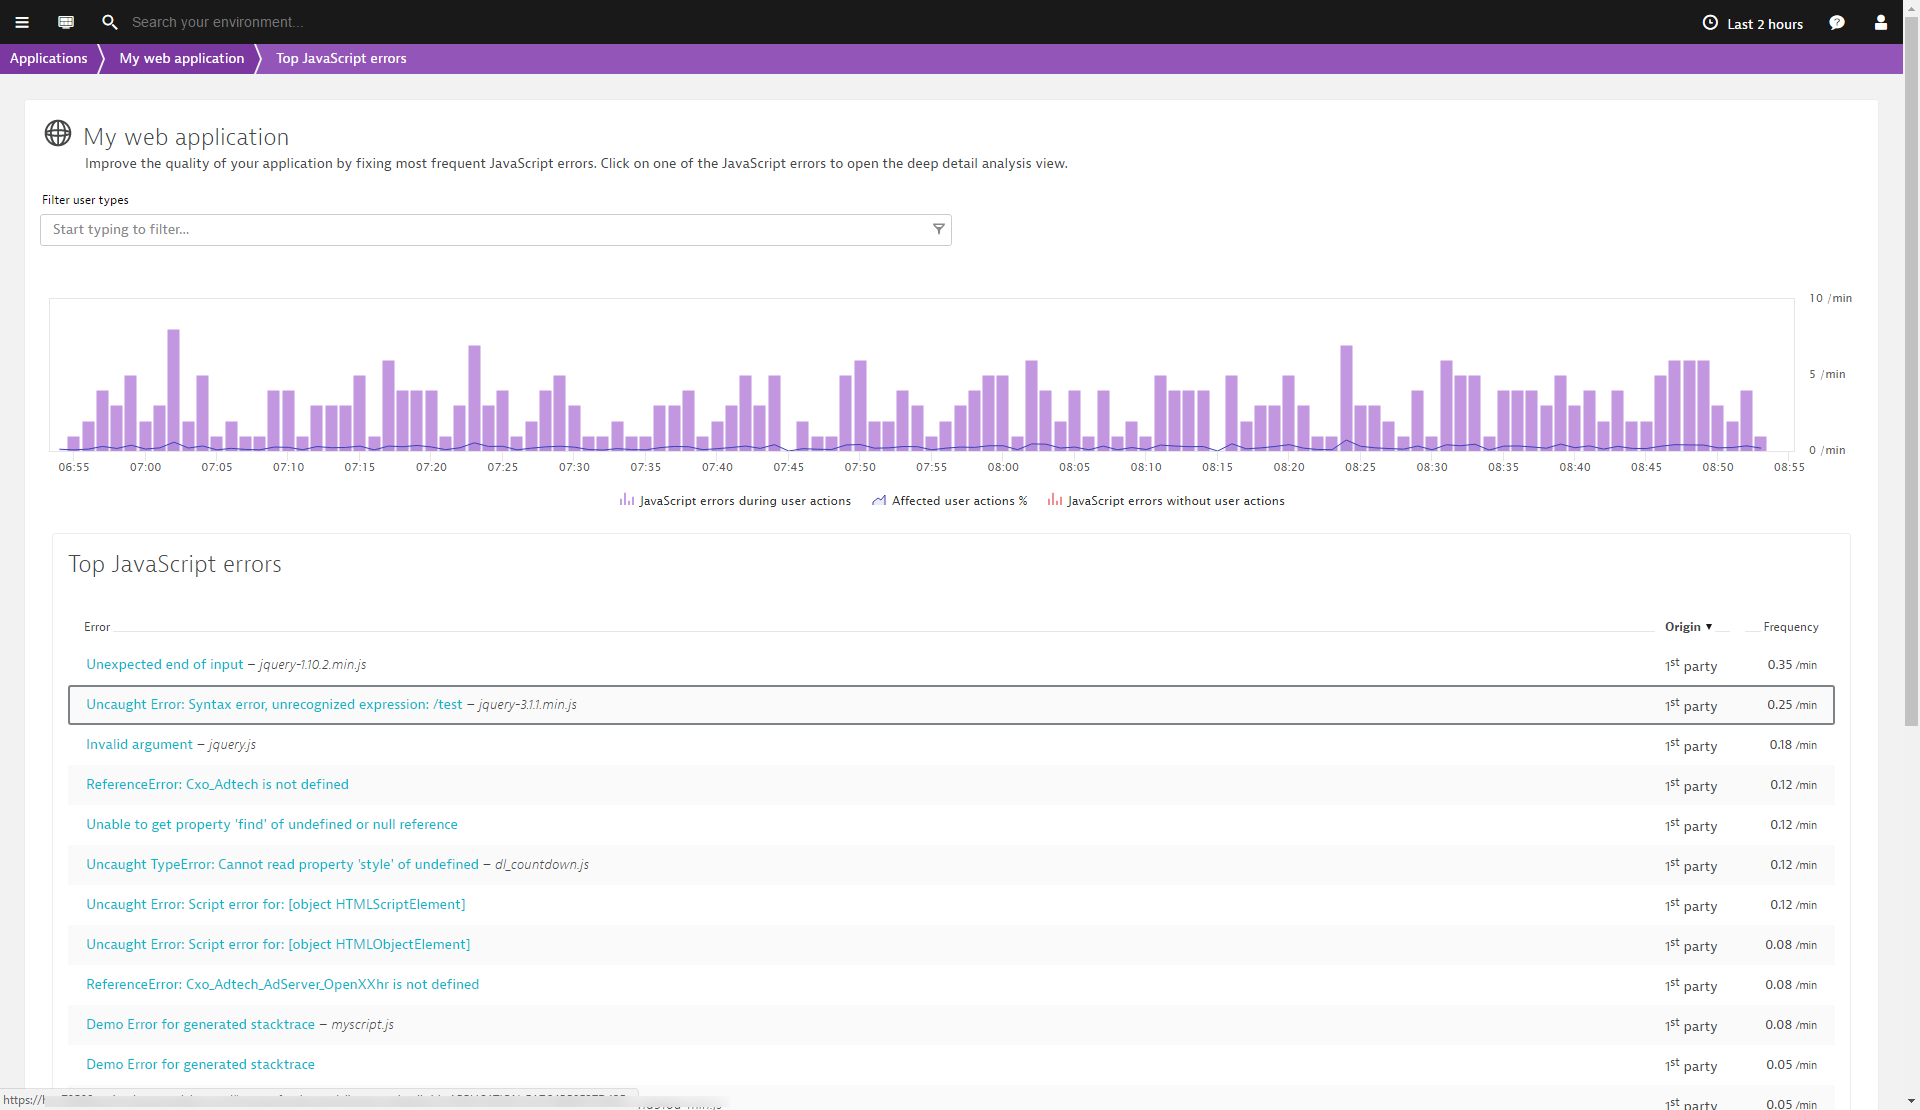
Javascript error detection and automated analysis is crucial for improving your application's real user experience. DESK intelligently groups JavaScript errors, displays their Frequency, Origin (1st or 3rd party), and the number of user actions affected by each error.
Analyze a JavaScript error using a source map
-
From the navigation menu, select Applications.
-
On the Applications page, select the application that you want to analyze.
-
Click the Errors section of the infographic to view the top JavaScript errors.
-
Click Analyze errors.
-
From the list of Top JavaScript errors, click the error that you want to analyze.
-
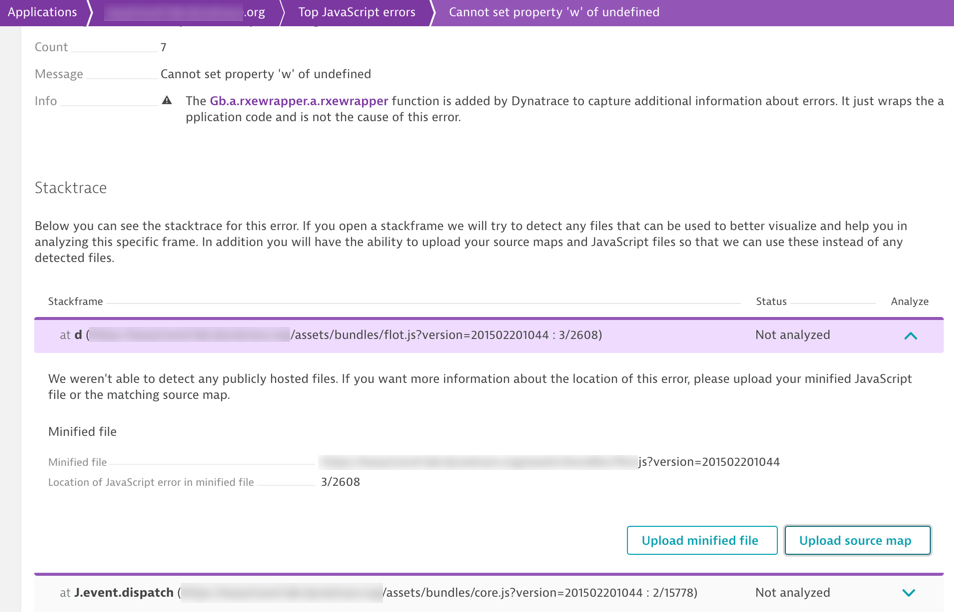
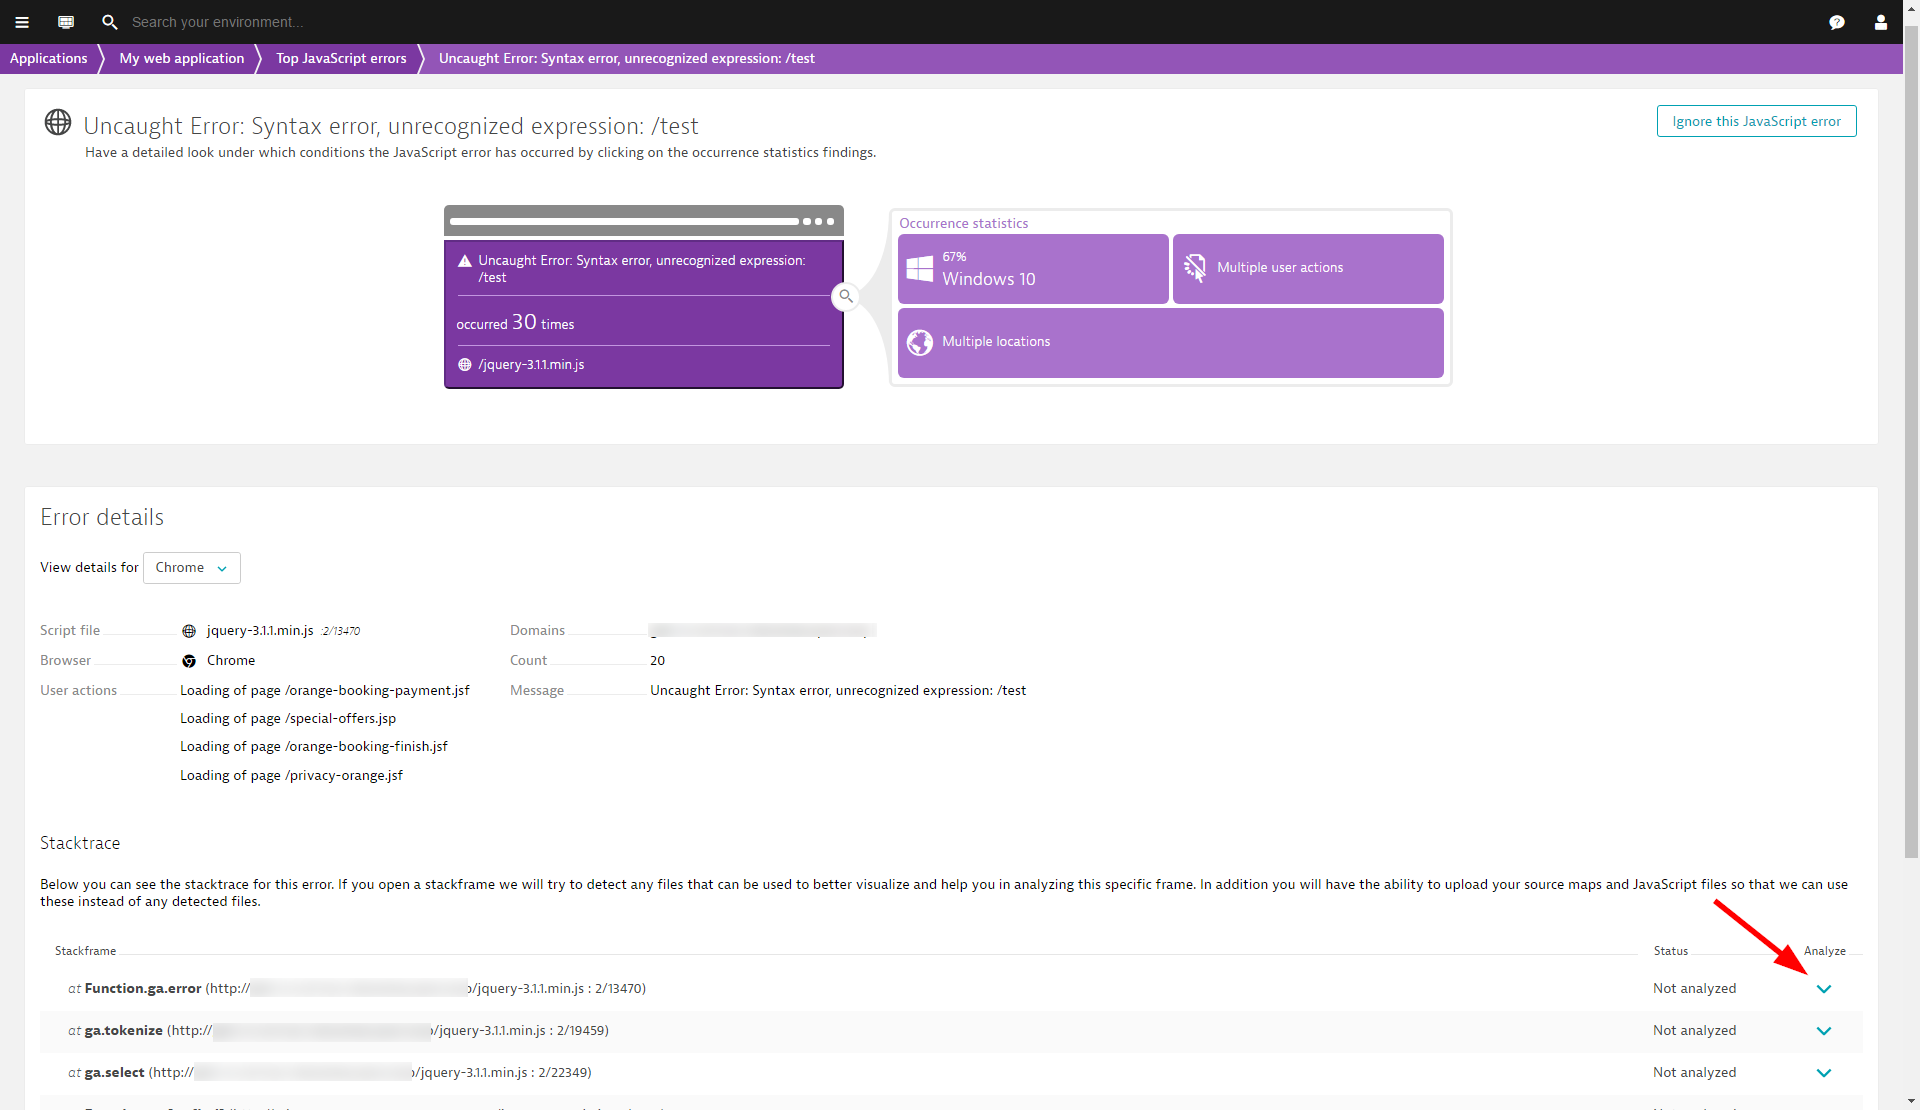
In the Error details section, you can view the corresponding stack trace of the error. Error details are grouped by browser type. Individual stack frames have the Not analyzed status.
-
To open stack frames for analysis, click the corresponding Analysis expand buttons.
-
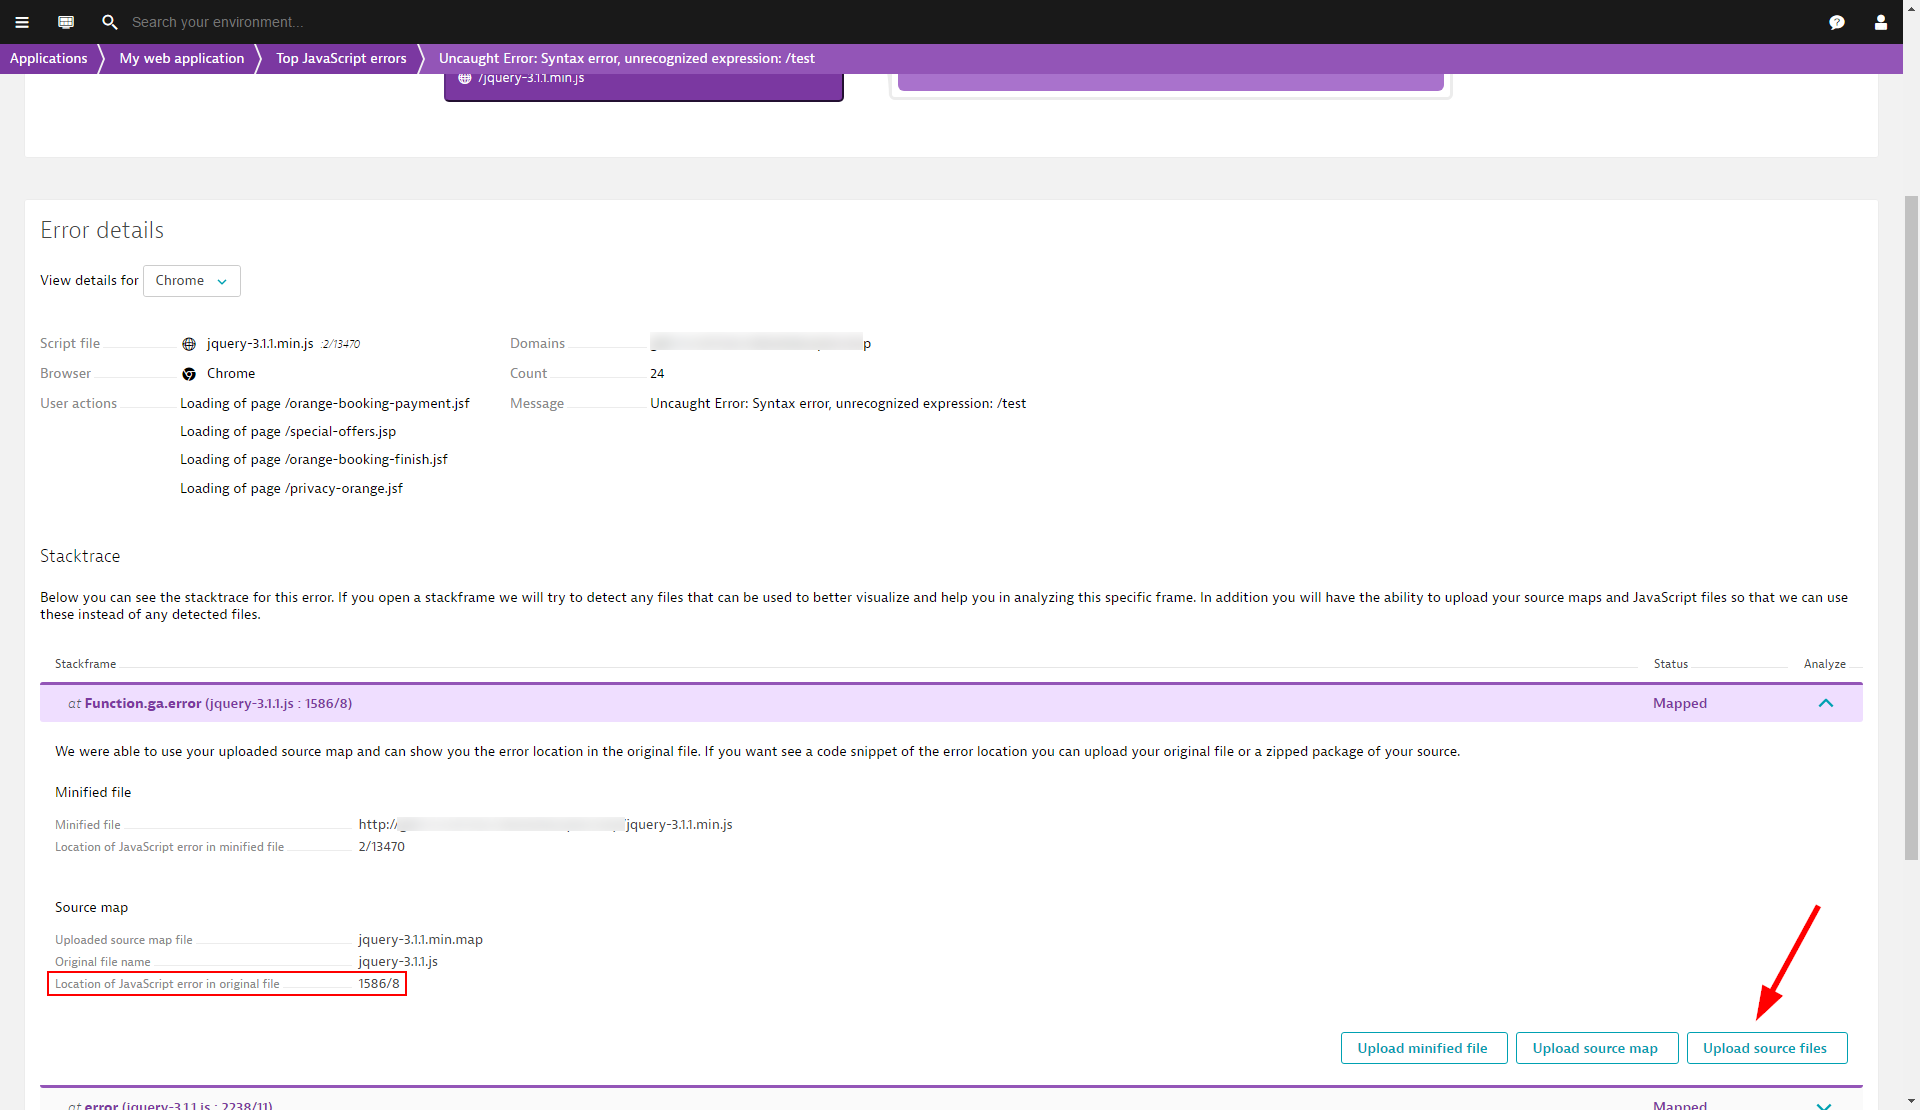
DESK attempts to automatically fetch available source maps related to the error. When a source map is found, the origin of the detected source map and the location of the error in the original JavaScript file is highlighted. If the source map isn't detected, click the Upload source map button and manually upload the corresponding source map.
-
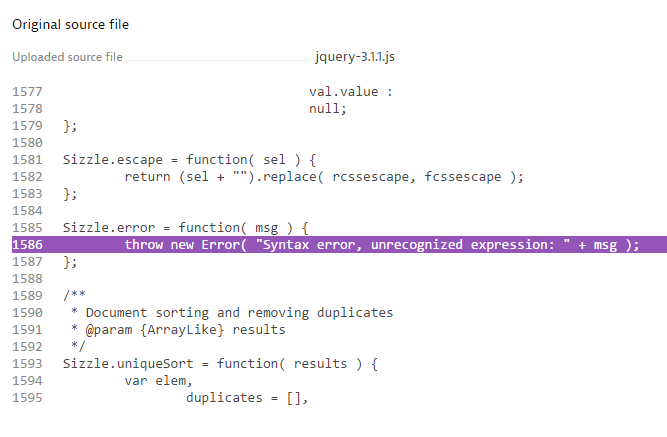
In most cases, the source maps include the original JavaScript code and you can see the stack trace with the line of code that generated the error highlighted. The following image is one such example.
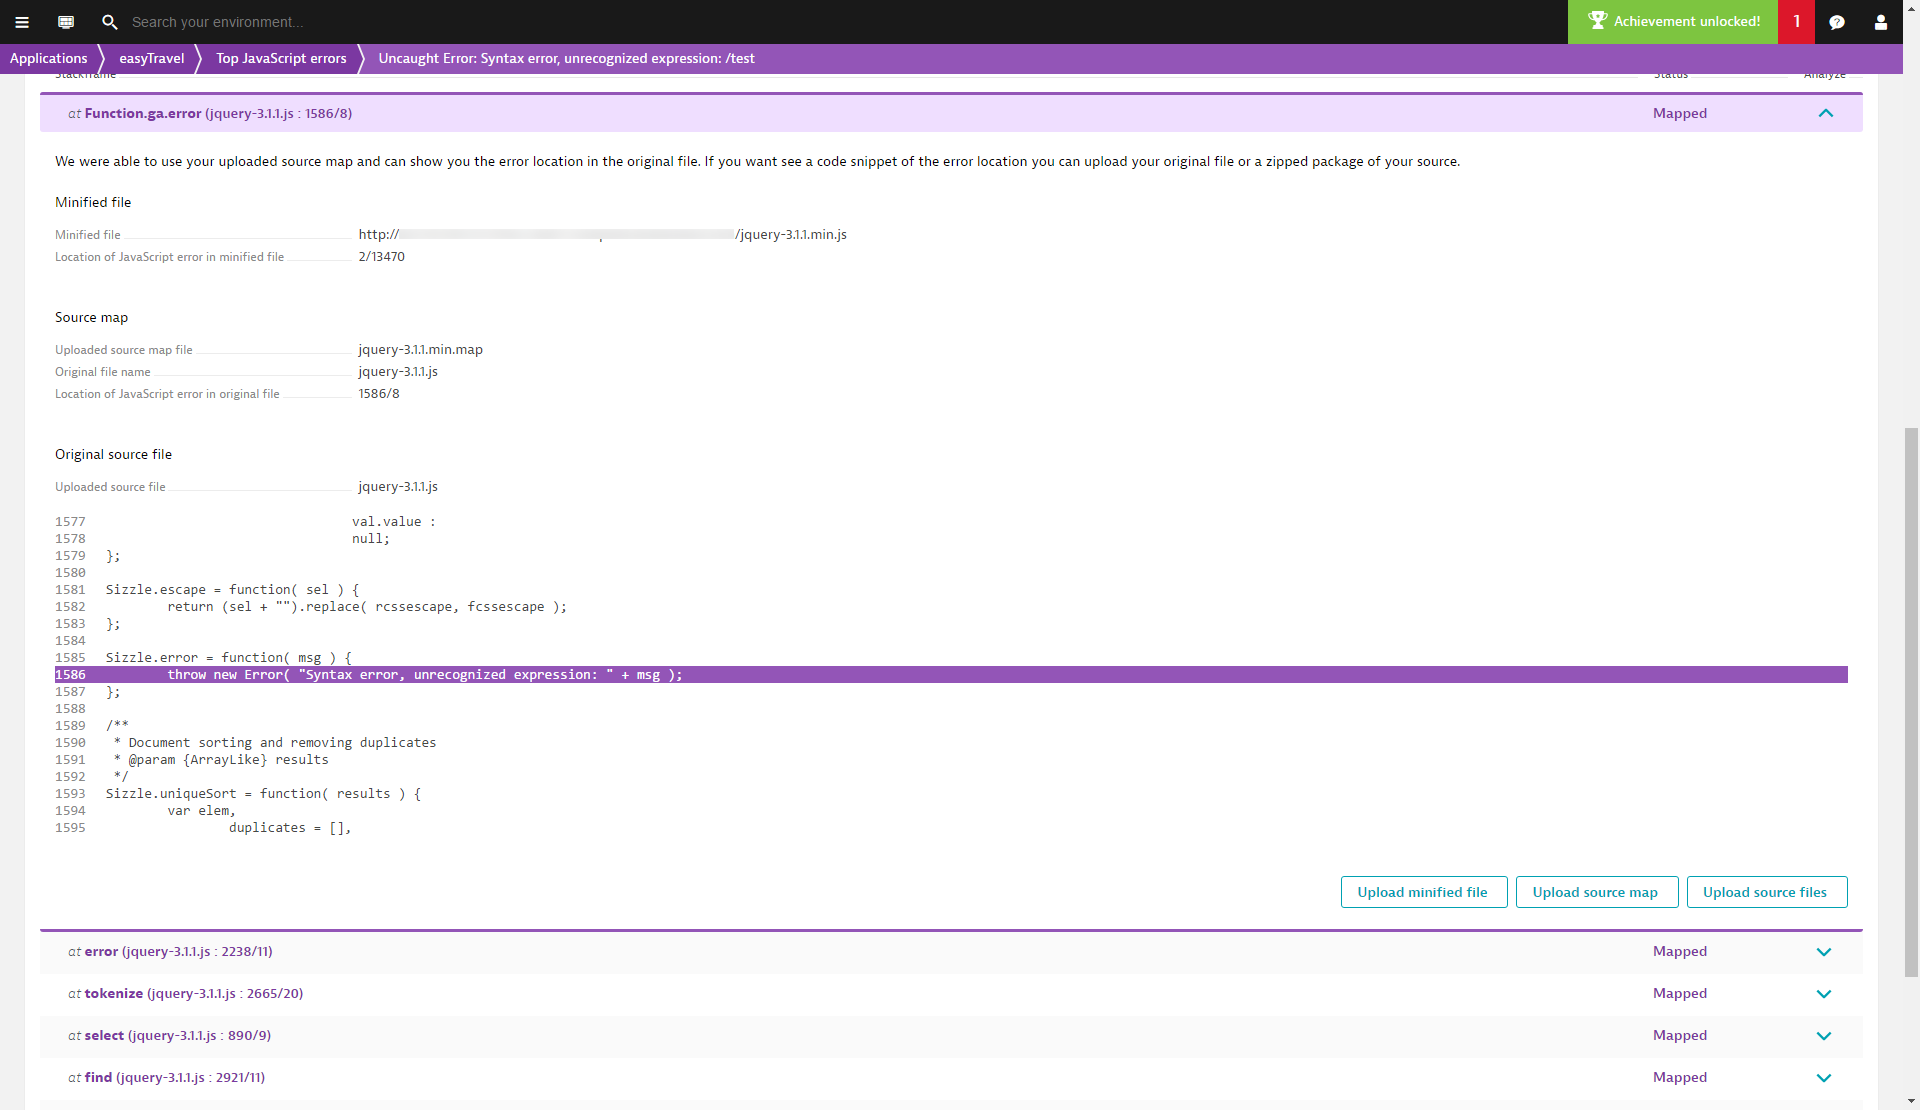
If the source map doesn't include the original JavaScript code, click the Upload source files button to upload the original JavaScript files.
JavaScript error analysis provides all the required information for tracking down errors in JavaScript files. You can navigate your way through the stack trace by expanding the individual stack frames.
Note: Following manual upload of a JavaScript file for the analysis of a specific stack frame, other related stack frames are automatically mapped to the same file. This saves time when you are navigating through stack frames. If you run into an error that doesn't have a corresponding source map, simply upload the required files.
Upload source maps and symbol files
All available source files are listed under Settings > Web and mobile monitoring > Source maps & symbol files.
Mobile app source maps
For Android: Proguard mapping source files are supported.
For iOS: Before they are uploaded, dSYM files must be converted using the decode.sh utility that is provided with the OneAgent for iOS installer.
Web application source maps
DESK automatically attempts to download all available source maps and JavaScript source files from public CDNs. You can optionally upload source maps and source files from each JavaScript error details page.
To upload a source map
-
Go to Applications > JavaScript errors.
-
From the list of Top JavaScript errors, select the error that you want to analyze and scroll down to Stacktrace.
-
Select a stackframe to expand it and click the corresponding Upload source map button.