Service backtrace
More than just knowing which service directly calls one of your services, it's helpful to know the sequence of service calls that leads up to each request—all the way back up to the browser click that triggered the sequence of calls. DESK Service-level backtrace can show you such call sequences.
Say for example that you’re analyzing a SQL database service and you want to understand the sequence of preceding service requests that ultimately triggered the incoming requests to the SQL service. With service-level backtrace you might learn that, for example, the SQL database service is called by Service1, while Service1 is called by Service2, which in turn was triggered by a click on a login button.
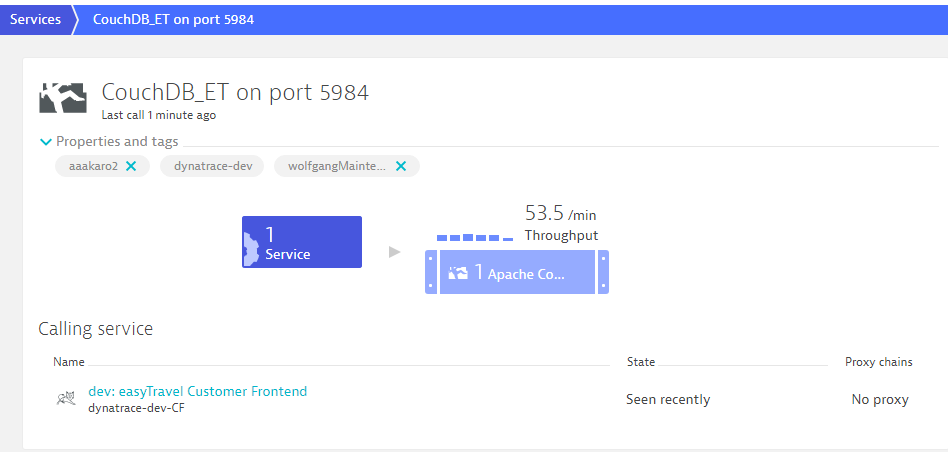
Consider another example. The image below shows that a CouchDB_ET service receives 53.5 requests per minute and that all those requests come from a single service. Say that you know that the CouchDB_ET service is called by other services that collectively make up your web application. The question is, how can you know exactly which click leads to which specific request? Service-level backtrace provides these details for you.
To view service-level backtrace
- Select Transactions & services from the navigation menu.
- Select the service you want analyze.
- On the service overview page, in the Understand dependencies section, click the Analyze backtrace button to view the service-level backtrace of requests to this service.
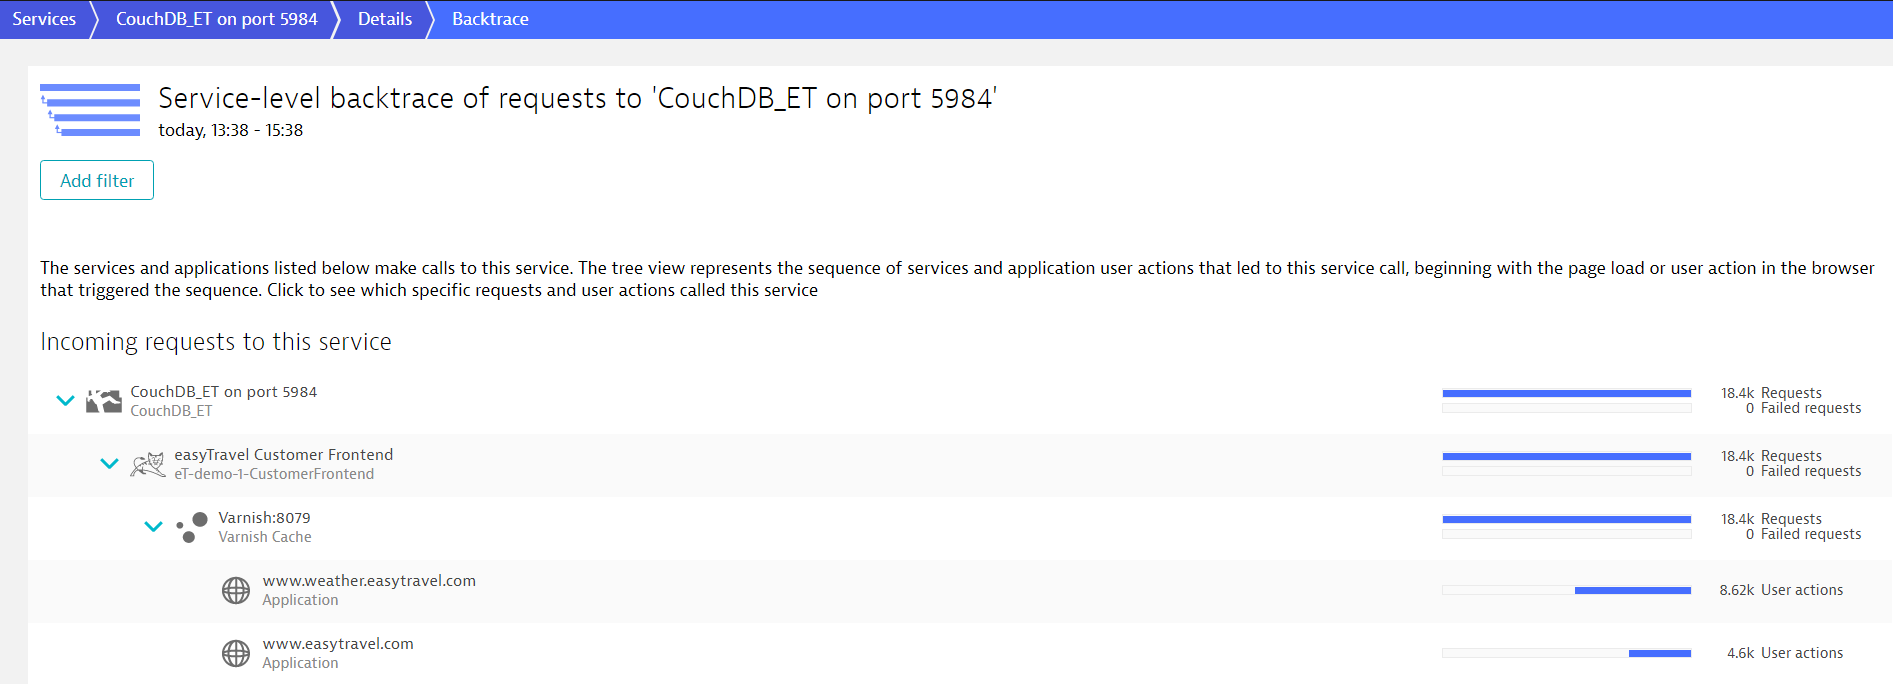
Notice in this example that the requests come from two web applications: weather.easytravel and easyTravel. Also, notice that the calls come in via a specific chain of services (Varnish calls easyTravel Customer Frontend which in turn calls CouchDB_ET). But there’s more. Select any of these services or the applications to see the names of individual requests. As you can see in the image below, all image requests to CouchDB_ET originating from the easytravel.com application come originate from five user actions.
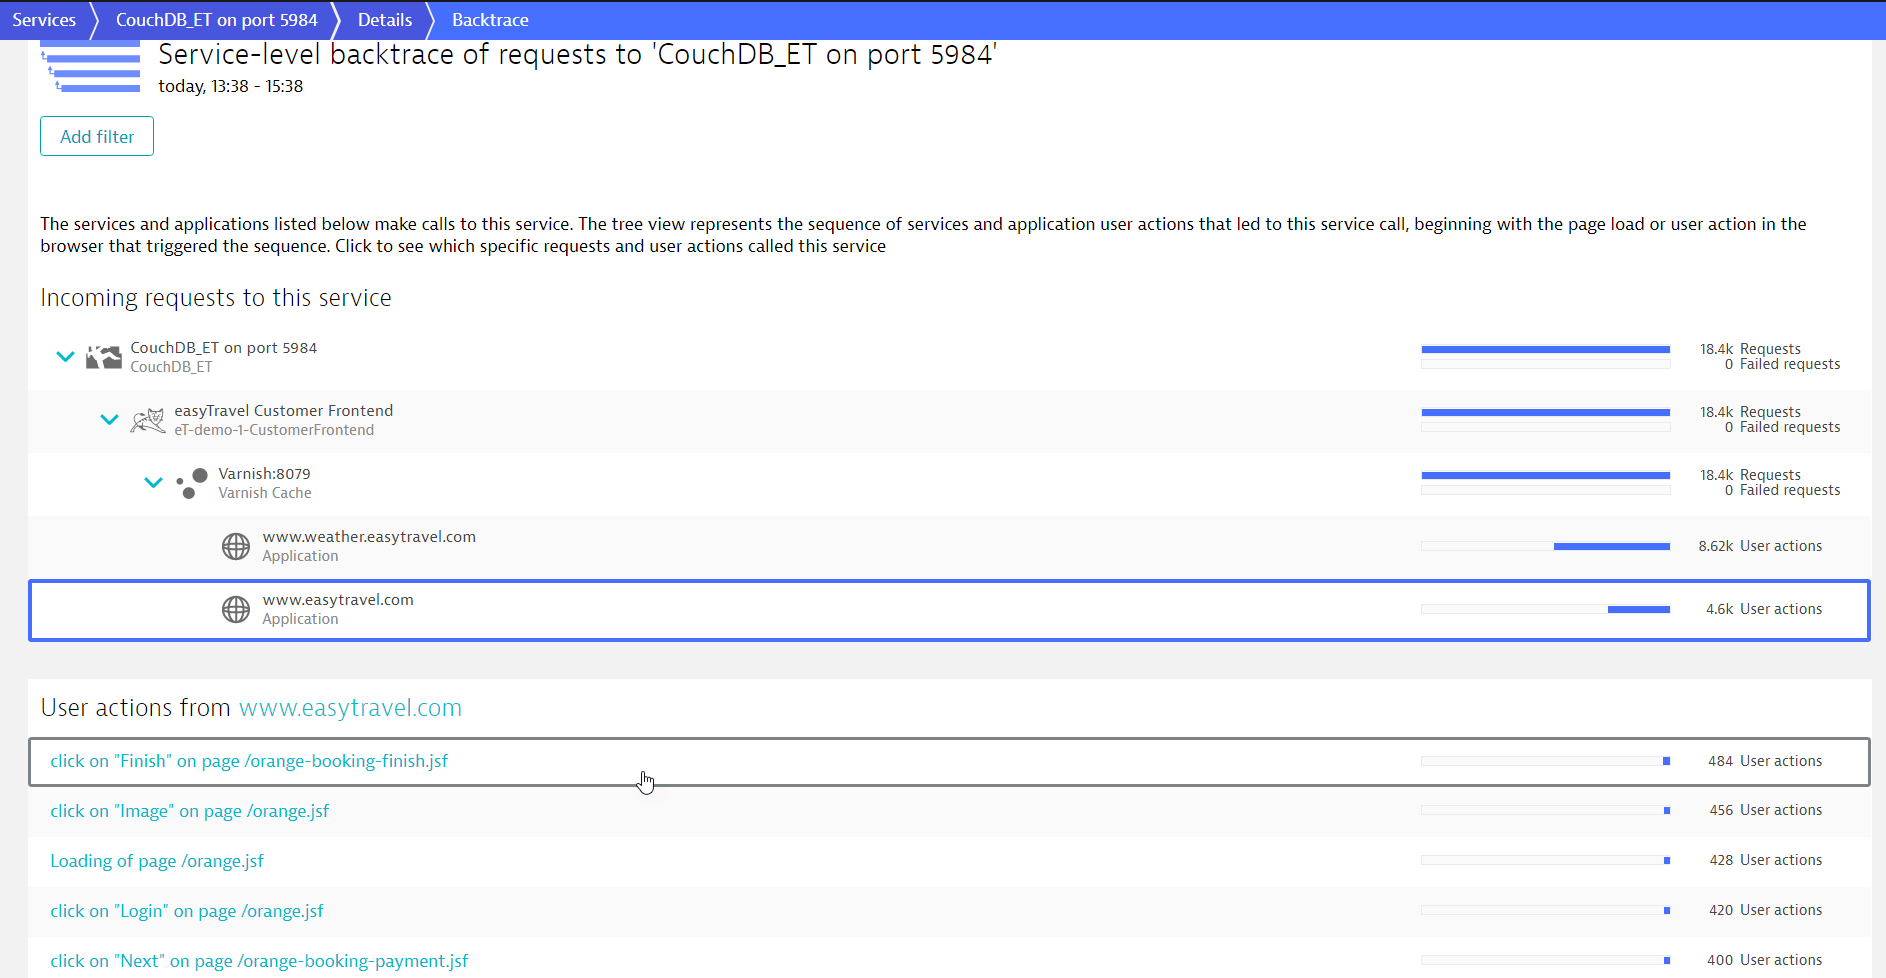
When a service or an application in a backtrace hierarchy is selected, you can view further analysis regarding this service or application in two separate sections.
In the first section, in case of an application, you can view the list of user actions of this specific application that occurred within the selected timeframe. In the case of services, you can view the types of requests that were made by that particular service to the next service in the backtrace flow.
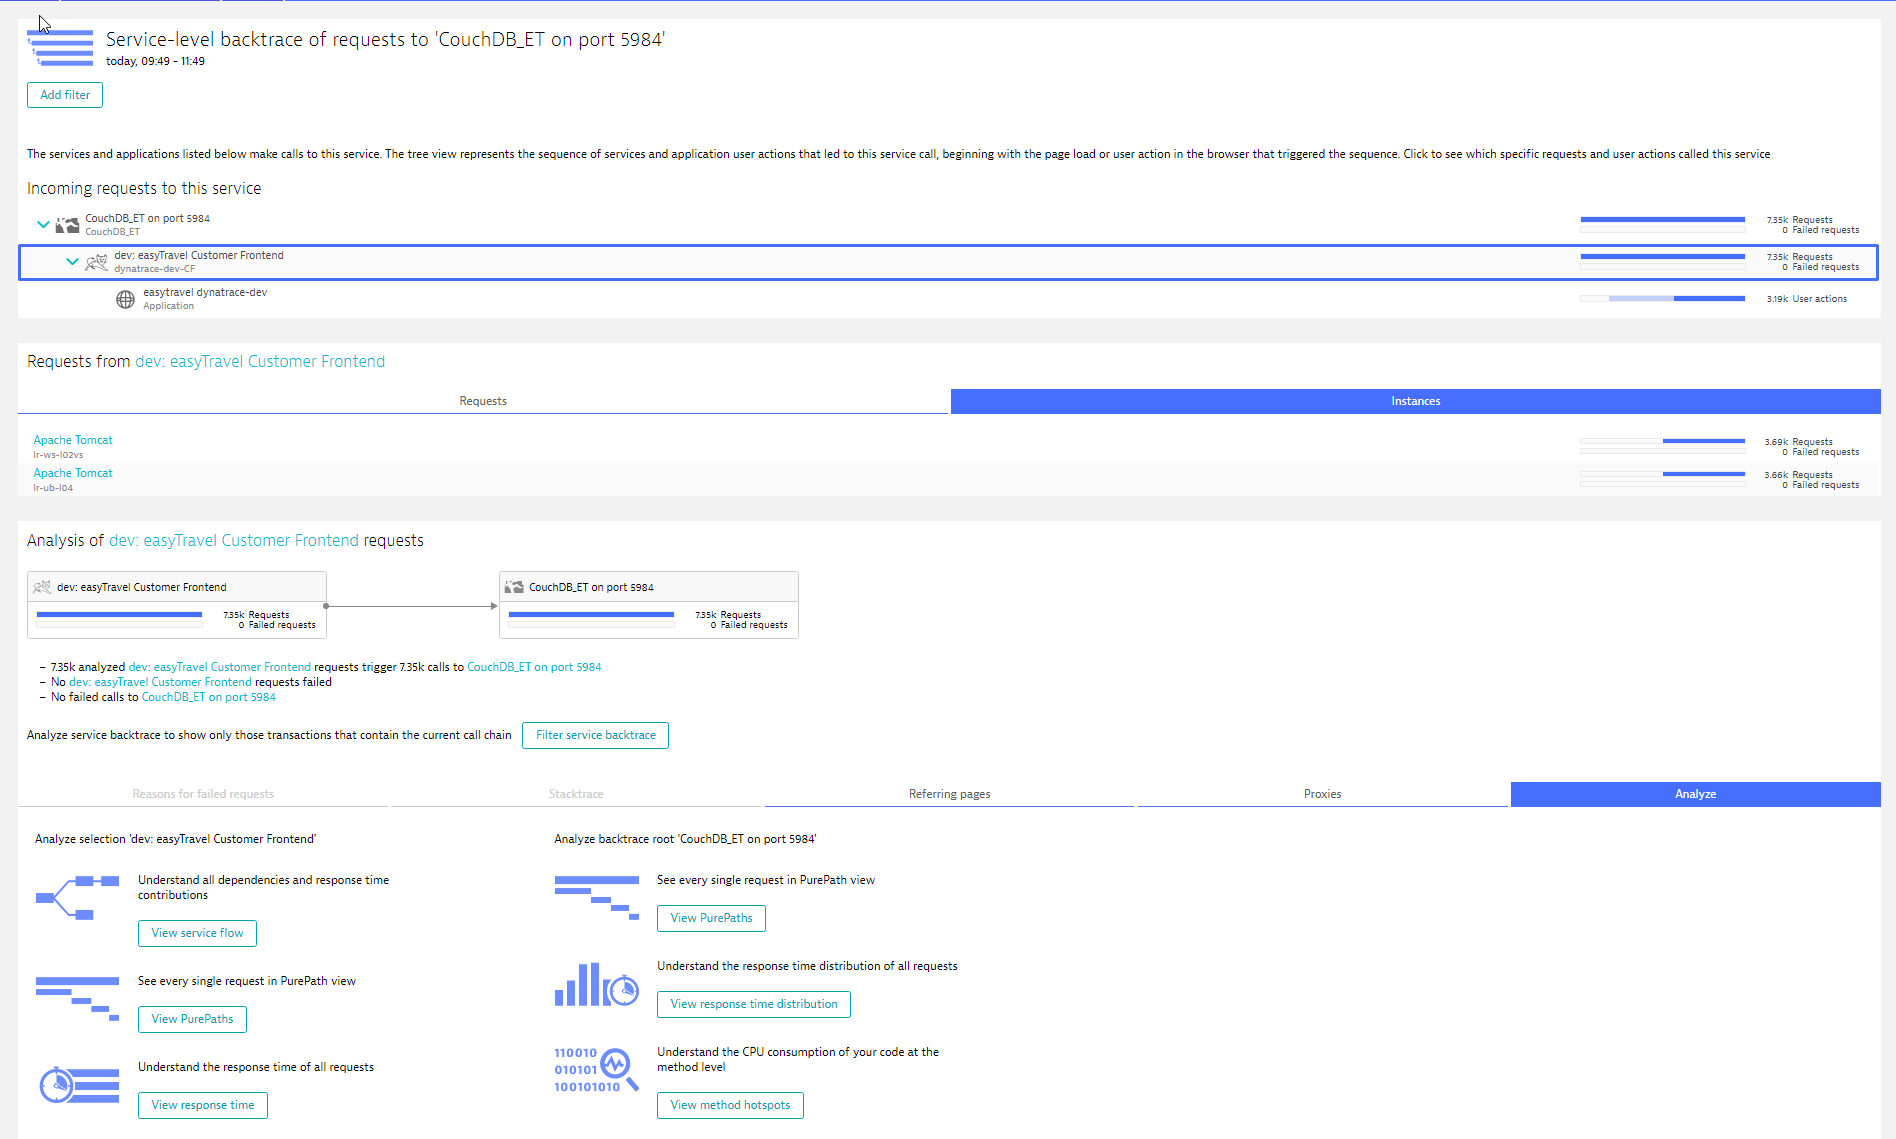
The next section includes analysis data regarding the number of requests and any failures that may have occurred. Further information can be accessed by selecting the tabs:
- Reasons for failed requests
Lists the reasons that specific requests failed. - Stacktrace
Shows in which part of the code a request was executed. - Referring pages
Shows the HTTP referrers that contributed to the specific backtrace flow. - Proxies
Provides information about the proxies or load balancers that a request was sent through. - Analyze
Offers various analysis options for both the selected service (in the left-hand column) and the service examined in the backtrace (right-hand column).- View service flow
- View PurePaths
- View response time
- View response time distribution
- View method hotspots
Additionally, you have the option of showing only those transactions that contain the current call chain. Just click Filter service backtrace.
If a clustered service is selected in the backtrace, click the Instances tab to view the same analysis for every service instances (see image above).
Backtrace analysis examples
Here are some examples of how to use backtrace analysis:
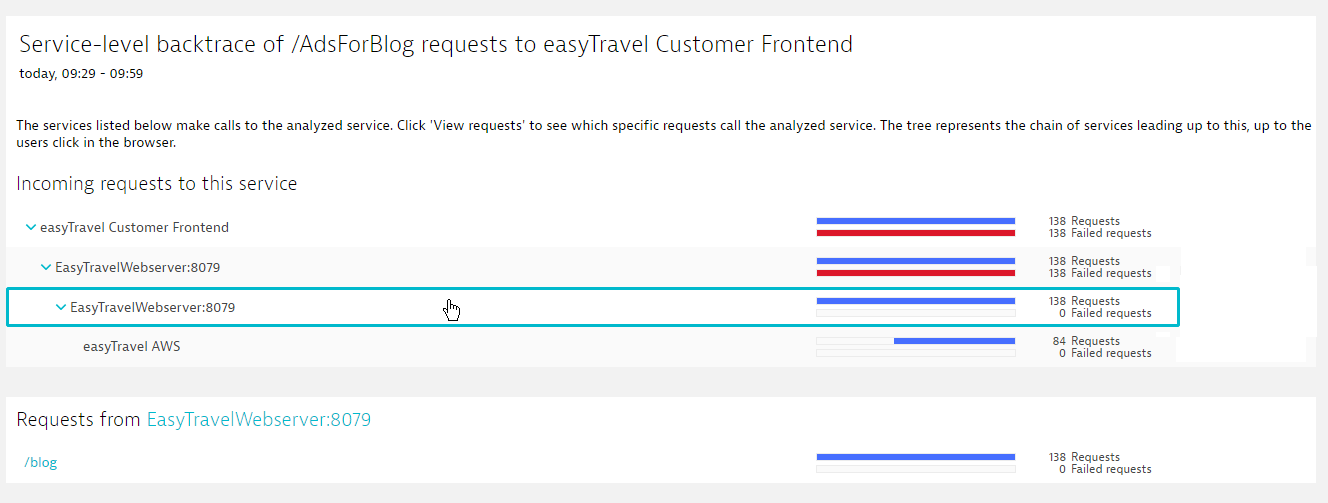
The backtrace feature becomes even more useful when it comes to analyzing errors. See the example below. It shows a 100% Failure rate for the AdsForBlog request.
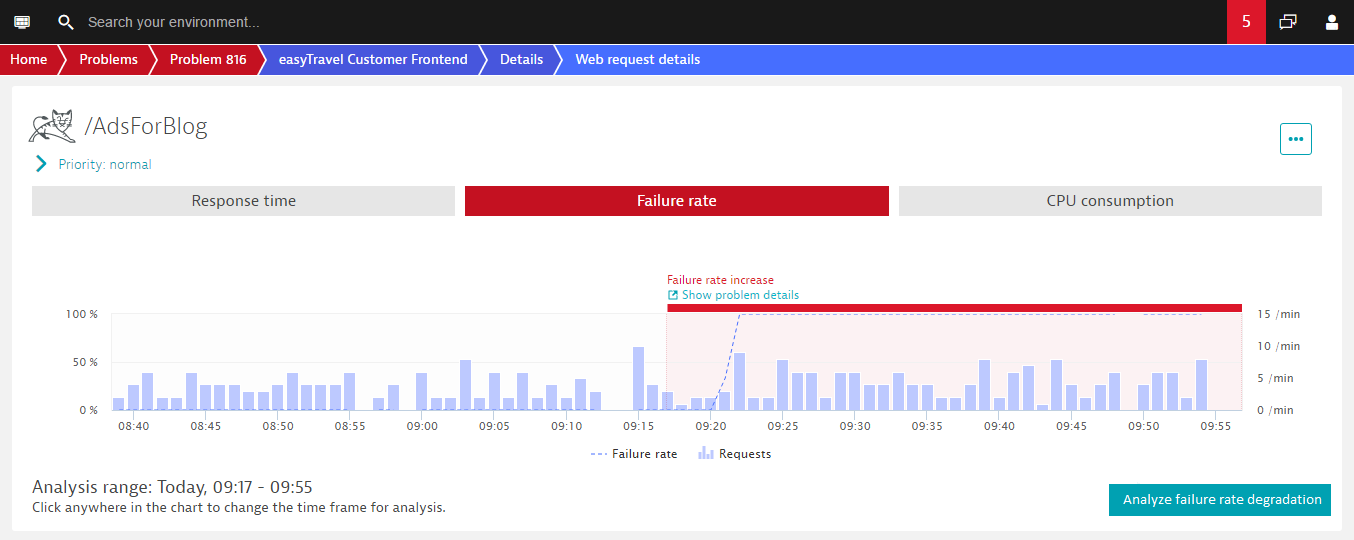
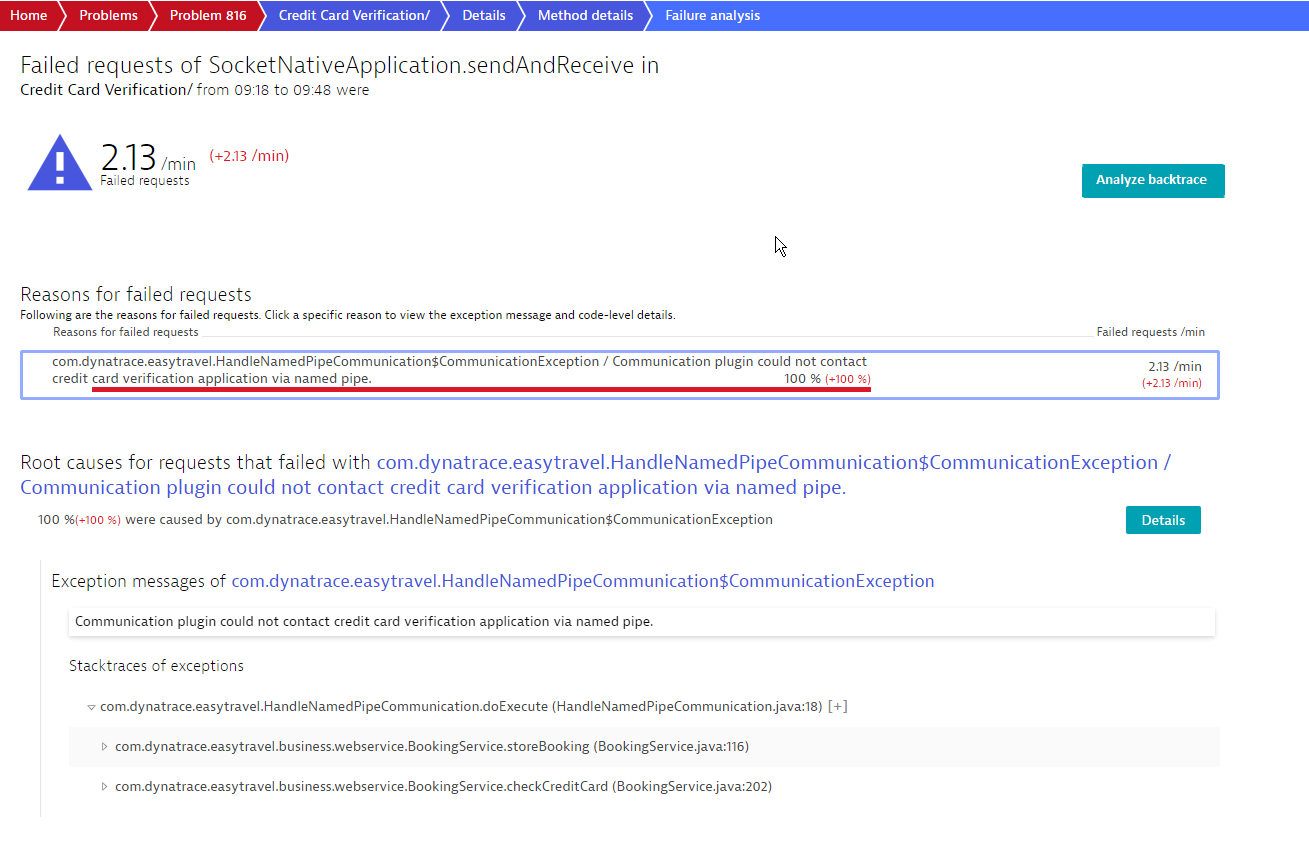
To learn the root causes of detected failures, click the Analyze failure rate degradation button. You'll then see the message and the stacktrace (see image below). To see how significant the falures were and if they impacted your users, click the Analyze backtrace button.
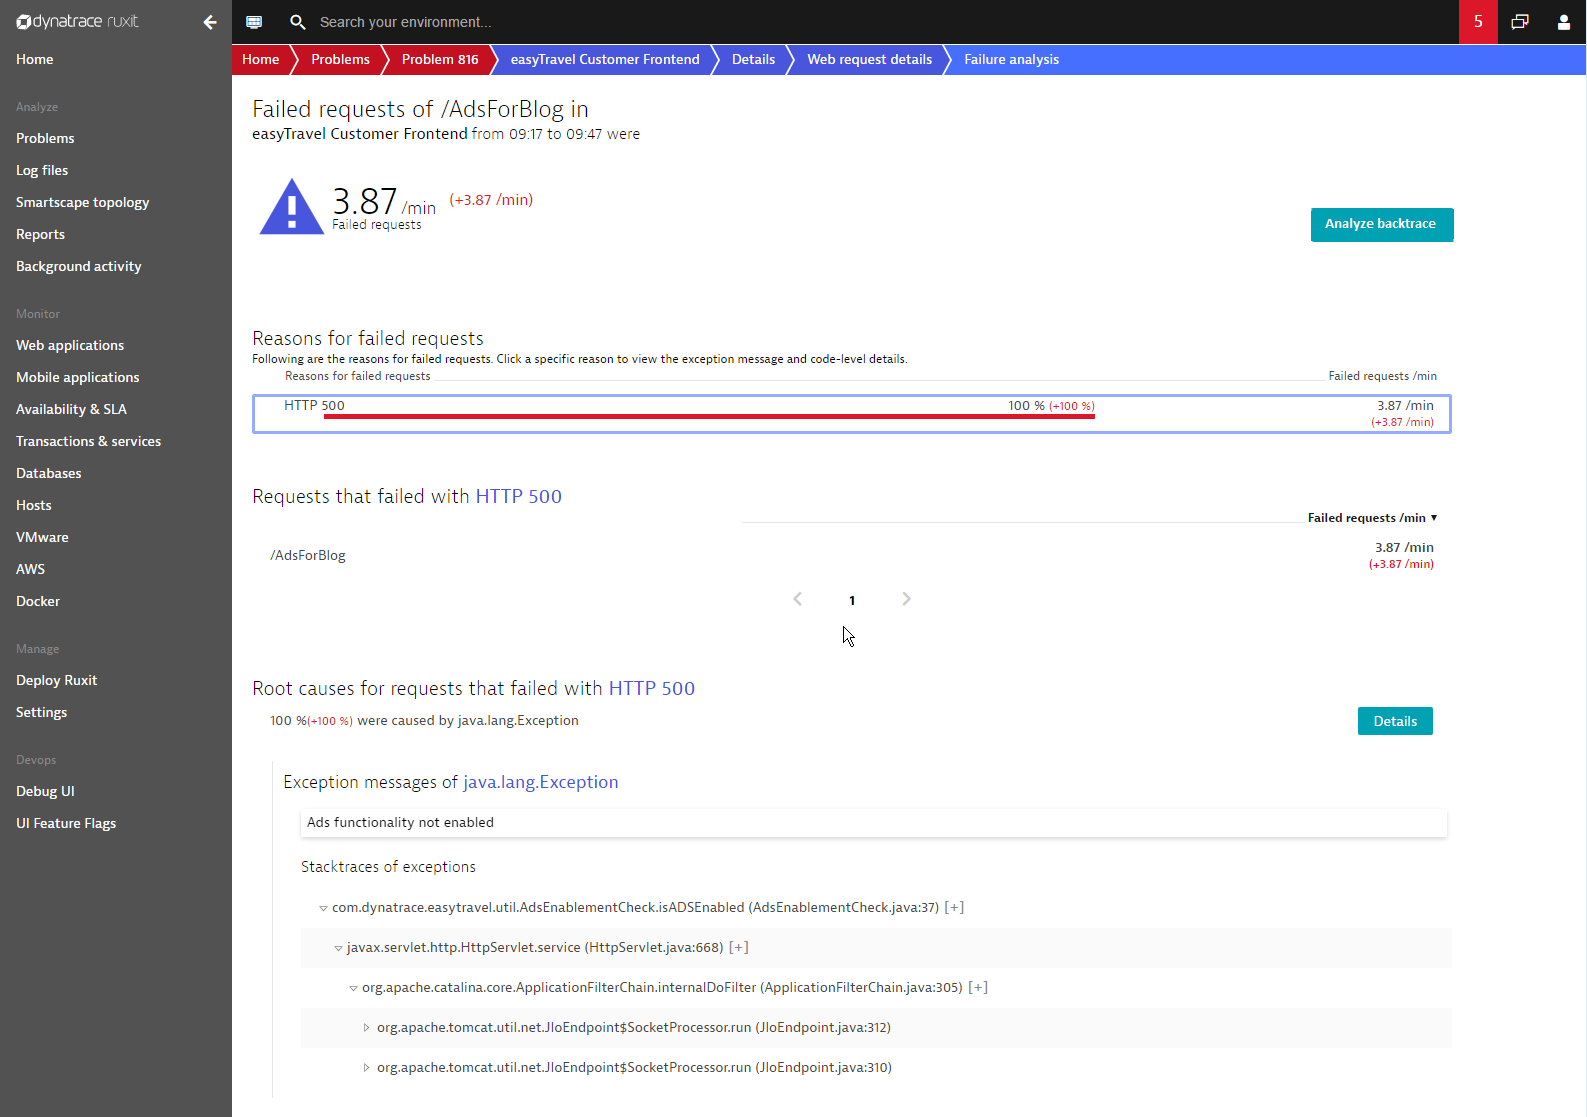
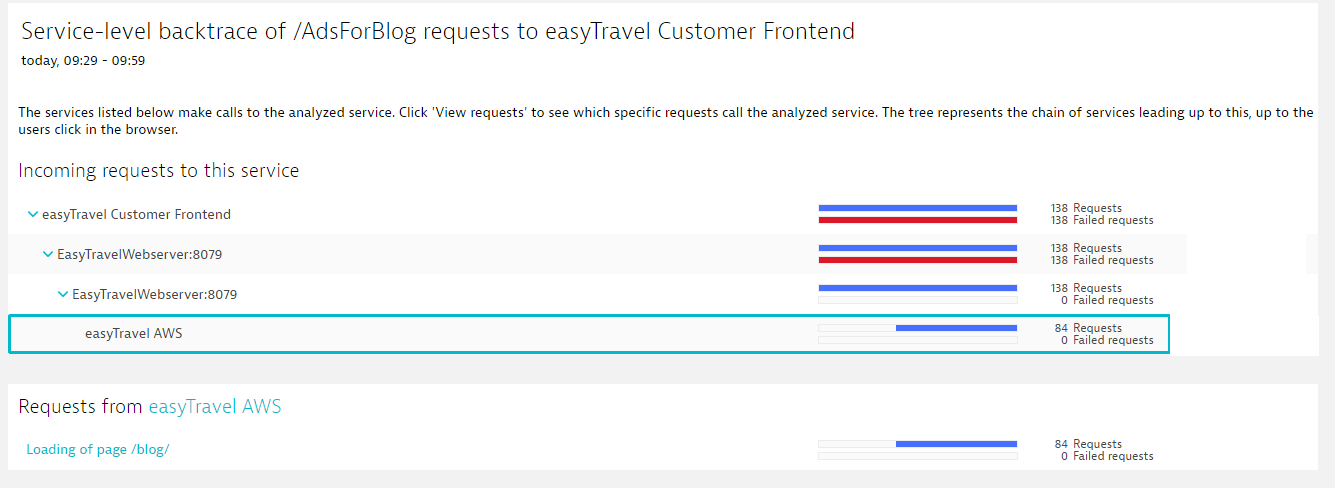
DESK shows you how this failed request impacted your other services and your users. You can see that all requests came from a single user action, the loading of the blog. You can also see that the /blog request on the web server wasn’t impacted by the failed Ads request. Not a single /blogs request failed—so the error was handled gracefully.
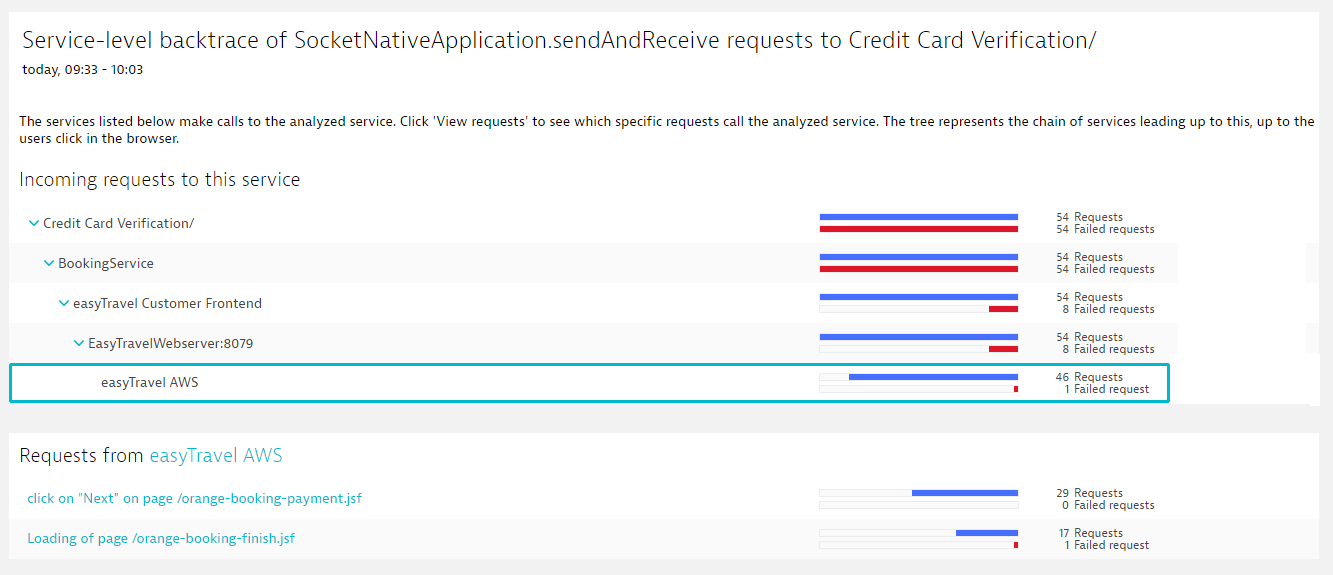
In contrast, have a look at the service analysis page below. You can see immediately that the failure of the Credit Card Verification service had some impact on users. The BookingService requests failed and users could no longer purchase items. This shows clearly that this error is of high importance and should be addressed immediately to avoid future occurrences.
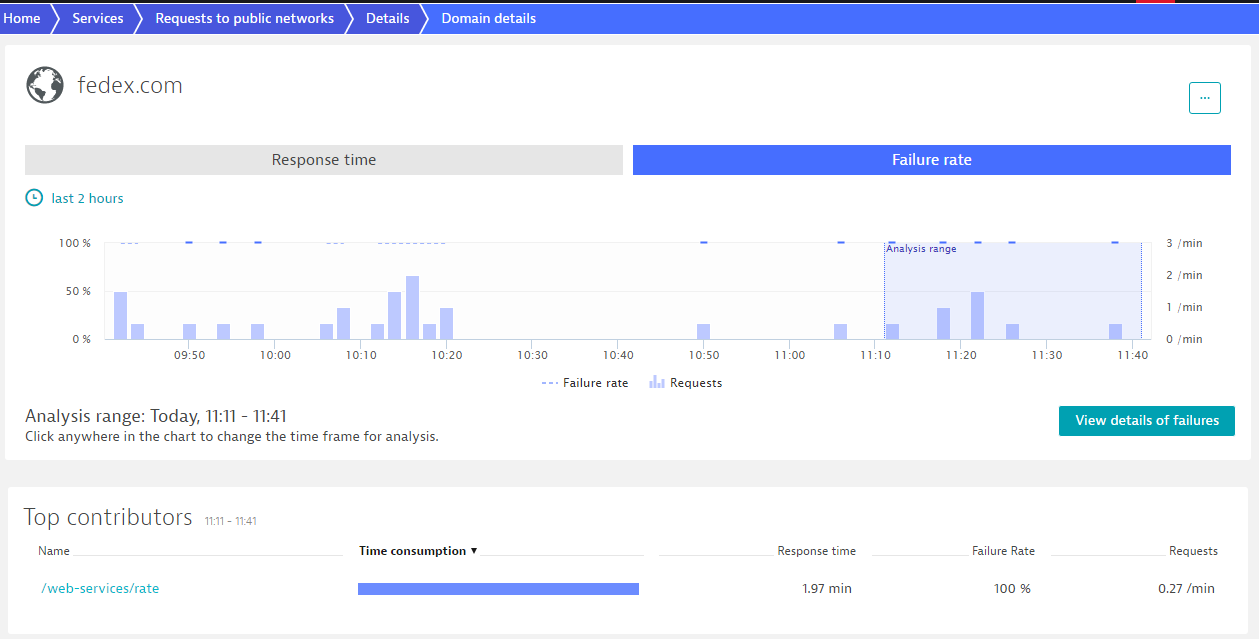
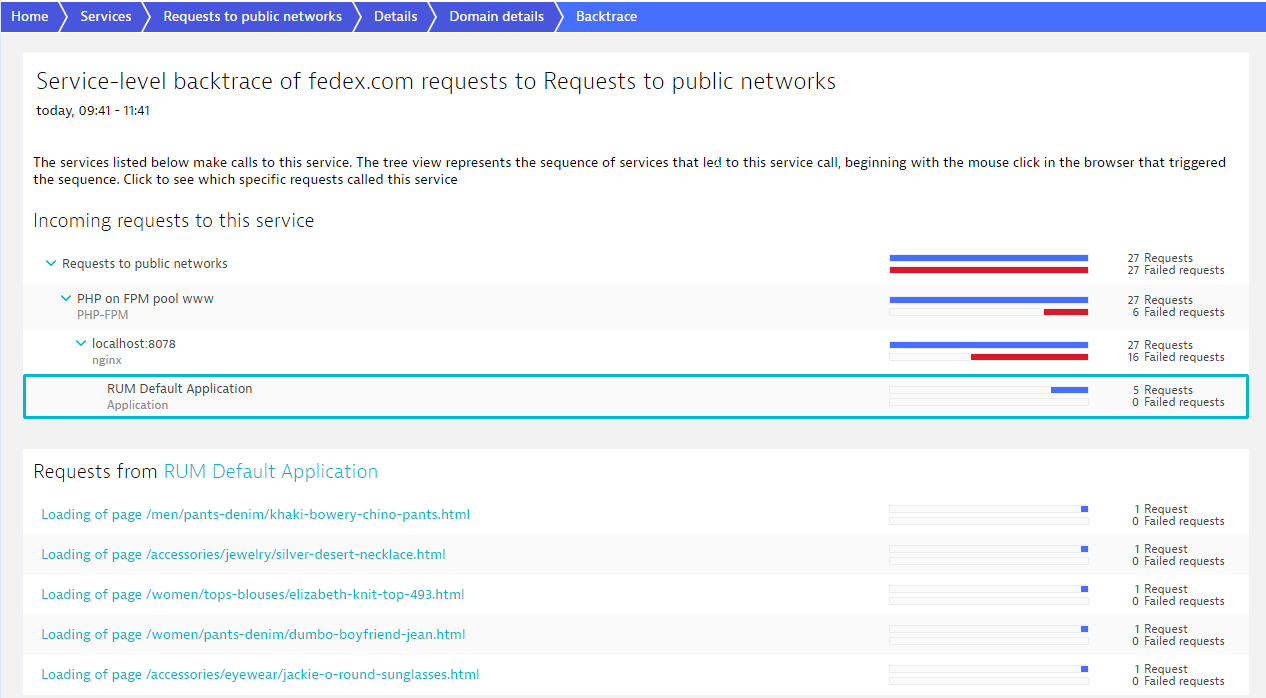
DESK enables you to see which services call which third-party services, in addition to the browser clicks that initiate such call sequences. In the image below, note that all requests to fedex.com are failing. The service backtrace tells you which services and which user clicks led up to this third-party call.