Log Monitoring functionality
To enable DESK Log Monitoring, just make sure you're running the latest version of DESK. All new log content from important processes will then be auto-detected and monitored. There's no need to copy or export log content to external storage for analysis.
- For details, see Log content auto-discovery.
Additionally, you can add custom log files to be available for either on-demand or stored monitoring.
- For details, see Add log files manually.
The DESK search query language is an extensible and easy-to-learn way to filter out all log lines except the ones that interest you.
- For details, see Search query language.
Log monitoring
By default, you can monitor and examine the log files that remain on the host system or log files stored on the DESK server.
- On-demand monitoring is always available for all auto-detected logs.
- Stored logs have a defined data transfer quota. You start with a total of 5 GB per year of data transfer for all your monitored log files. You can boost this quota as your needs increase.
For more information on consumption calculation, see Monitoring consumption calculation.
Do not confuse the 5 GB per year data transfer quota with disk space. You can, for example, store a 1 GB log file, taking 1 GB of drive space on a DESK server, but if you transfer that 1 GB log five times from the host to the DESK server, you will consume your initial 5 GB quota.
Log Monitoring is typically used for troubleshooting and monitoring as described below.
Troubleshooting
You can analyze a specific log ad-hoc within a relatively short problem time frame for a specific process or host. In this use case, the log files remain on the host system and are not listed in the log viewer. You use Log Monitoring to drill down to the log files via the hosts or processes screens and track down the log file that pertains to the problem.
Important characteristics of using log monitoring for troubleshooting:
- Process and operating system logs are auto-discovered.
- You can examine a maximum of 500 MB of log data.
- You can examine the log files for only the past seven days.
- You can examine log files one at a time in the context of your topology.
Example
Suppose a bug made it into production. An object churn causes high memory usage. This leads to garbage collectors activating, causing process restarts. Davis detects those process restarts and shows you the actual process and which services are affected. You are only one click away from looking at the log events captured during that problem time frame to enhance your troubleshooting.
Monitoring
You can analyze significant log events across multiple logs, across parts of the environment (production), and potentially over a longer time frame. For immediate notification, consider setting alerts for monitored logs. In this use case, you specify the log files to be stored on the DESK server, enabling you to analyze longer time frames or to perform analysis across multiple log files.
Important characteristics of monitoring logs and storing log files on DESK server:
- Transferred log data to the DESK server is measured.
The initial quota is a total of 5 GB per year of log data transfer. - You can retain data for as little as 5 days and up to 90 days.
- You can create alerts based on text pattern occurrences across monitored logs.
- You can bookmark search queries on multiple monitored logs.
- You can parse columns and examine the top N occurrences.
For details, see Column display and Top N occurrences. - You have access to the application programming interface (API) for these log files.
For details, see Log Monitoring API.
Example
Suppose a security problem was found in production: confidential data was logged due to a bug. The security team has to find out when, and in which application versions, this bug occurs. To be more proactive going forward, alerting on critical log patterns must be established.
Log viewer
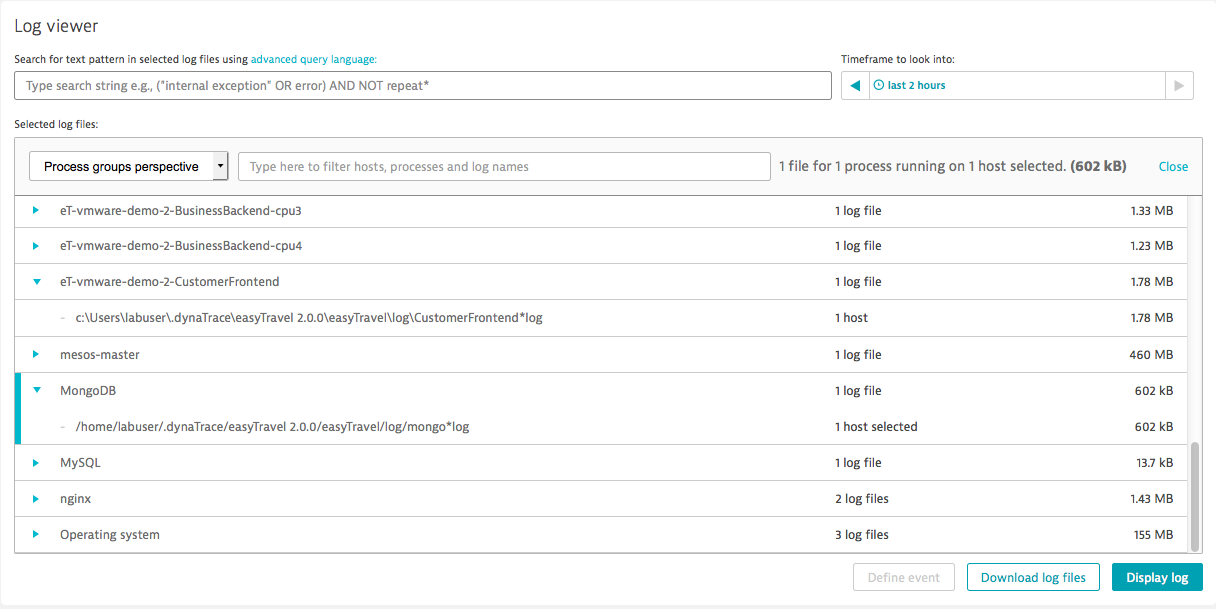
The DESK log viewer is included in your host unit price free of charge. DESK accesses and analyzes all logs that are stored on monitored host disks. To access the log viewer, select Logs in the left-hand navigation menu and then click Analyze log files.
From the log viewer, you can access and examine only the logs that have been set to be monitored (stored).
You can access any auto-discovered log by browsing through host or process screens and drilling down to the log that you are interested in. The log you drill down to will automatically be selected in the log viewer. Keep in mind that you can only view the log data for the past seven days and only one file at a time.
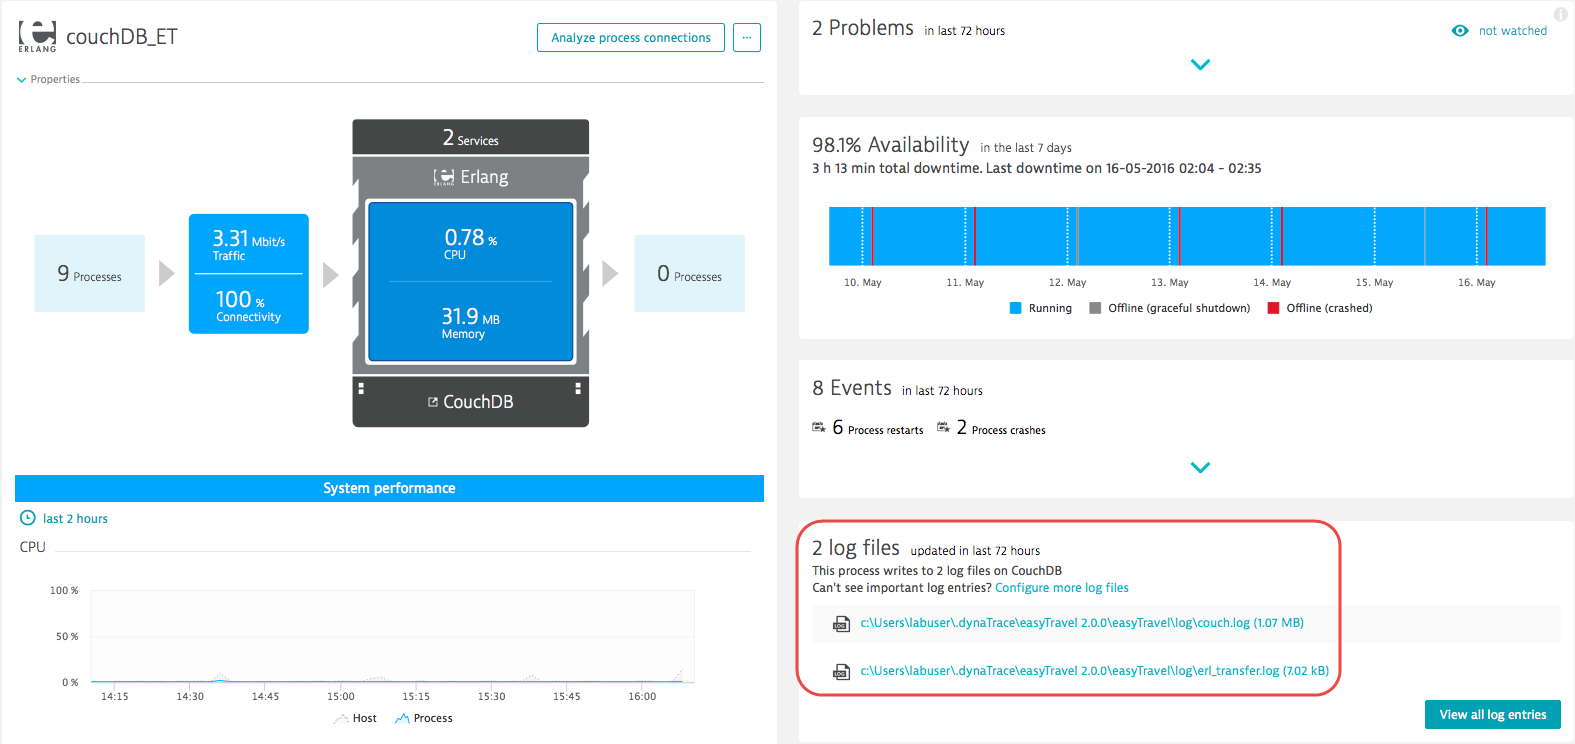
To view the logs for a selected process, use the log files list on individual Process pages. In the example below, the 'couchDB_ET' Process page displays two related log files. Clicking one of these opens the log viewer with that log pre-selected.
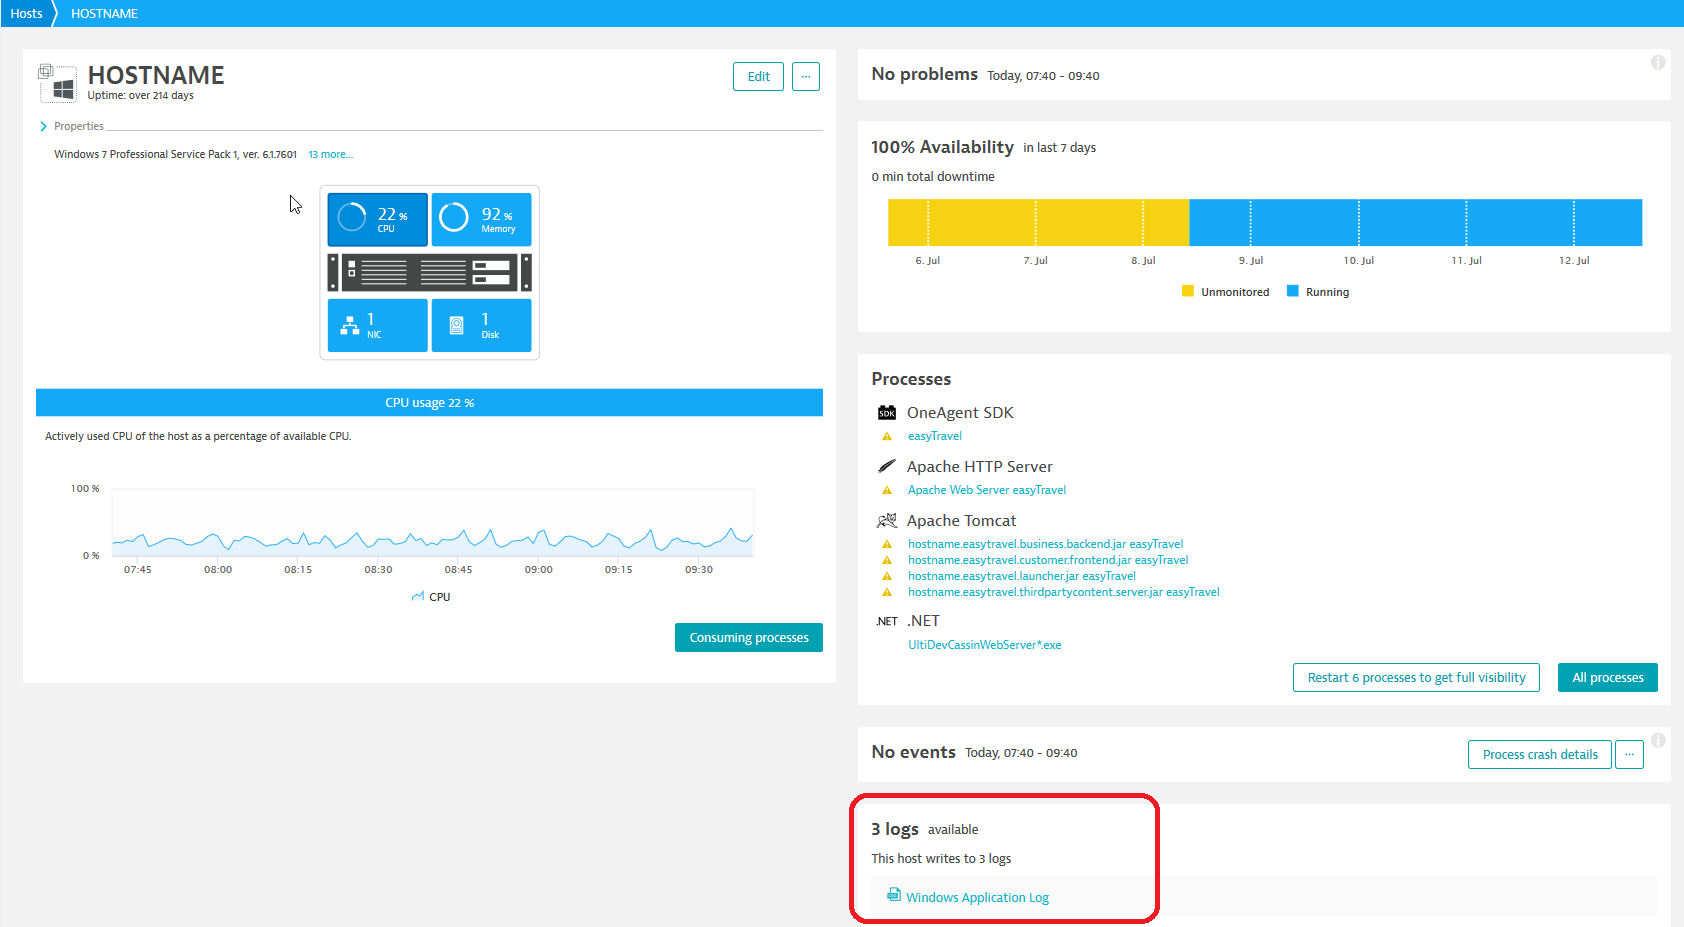
To view the logs for a selected host, use the log files list on individual host pages. Clicking one of these opens the log viewer with that log pre-selected.