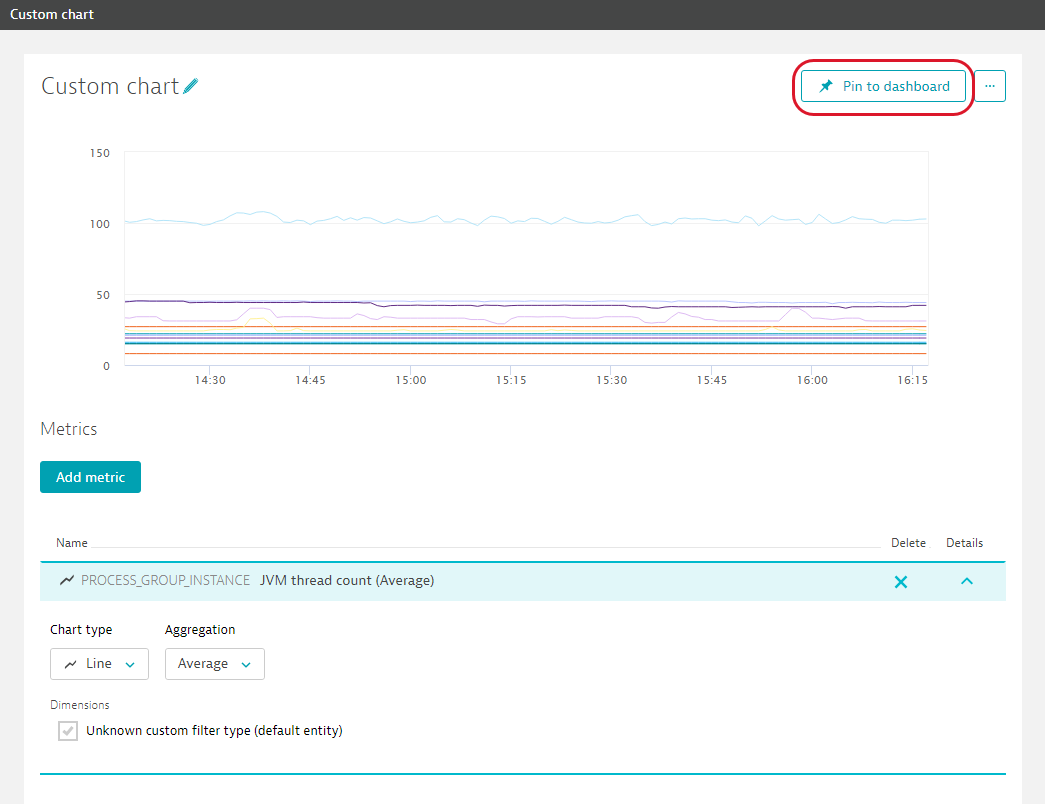
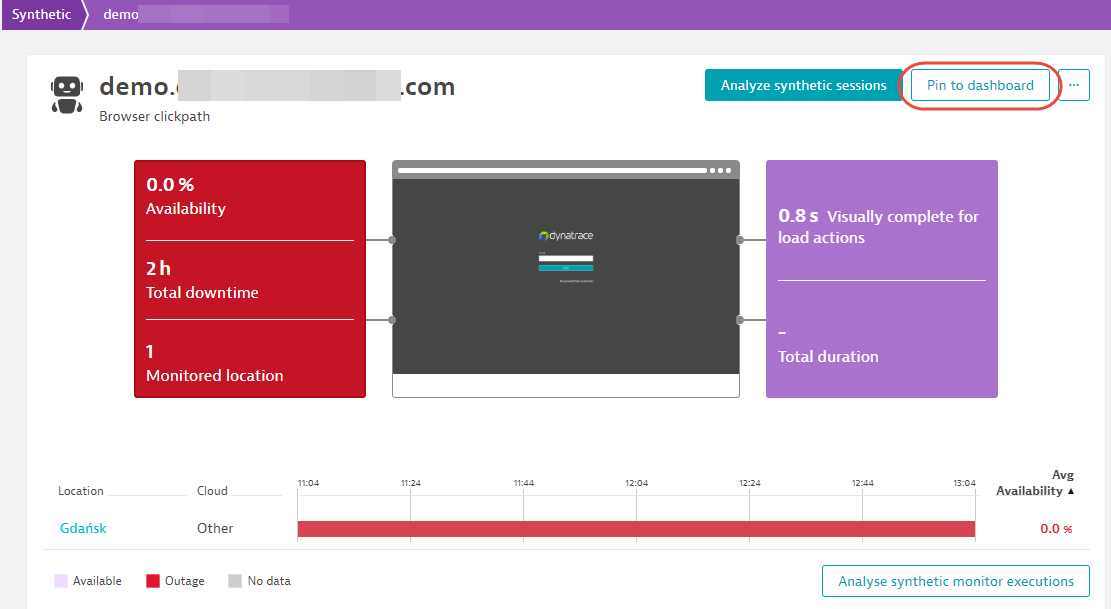
Pin tiles to your dashboard
A new dashboard tile can be created based on any DESK page that includes a Pin to dashboard button (see example below). You can pin any chart or synthetic monitor to any dashboard for which you have the edit permission (or to any new dashboard).
You can also pin filtered entity lists to your dashboards (for example, a filtered list of hosts). For details, see entity filters for custom charting.
To pin a tile to a dashboard
- Click the Pin to dashboard button on any page that includes this button.
- If required, select the element of the page you want to include on the tile. For example, from any web application overview page you can visualize resource breakdown, bounce rate, and more.
- A dialog shows a preview of your tile. The preview uses real data from your environment and looks exactly as the final tile will appear on your dashboard.
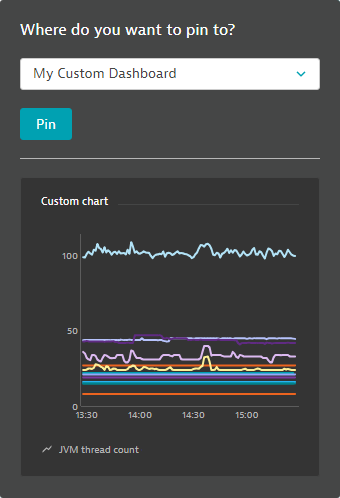
- Select the required dashboard from the list and click the Pin button.
- The tile is added to your current dashboard. Click the Open dashboard button to navigate to it, or stay on the current page.
If you added the tile to a new dashboard, the name of the new dashboard will be generated automatically. You can change the name later.