Check usage metrics for a mobile app
Mobile-app usage metrics provide a quick overview of the number of users who are actively using your mobile apps during a selected timeframe. Each Mobile application details page includes an infographic with several clickable areas. The Usage section in the upper-left is selected by default. Here you'll find app-usage metric totals including Users, Active sessions, and a small Active users trend chart.
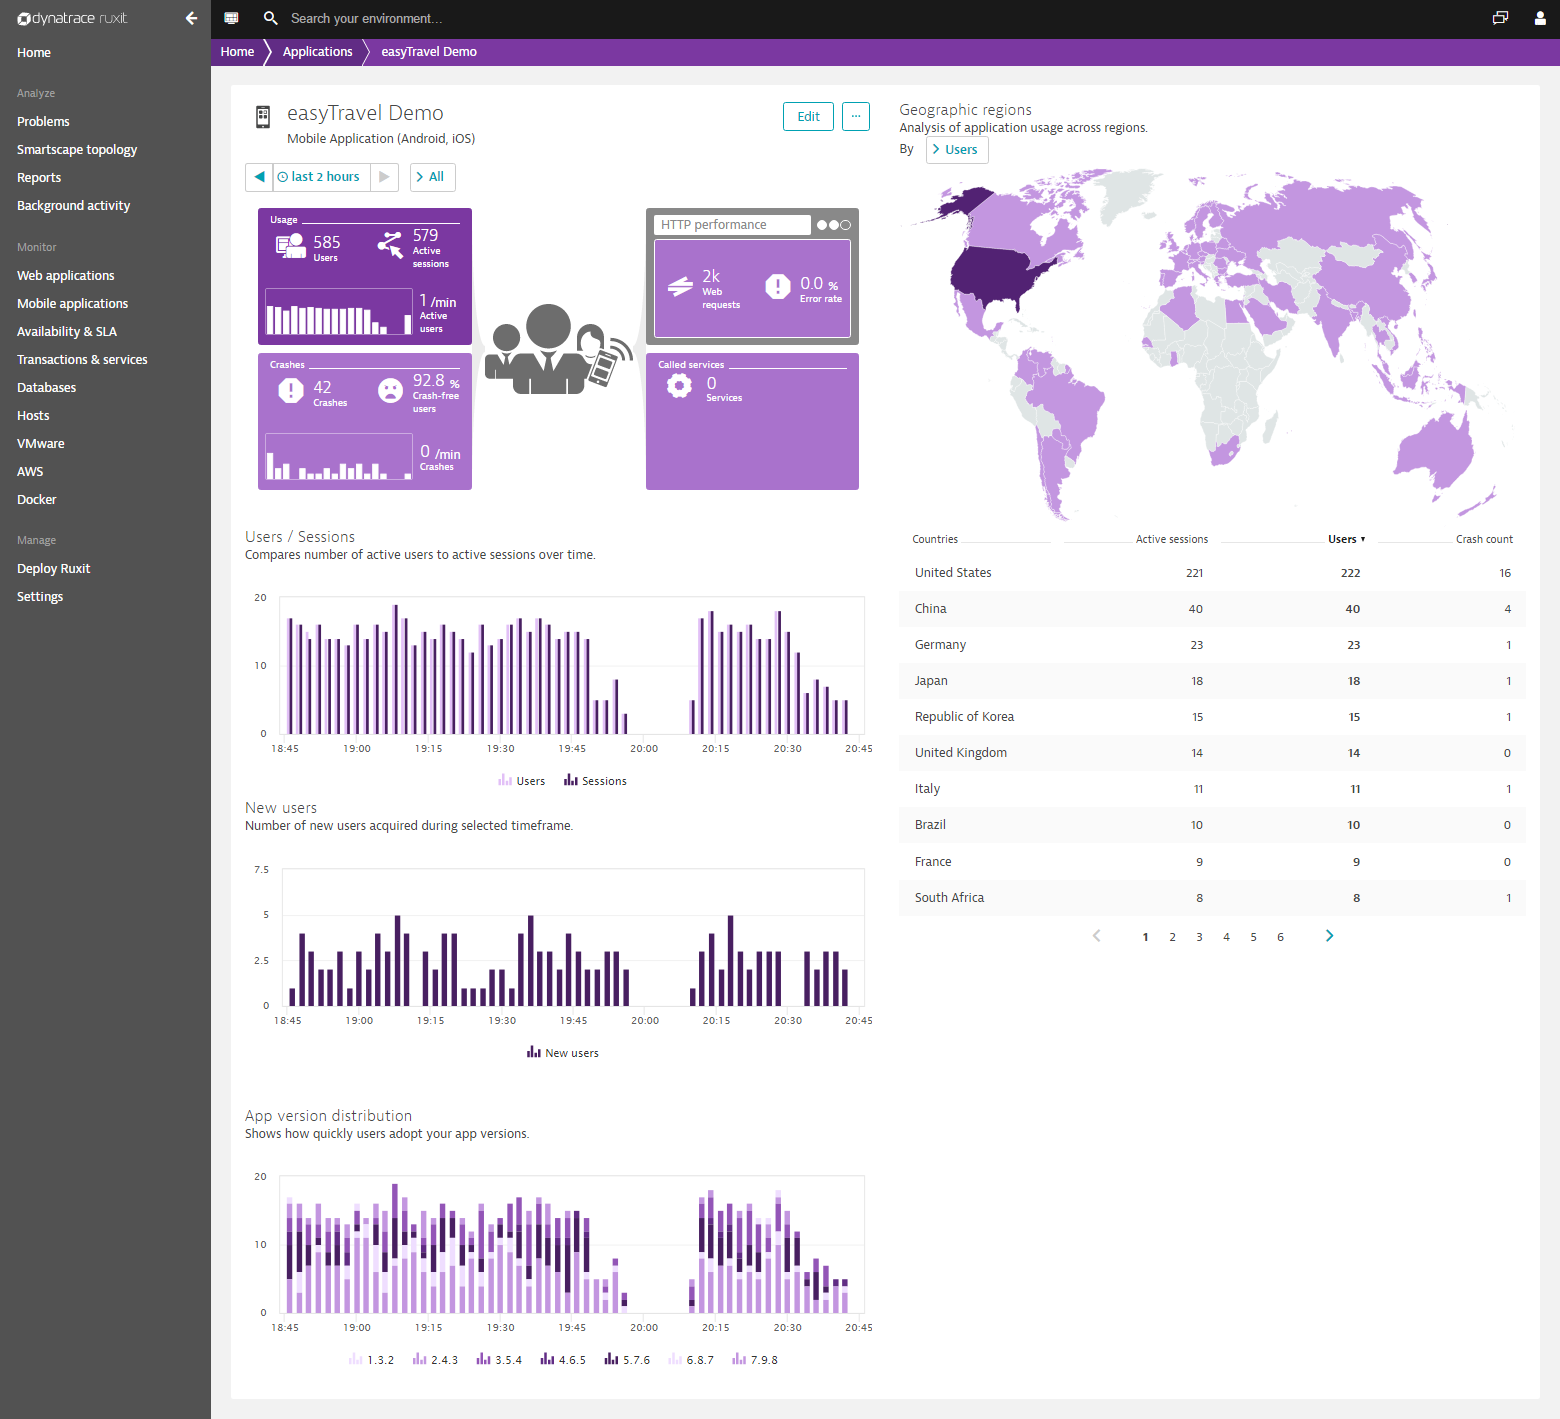
Users/Sessions
The Users/Sessions chart compares the number of users to the number of sessions during the selected timeframe.
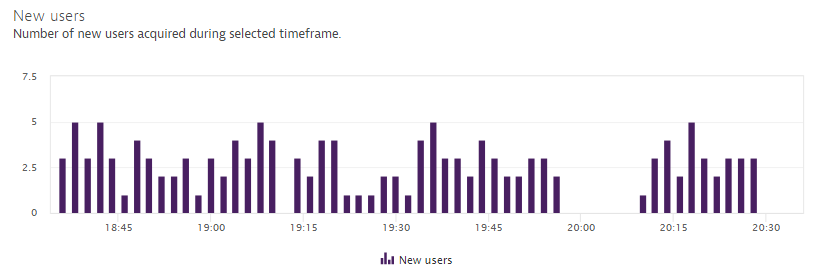
New users
The New users chart shows how many users installed your application for the first time during the selected timeframe. This metric only counts the first session following installation of an instrumented app. Application updates and DESK library updates don't trigger state resets for returning users. This metric is tied to specific devices, so a user will be counted multiple times if they install the application on multiple device types.
Note: This metric doesn't distinguish between multiple users that share the same device and application installation.
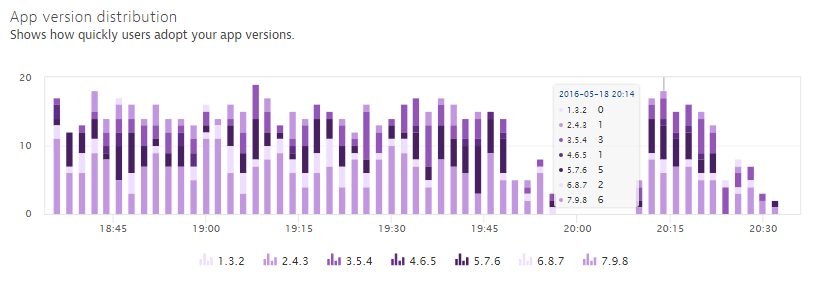
App version distribution
The App version distribution chart conveys the rate of application-version adoption by comparing the number of application sessions that originate from various application versions. This chart is particularly interesting following the release of new app versions as it enables you to track adoption of the new version.
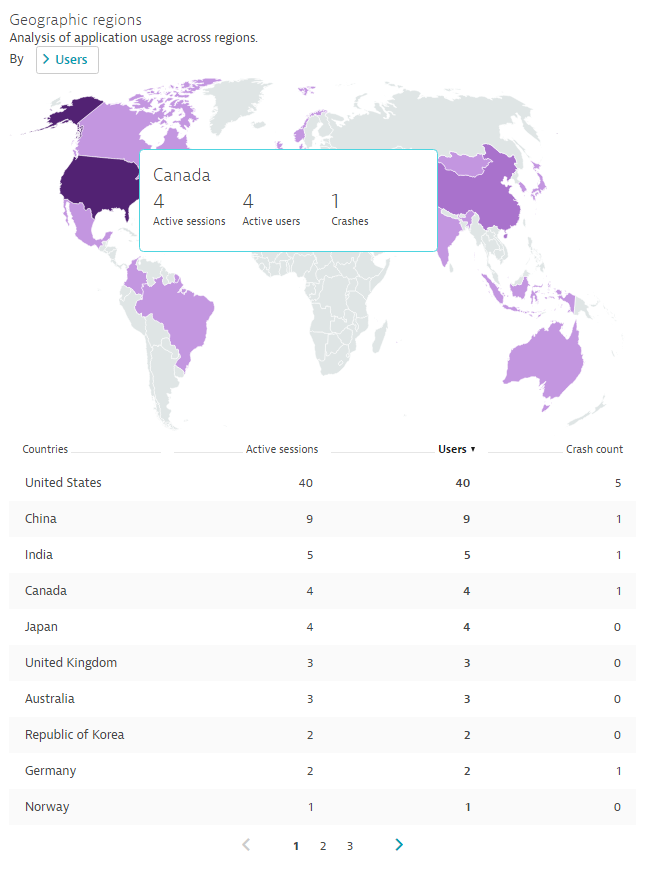
Geographic regions
The Geographic regions world map visualizes all the geographic regions from which your users originate. The world map shows the number of Active sessions, number of Active users, and the number of Crashes observed within each region.