Introduction to application overview page
The application overview page, which is organized into meaningful and intuitive sections, allows you to perform a thorough analysis of both the performance of your application as well as the user behavior.
To access the application overview page
- Click Applications in the navigation menu.
- Select an application.
Filtering
You can perform your analysis based on a specific dimension selected from the filter at the top of the application overview page. If you choose User type for example, you can specify whether you want to perform your analysis based on data gathered from Synthetic, Real users, or Robots.
Tags and JavaScript frameworks
Right beneath the name of your application, you can view the assigned tags and JavaScript frameworks, which are displayed within the expandable Tags and JavaScript frameworks area. It's easy to add new tags here—just click Add tag. There's also a Framework settings button that takes you to the settings related to JavaScript frameworks.
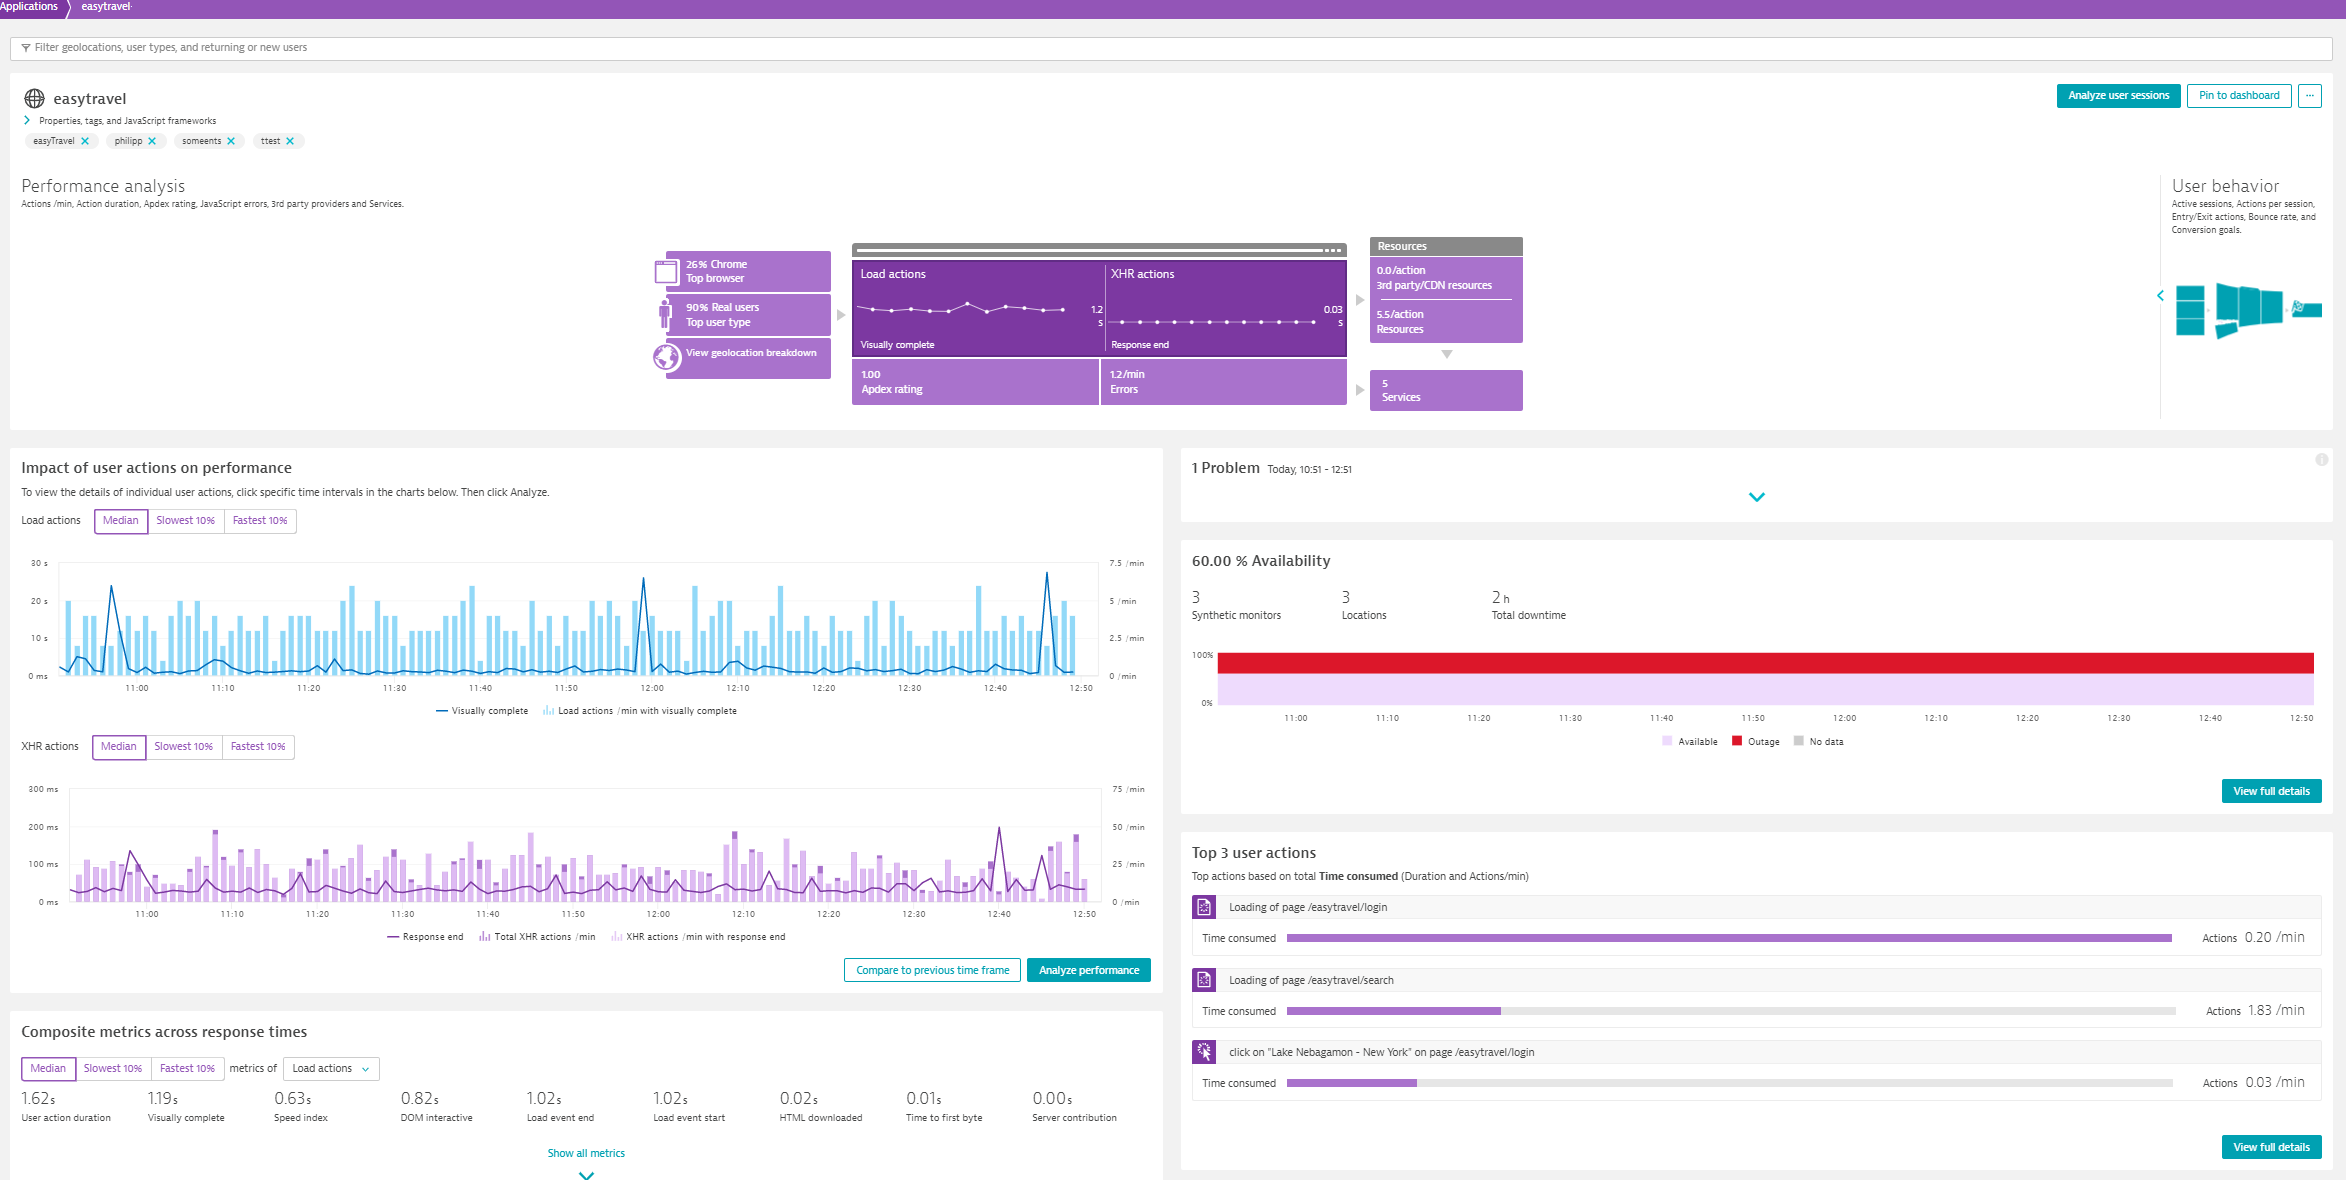
Performance analysis
The Performance analysis section displays a number of performance metrics for your application. To view the sections pertaining to performance analysis, expand the Performance analysis part of the infographic.
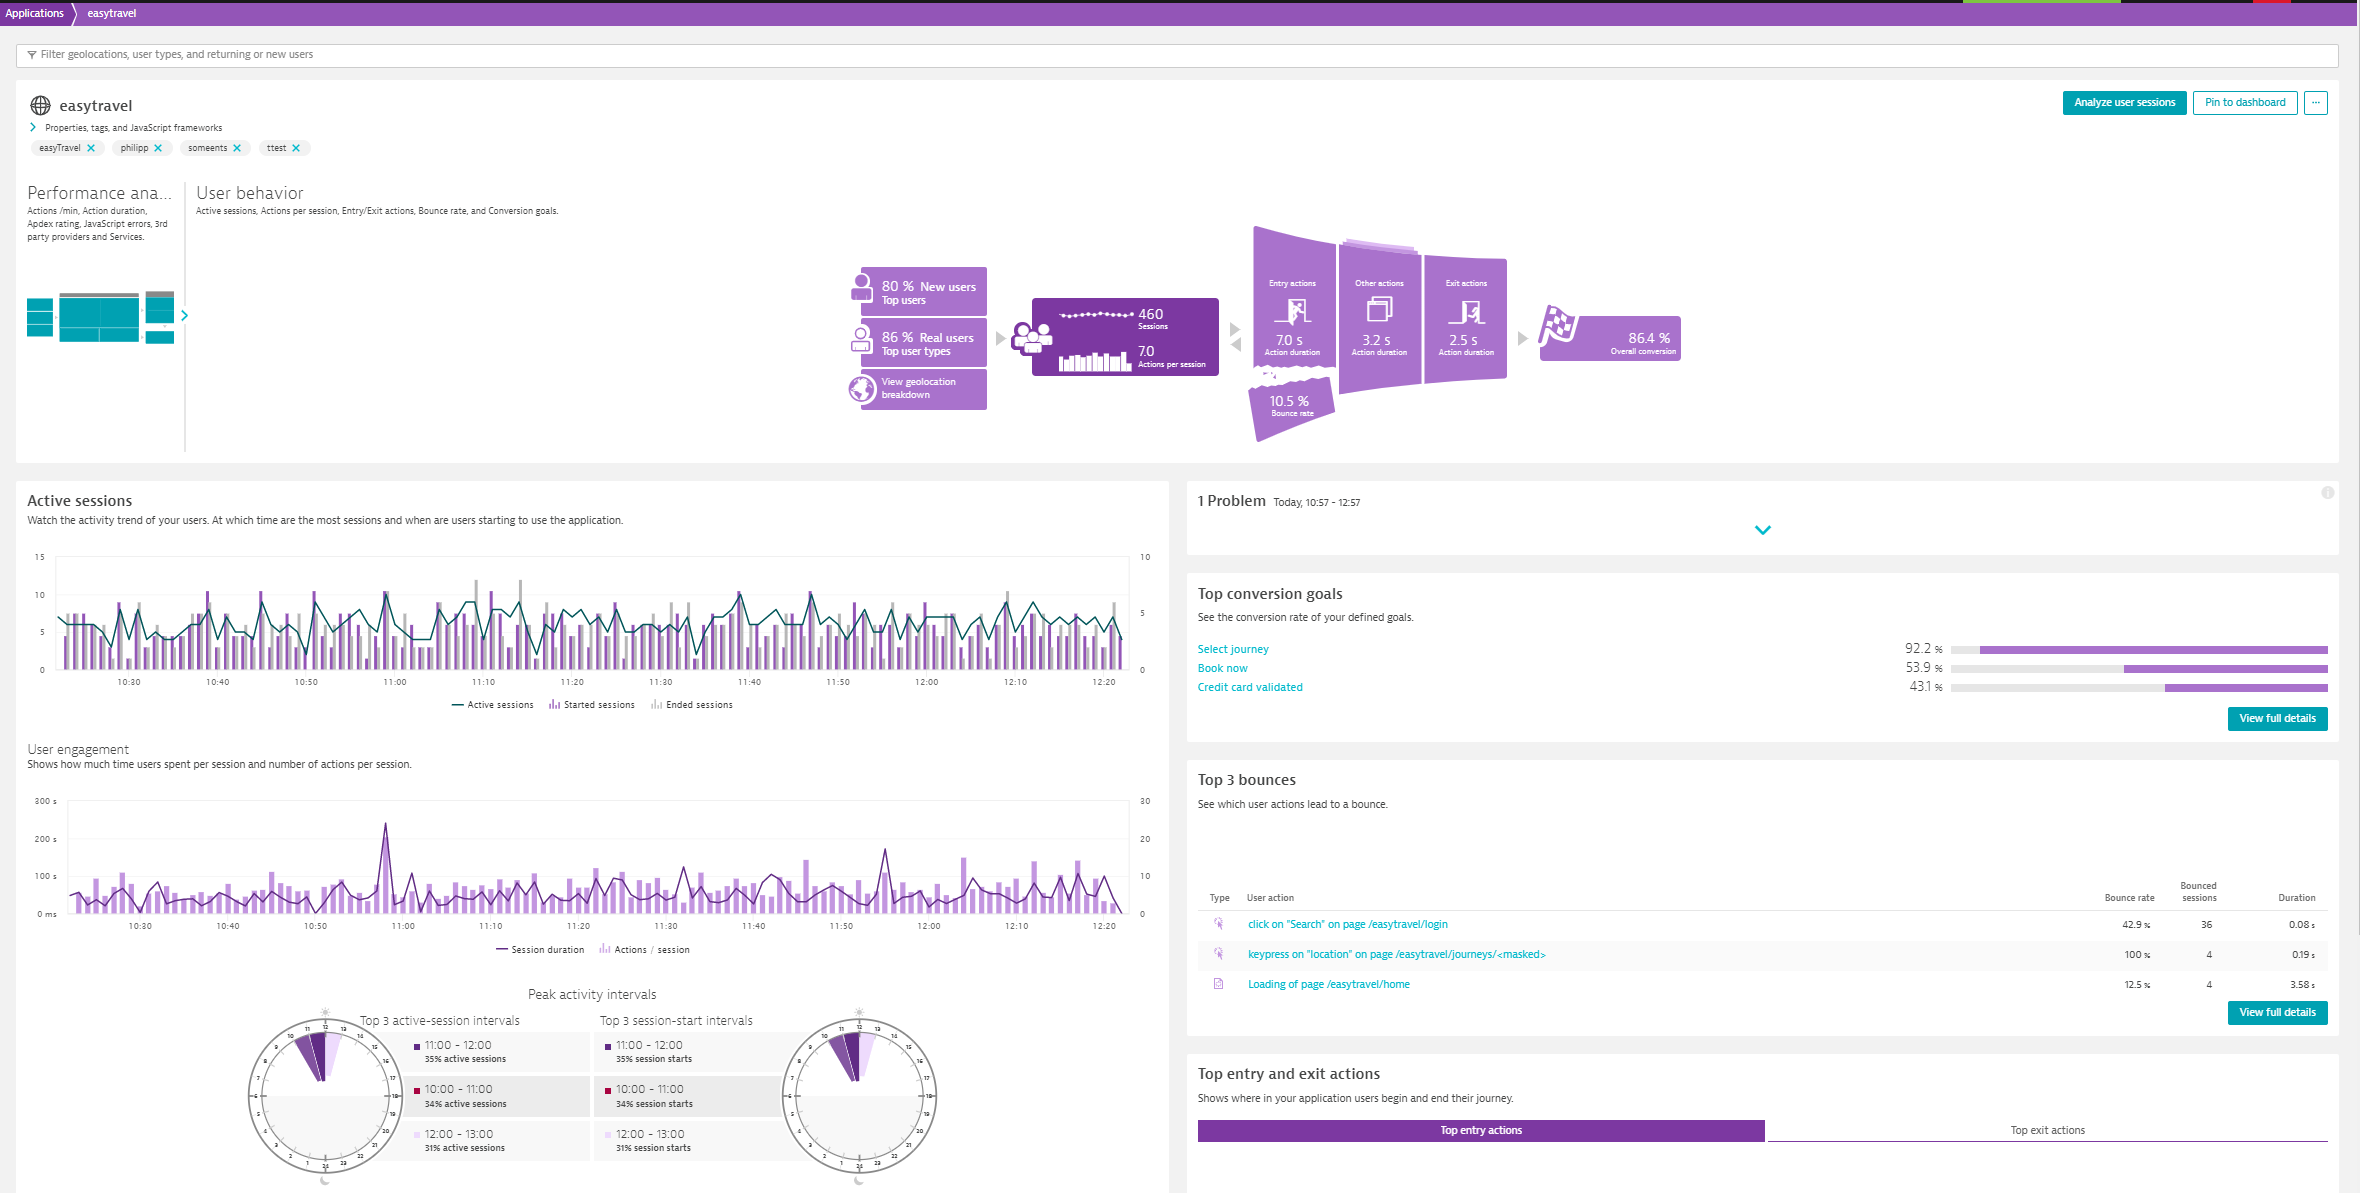
User behavior
The User behavior section displays a number of user behavior metrics for your application. To view the sections related to user behavior, expand the User behavior part of the infographic.
Analyze user sessions
By clicking Analyze user sessions in the top right corner, you can thoroughly analyze a user session from different dimensions.
Pin to dashboard
If you click Pin to dashboard in the top right corner, you can add a tile for performance or user behavior analysis (based on which part has been expanded) to the dashboard of your preference for a quick analysis view.
Application settings
You can access the application settings by clicking the browse button (...) in the top right corner and selecting Edit.
Top findings
If you click the browse button (...) in the top right corner and select Show top findings, you will access the Hyperlyzer, where you can see top findings regarding where your users are located, what browser version they're using, their operating system, and the user actions the application has received, sorted by action duration in a descending order (the slowest actions are regarded top findings, as these are the problematic ones that need to capture your attention).
Smartscape view
You can access Smartscape view by clicking the browse button (...) in the top right corner and selecting Smartscape view. Smartscape offers a quick but at the same time detailed overview of all the topological dependencies of your application.