Use custom metric events for alerting
DESK Davis automatically analyzes abnormal situations within your IT infrastructure and attempts to identify all relevant impacts and root-causes. Davis relies on a wide spectrum of information sources, such as a transactional view of your services and applications, as well as all events that are raised on individual nodes within your Smartscape topology.
There are two main sources for single events in DESK: events that are triggered by a series of measurements (known as metric-based events) and events that are independent of any metric (for example, process crash, deployment changes, and VM motion events).
This page explains how to leverage metric-based events within your DESK monitoring environment.
Choose your event severity
Custom metric events are configured on the environment global level. This means that an event, once defined and raised, is shown for all DESK users within your environment. Open Settings > Anomaly Detection > Custom events for alerting to define a new custom metric event, as shown in the screenshot below:
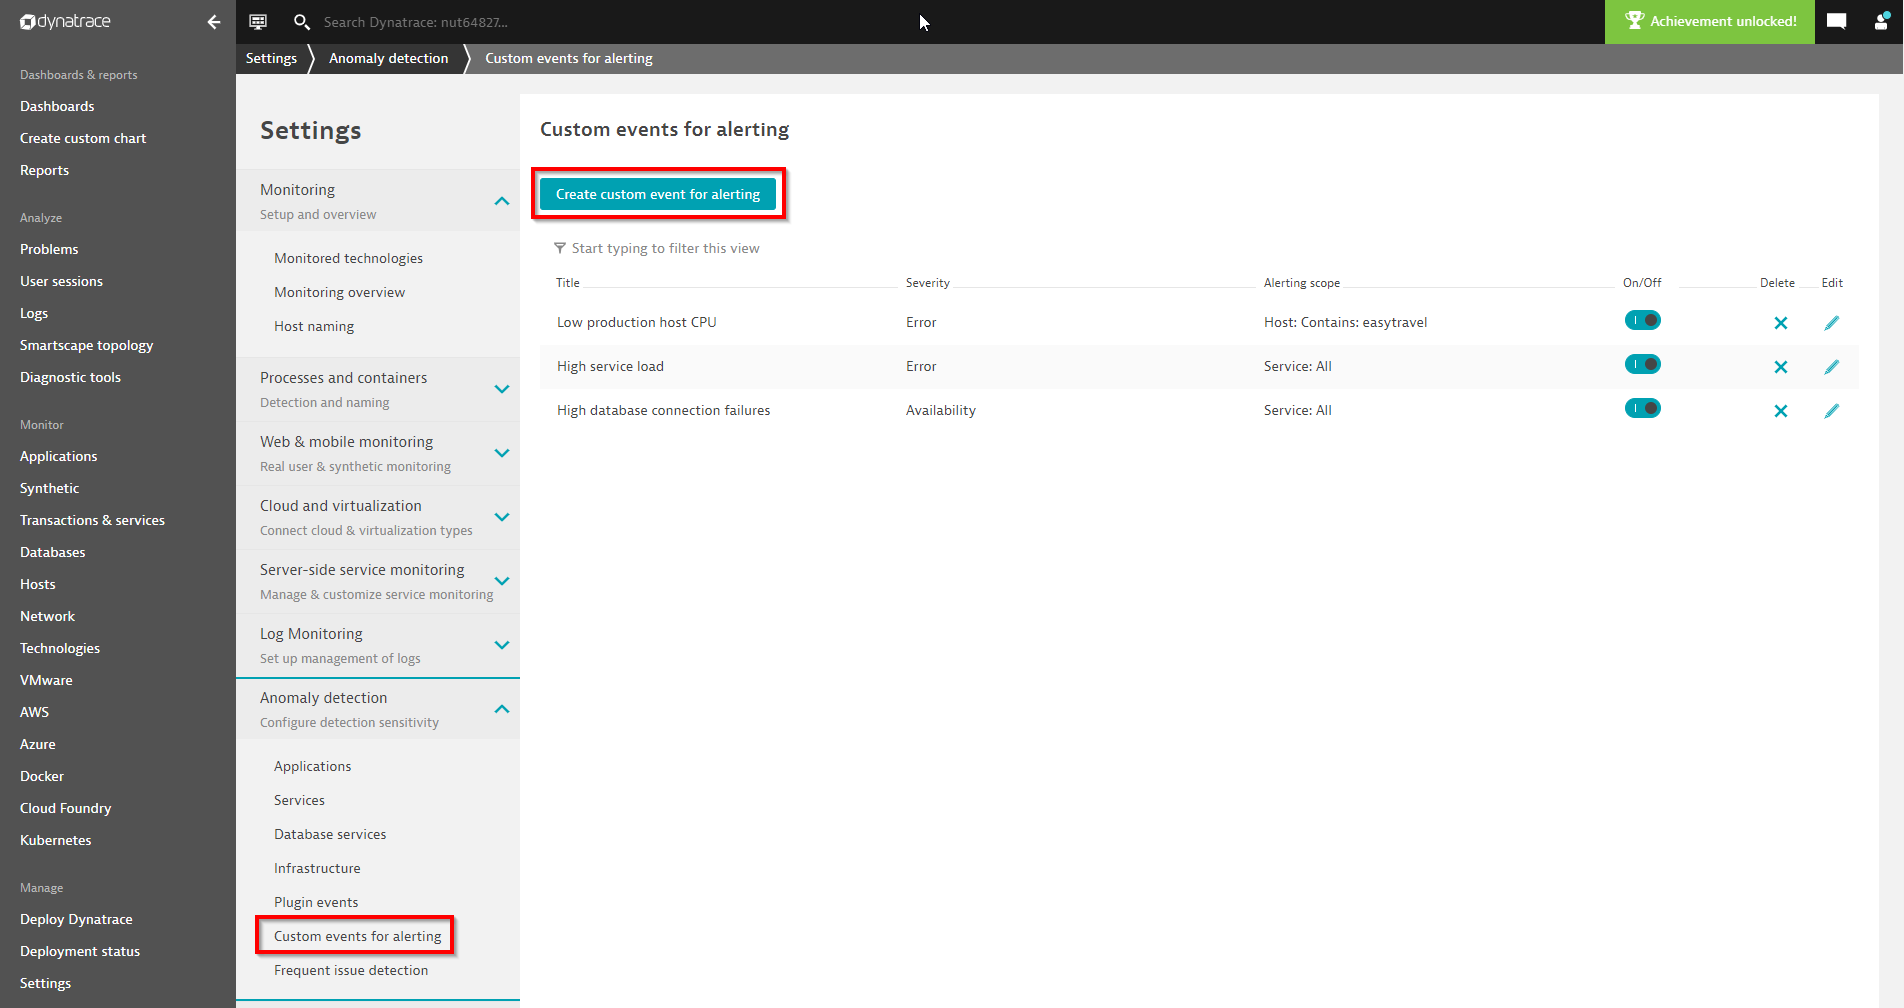
A click on Create custom event for alerting opens the configuration page that allows admin users to define a metric-based event in a step-by-step process.
Choose the title and severity of your event
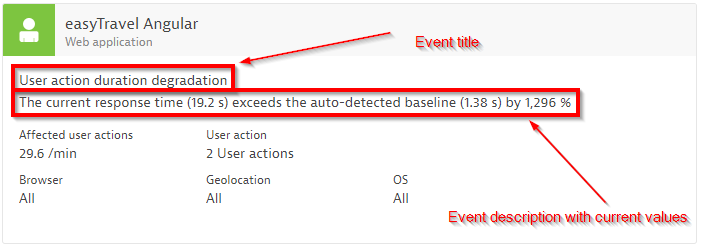
The event title is a short, human-readable string that describes the situation in an easily comprehensible way. Examples here could be High network activity or CPU saturation. Event titles are used throughout the DESK UI as well as within problem alerting. See the example screenshot below:
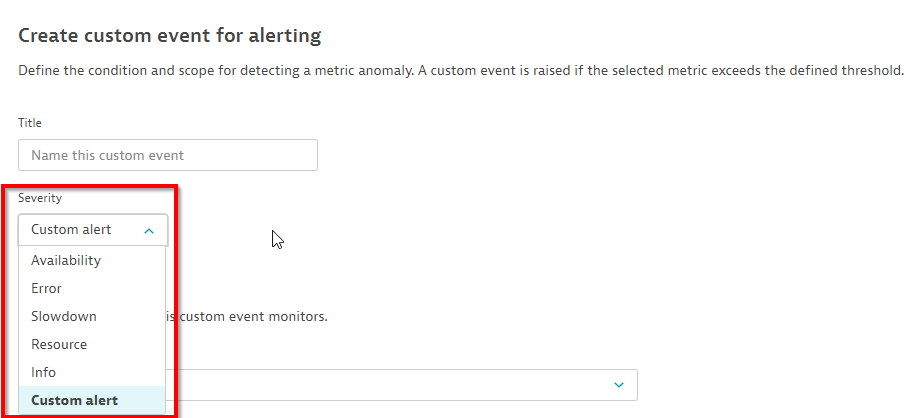
After assigning a proper name for your custom event, you must specify the severity of the event. The severity of an event determines if a problem should be raised or not and if Davis AI should try to find the root cause of your given event. See the screenshot below which shows how to select the severity of your event:
The following table summarizes the semantics of all available event severities, which severity triggers a problem and which severities are analyzed by Davis:
| Severity | Problem raised? | Davis analyzed? | Semantic |
|---|---|---|---|
| Availability | Yes | Yes | Reports any kind of severe component outage |
| Error | Yes | Yes | Reports any kind of degradation of operational health due to errors |
| Slowdown | Yes | Yes | Reports a slowdown of an IT component |
| Resource | Yes | Yes | Reports a lack of resources or a resource-conflict situation |
| Info | No | Yes | Reports any kind of interesting situation on a component, such as a deployment change |
| Custom alert | Yes | No | Triggers an alert without causation and Davis AI involved |
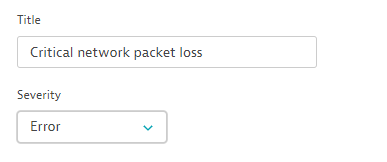
Read more about built-in events and their severity levels at Event types. This example calls a new event Critical network packet loss with a defined severity of Error, as shown below:
Choose the metric to monitor
One of the most essential aspects of a metric-based event is selecting the metric and optionally a metric dimension that should be monitored. The metric picker offers a structured list of all available metrics within your DESK monitoring environment. The logic structure of the metric categories follows the same consistent strategy as for creating a custom chart on a dashboard or when requesting a metric through the metric API.
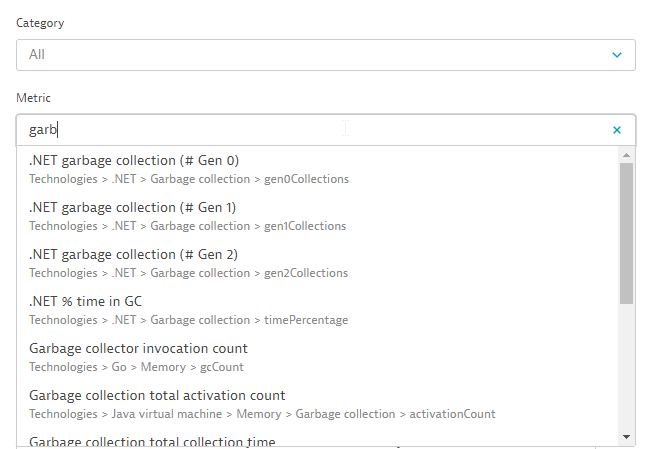
Within the metric picker you either start searching for a metric in all categories, or you select a category and search within that category, as shown below:
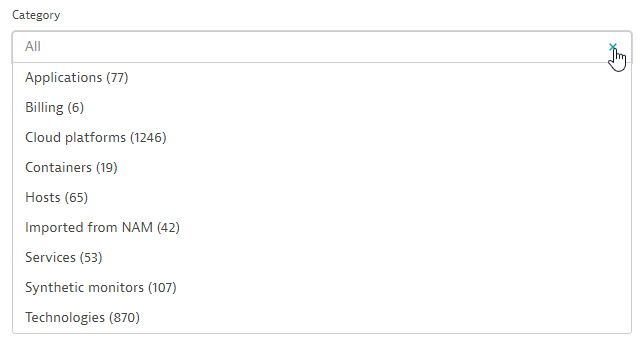
Alternatively, you select a category and browse the metrics that DESK offers in a selected category:
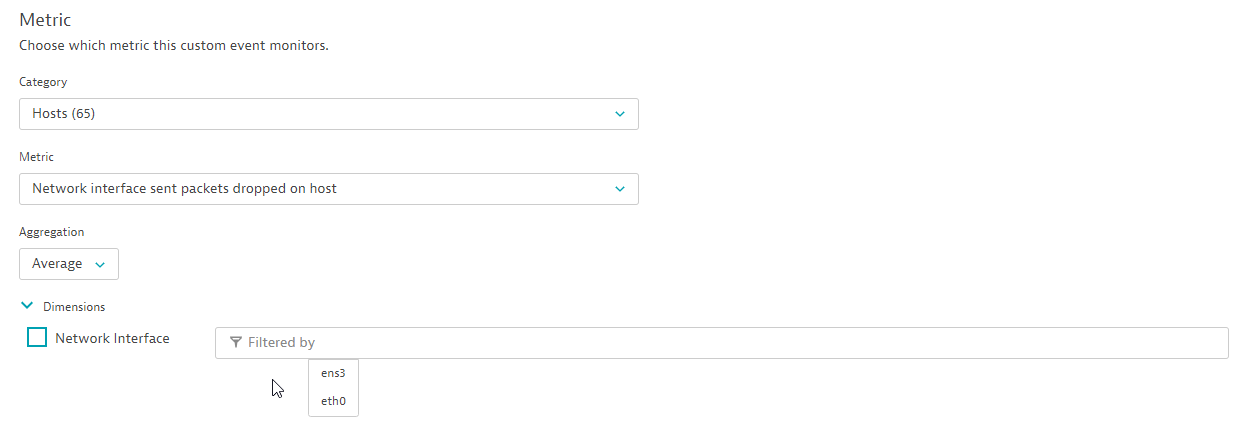
Within this example, the network metric Network interface sent packets dropped on host is selected, as shown below. No additional dimension filter for a network interface is defined, the metric event will be raised on all network interfaces on the selected hosts.
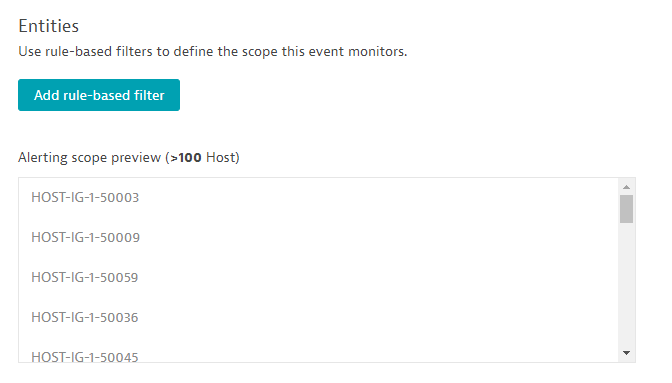
The next step is to define the event’s scope as a subset of all the hosts you are monitoring within your environment. After selecting the metric, all entities that supply that metric are counted and shown in the preview section. In our monitoring environment there are more than 100 hosts that supply the selected metric. The preview only displays a maximum of 100 entities. Even if the preview shows a maximum of 100 entities, you can nevertheless set a threshold on a larger group of hosts. We don't recommend that you define a shared threshold on a huge and heterogeneous collection of entities as this would result in a large number of alerts. See the screenshot below:
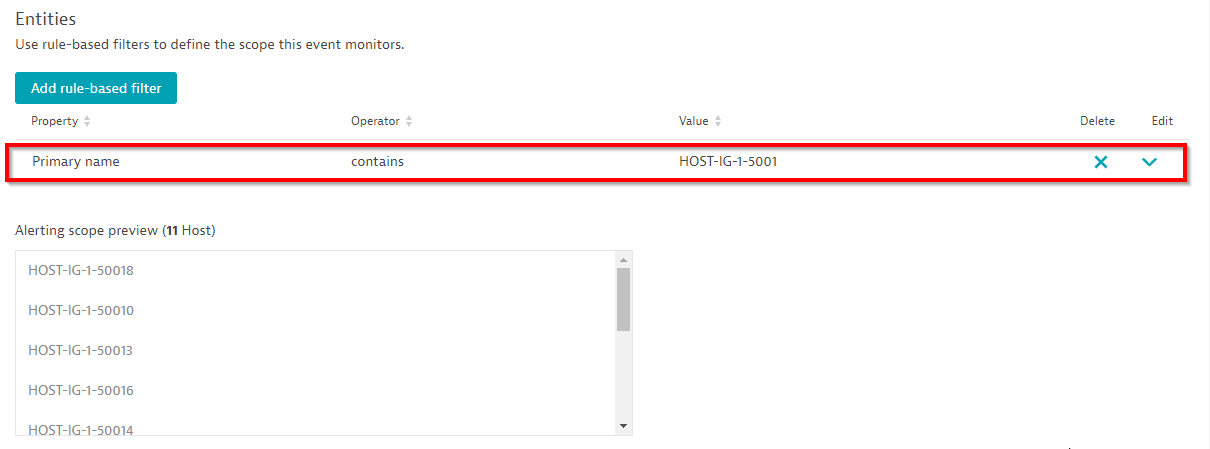
Use convenient scope filters such as host group, management zone, name and tag filters depending on how you organize your entities. In many cases a naming convention of all your hosts, along with a dedicated name filter does a good job of defining alerting scopes, as shown below:
Davis automatically recommends a baseline threshold
If the number of entities within your scope is below 100, Davis offers a convenient preview of how many alerts would have been triggered over a period of the last 12 hours. Alternatively, you can select and analyze the last day and the last week for the number of potential alerts you would have received based on historic measurements. Another great feature on this page is that Davis automatically suggests a threshold for a baseline of the selected group of hosts, as shown below:
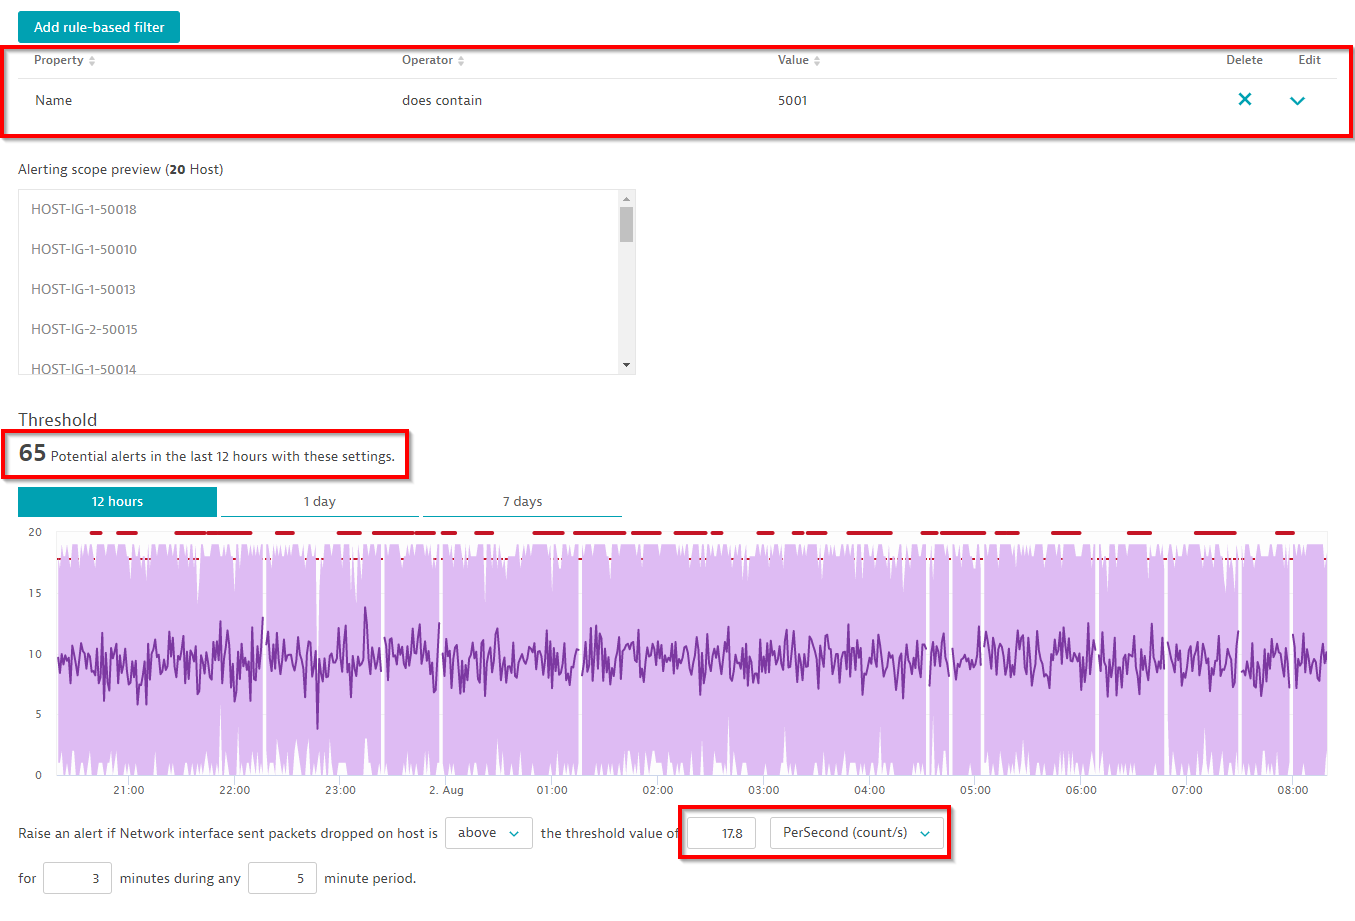
Davis automatically analyzes the past to count the number of alerts
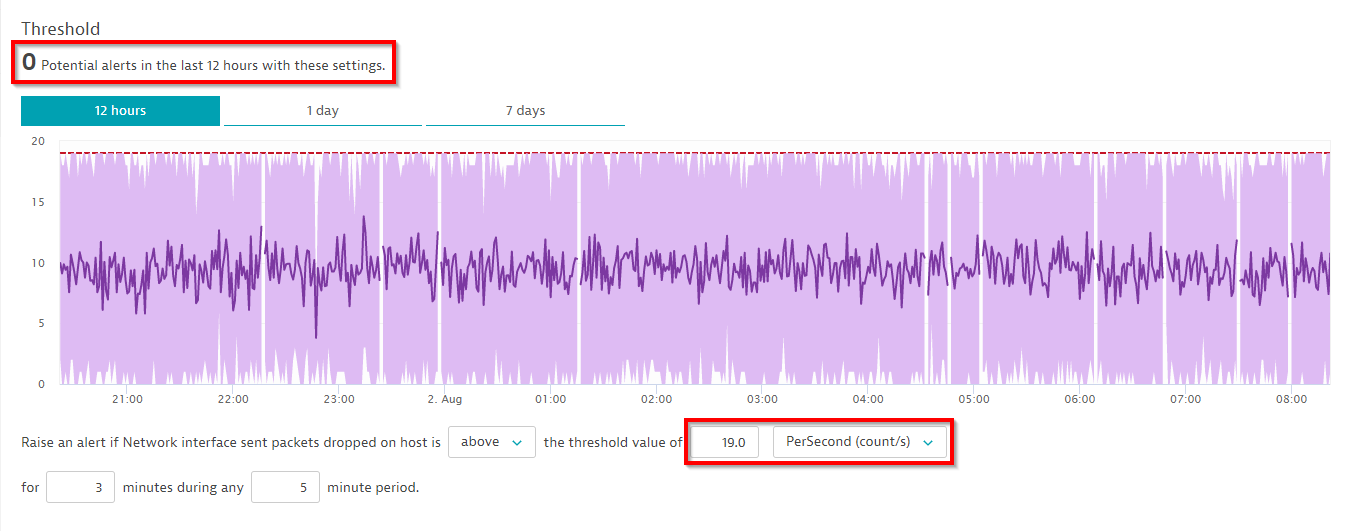
Within the example above, the configured threshold of 17.8 packet errors per second still results in quite a high number of 65 events within the last 12 hours. One way to improve this is either to increase the baseline threshold to 19 per second and/or to specify a larger sliding window of 5 out of 10 minutes to avoid alert spam. Let’s see how that change works out in our example:
Customize your event message
The last step before you go live with your newly created event is to review the event message. Use the four placeholders {metricname}, {severity}, {alert_condition}, and {threshold} to fill the text message with the actual values.
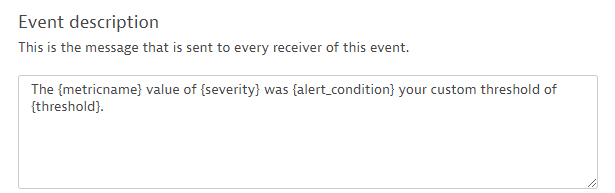
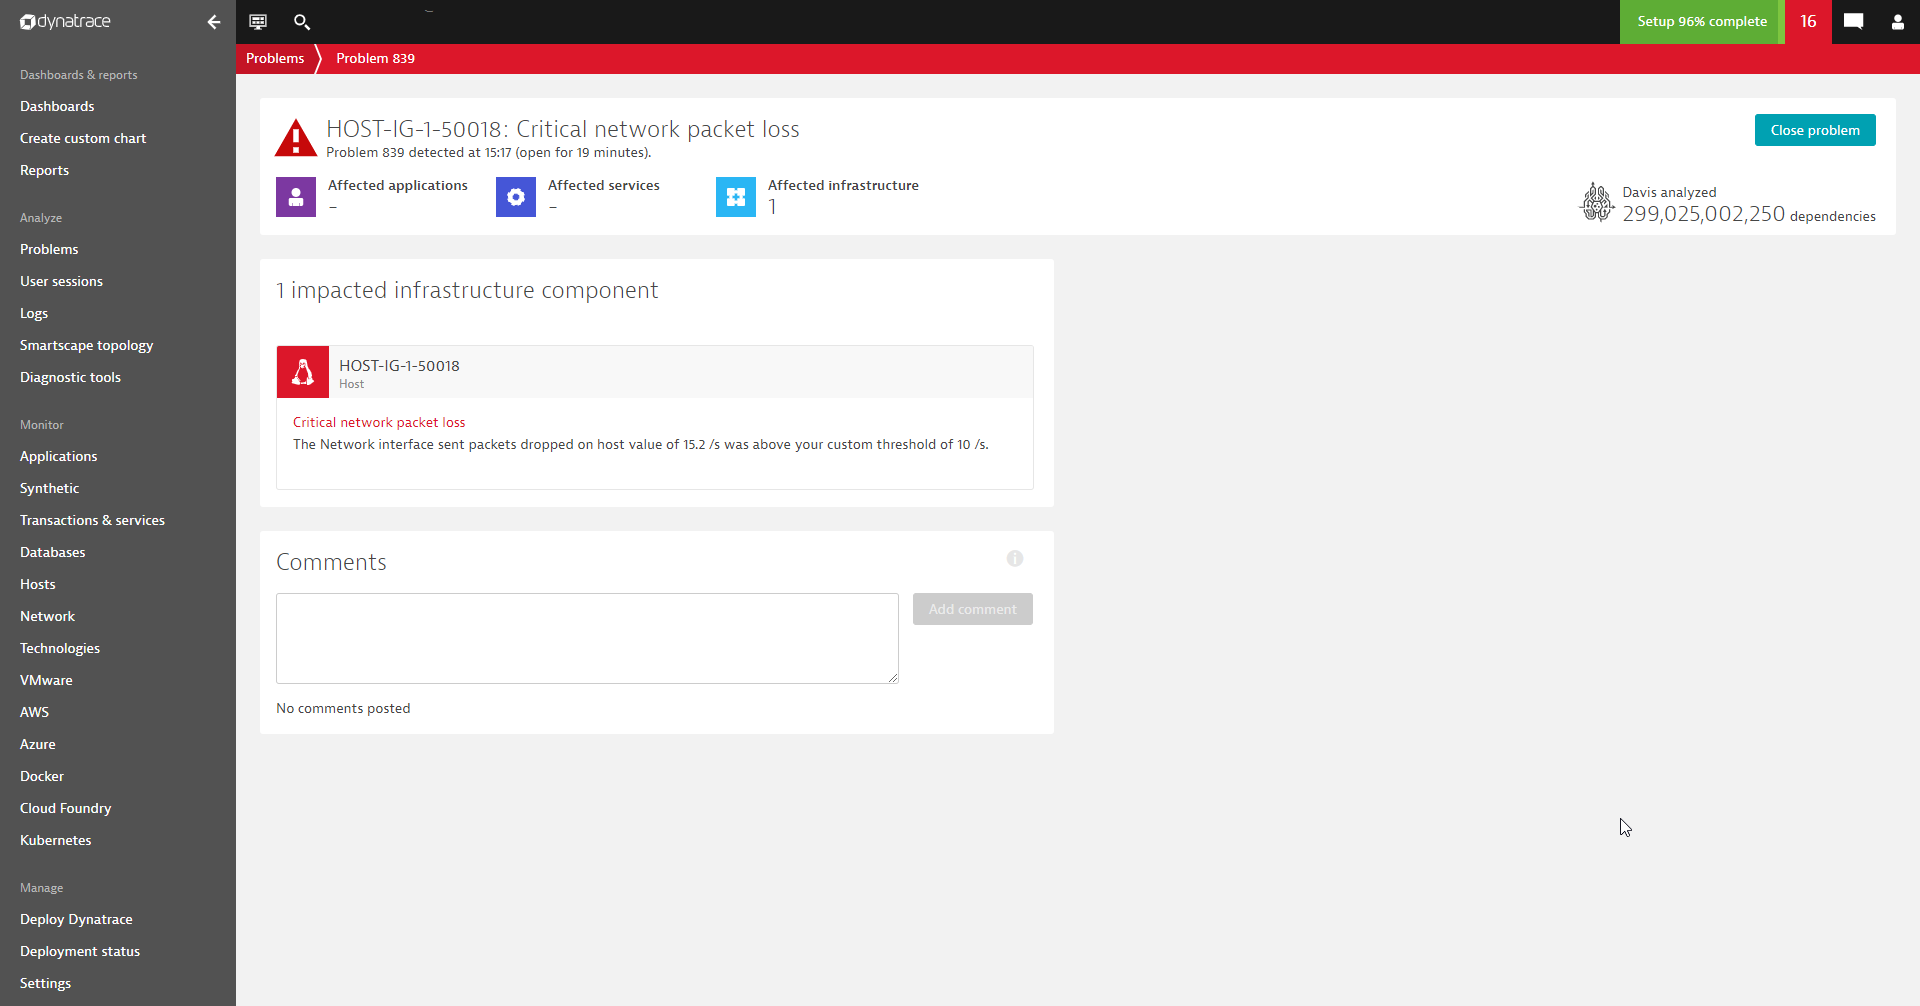
The first time that your event is triggered this description message will be displayed: The Network interface sent packets dropped on host value of 24 was above your custom threshold of 19. Adapt the event description to your own needs and, finally, save the custom event definition.
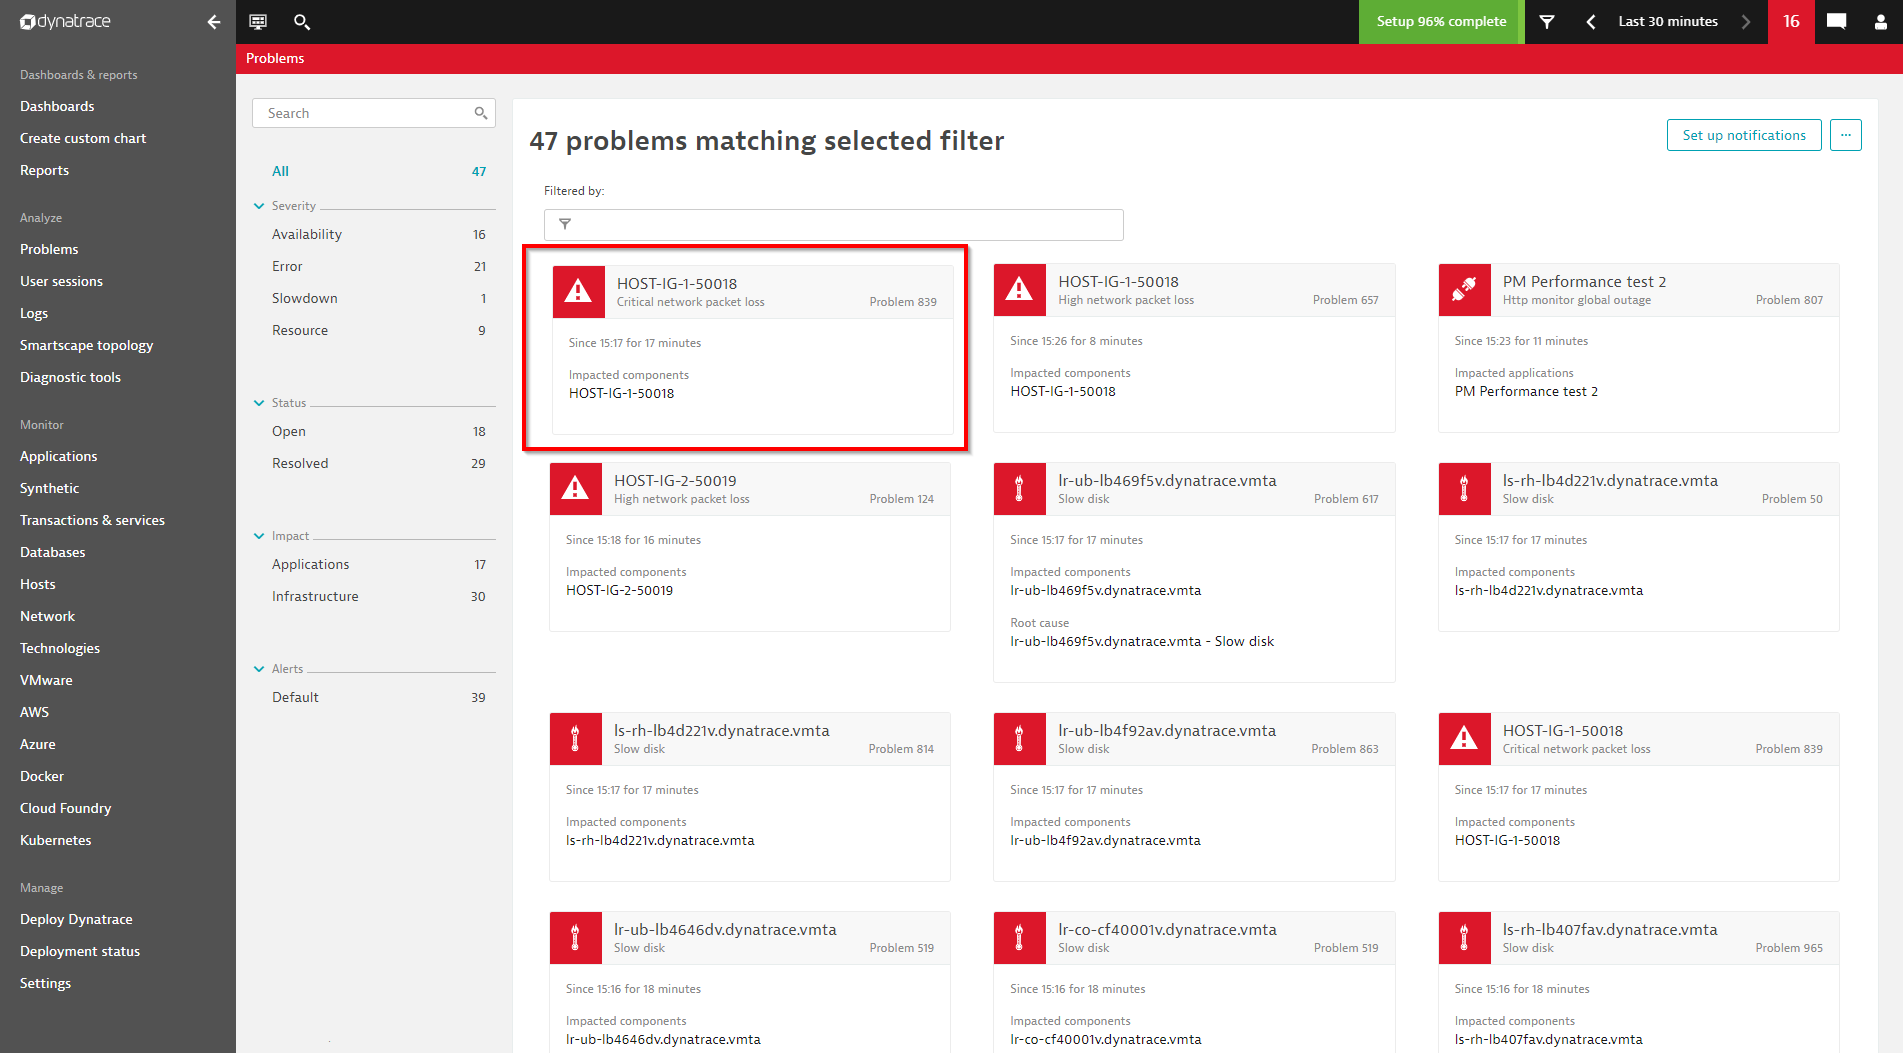
See the two screenshots of the configured event below and how it is visualized in the DESK problem feed:
Automate the definition of metric events using the API
All the functionality that was shown within the above sections is also fully available through the DESK configuration API.
All your configured metric events can be received by calling the HTTP REST interface /api/config/v1/anomalyDetection/metricEvents.
As usual, the configuration API offers methods for listing all the defined configurations, updating individual configurations, creating new configurations, and deleting existing conigurations.
For further details, see Configuration API.