Where can I monitor my services?
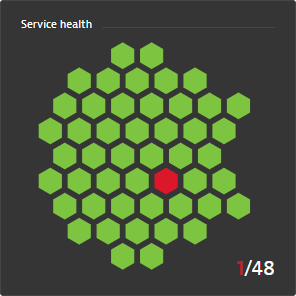
The Services health dashboard tile is a great place to view the monitored services running in your environment. This tile provides an overview of all services monitored by DESK including the number of services experiencing performance degradation. This high-level visualization provides an easily digestible view, which makes it a great fit for management dashboards.
In the service health tile below, it is indicated that there is a problem with one service (red hexagon). If you click the tile, you will navigate to the Services page, where the impacted service will be listed at the top.
To add the Services health tile to a specific dashboard
- Navigate to Transactions and services.
- Click Pin to dashboard in the top right corner.
- Type in the name of the dashboard you want to pin the Services health tile to.
- Click Pin.
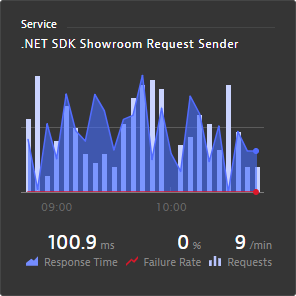
You can also view performance details for each service through the Service tile. In the example below, the Service tile shows the average Response Time and Failure Rate as well as the number of Requests per minute, which are three key performance indicators for monitoring service quality.
To add the Service tile to a specific dashboard
- Navigate to Transactions and services.
- Select the service you want to monitor.
- Click the Browse button (...) and select Pin to dashboard
- Type in the name of the dashboard you want to pin the Service tile to.
- Click Pin.
Alternatively, you can add both tiles to the dashboard of your preference by going to this dashboard, clicking Edit and selecting them from the available tiles. You can read more about customizing a dashboard in Create custom dashboards.