Resource events
This page provides information about supported resource events, along with the logic behind raising them.
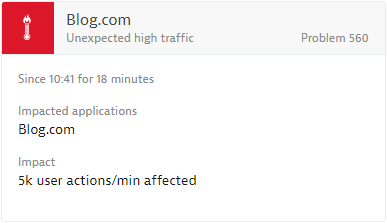
Unexpected high traffic
UNEXPECTED_HIGH_LOAD
DESK collects a multidimensional baseline for application and user action traffic and thereby learns the typical traffic patterns of all your applications and user actions. Alerting on abnormal high application traffic is an opt-in option in application settings at Settings > Anomaly detection > Applications. If enabled, DESK follows a two-seasonal pattern (daily and weekly) in alerting on abnormal traffic situations. The actual monitored application traffic is compared with the same period of last week and alerts if the comparison reports unusually high traffic.
See a typical unexpected high traffic event example below.
Applicable DESK entities
The following DESK entities apply to this event:
- Service
- Application
- Mobile application
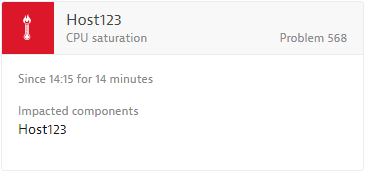
CPU saturation
CPU_SATURATED
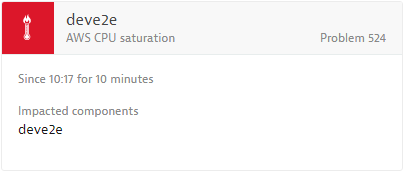
CPU saturation events are raised on the host level when CPU usage rises above a critical threshold. By default, DESK alerts if CPU usage is higher than 95% in 3 of 5 consecutive one-minute intervals. Along with the typical OneAgent-related CPU saturation event, AWS cloud management can report CPU saturation events for EC2 instances. In case of a OneAgent-monitored EC2 instance, DESK prioritizes OneAgent events over AWS events. If one of your EC2 instances isn't monitored by OneAgent, but you have an active AWS integration and DESK setup, a CPU saturation event will be raised.
See a typical CPU saturation event example below.
The screenshot below shows a CPU saturation event, raised through AWS integration.
Applicable DESK entities
The following DESK entities apply to this event:
- Host
- Hypervisor
- Relational database service
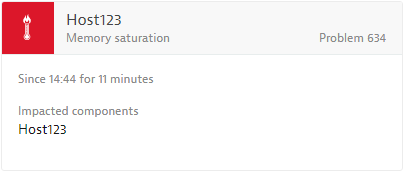
Memory saturation
MEMORY_SATURATED
By default, DESK alerts if memory usage is higher than 90% on Windows or 80% on Linux AND the memory page fault rate is higher than 100 faults/s on Windows or 20 faults/s on Linux within 3 of 5 one-minute intervals. See example below:
Applicable DESK entities
The following DESK entities apply to this event:
- Host
- Hypervisor
- Relational database service
Low disk space
LOW_DISK_SPACE
By default, DESK alerts if free disk space on any of your disks falls below 3% in at least 3 of 5 1-minute observation intervals. Disk thresholds within DESK are highly configurable, both at the host level and the global settings level. To support large numbers of disks, you can define global disk threshold rules along with flexible tag filters to group subsets of hosts.
See a typical low disk space event example below.

Applicable DESK entities
The following DESK entities apply to this event:
- Host
Slow disk
SLOW_DISK
By default, DESK alerts if disk read and write time on any of your disks is higher than 200ms in at least 3 of 5 one-minute observation intervals. Disk thresholds in DESK are highly configurable, both at the host level and the global settings level. To support large numbers of disks, you can define global disk threshold rules along with flexible tag filters to group subsets of hosts.
See a typical slow disk event example below.

Applicable DESK entities
The following DESK entities apply to this event:
- Host
- Hypervisor
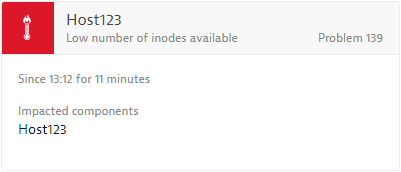
Low number of inodes available
HOST_DISK_LOW_INODES
By default, DESK alerts if the percentage of available inodes on any of your disks is lower than 5% in at least 3 of 5 one-minute observation intervals. Disk thresholds within DESK are highly configurable, both on the host level and the global settings level. To support a large numbers of disks, you can define global disk threshold rules along with flexible tag filters to group subsets of hosts.
See a typical low number of inodes available event example below.
Applicable DESK entities
The following DESK entities apply to this event:
- Host
High network utilization
HIGH_NETWORK_UTILIZATION
By default, DESK alerts if sent/received traffic utilization is higher than 90% in 3 of 5 one-minute observation intervals.
See a typical high network utilization event example below.

Applicable DESK entities
The following DESK entities apply to this event:
- Host
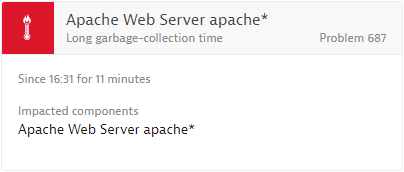
Long garbage-collection time
HIGH_GC_ACTIVITY
By default, DESK alerts on long garbage-collection times if garbage-collection time is higher than 40% or suspension is higher than 25% in 3 of 5 one-minute observation intervals.
See a typical long garbage-collection time event example below.
Applicable DESK entities
The following DESK entities apply to this event:
- Process group instance
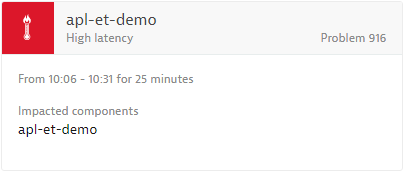
High latency
HIGH_LATENCY
By default, DESK detects and alerts on high latency within your relational database services (RDS).
See a typical high latency event example below.
Applicable DESK entities
The following DESK entities apply to this event:
- Relational database service
I/O commands queued
INSUFFICIENT_DISK_QUEUE_DEPTH

Applicable DESK entities
The following DESK entities apply to this event:
- Hypervisor
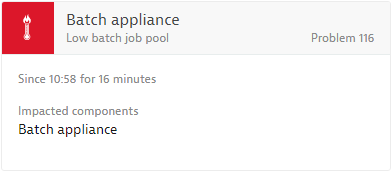
Custom resource contention event
RESOURCE_EVENT
This generic resource contention event can be used by monitoring plugins or through the DESK REST API to raise a customized resource contention event with a user-defined title.
An example might be a custom resource contention event with a user-defined title Low batch job pool, as shown below:
Applicable DESK entities
All DESK entities apply to this event.