Synthetic details for browser monitors
Select a synthetic monitor in the Synthetic monitors page to open the Synthetic details page, which provides an overview of execution results, their visualization, and monitor properties. Powered by the DESK AI engine Davis, the Synthetic details page shows you at-a-glance information and graphs, with ready filters to drill right down to problem details or the waterfall for a failing action in a specific execution.

Metrics and visualizations
In the very top panel you can choose between visualizations of your monitor's availability or performance by selecting the left or right infographic, respectively. The performance view is customized to show a key performance metric along with Total duration. You can also scroll through reference screenshots for each of your monitor's script events.
You select a key performance metric in monitor settings in edit mode.
Click the Browse button  in the top-right corner to access controls to Edit, Delete, or Disable the monitor. You can also view reports for browser monitors. Click Analyze synthetic sessions to see the User sessions page. You can pin a Browser monitor or HTTP monitor tile for the monitor to a dashboard. (You can then optionally view the tile in the dashboard in edit mode.)
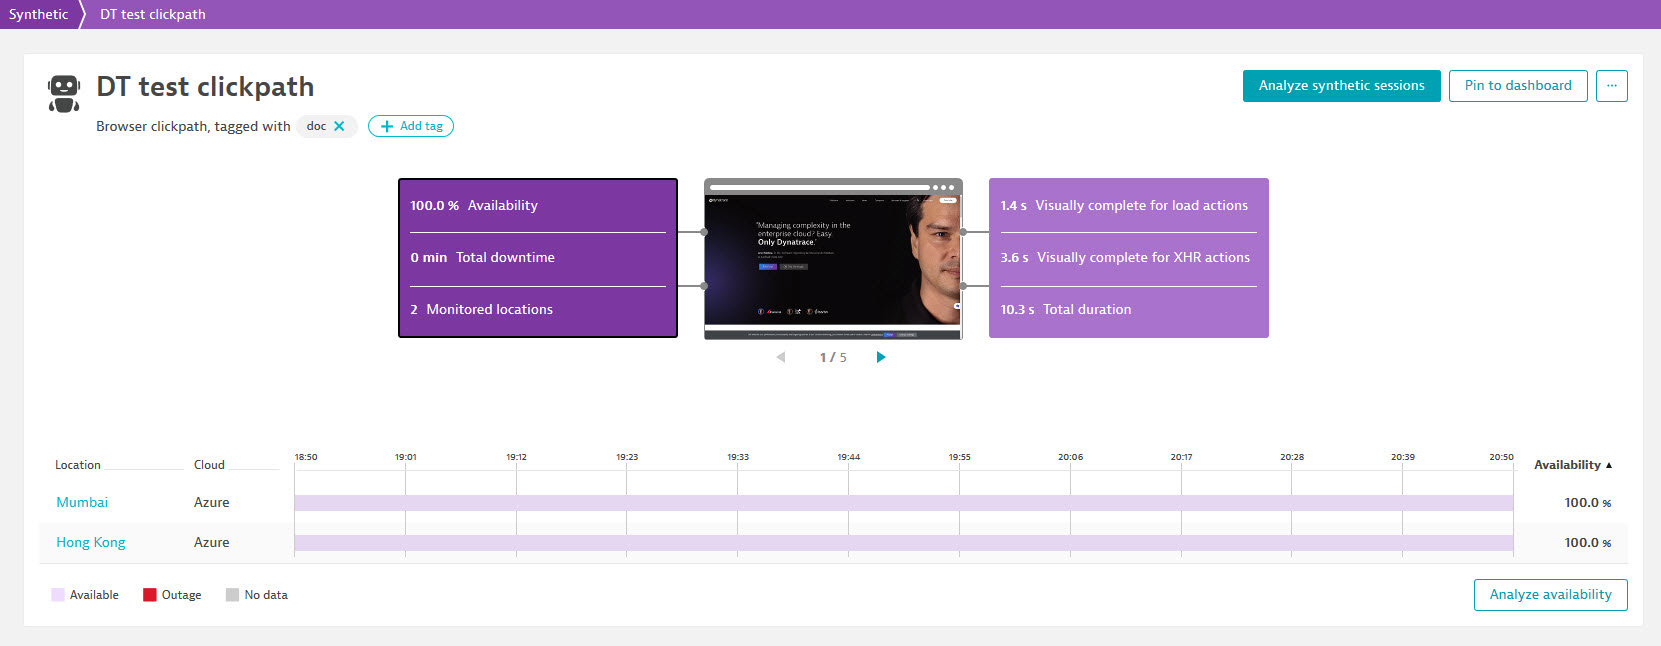
Availability
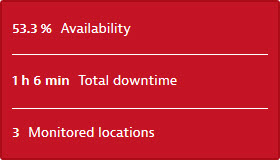
Click the availability box on the left to view a visualization of the monitor's availability for the global timeframe. If the monitor violates an availability threshold, global or local (defined in monitor settings), the box appears in red.
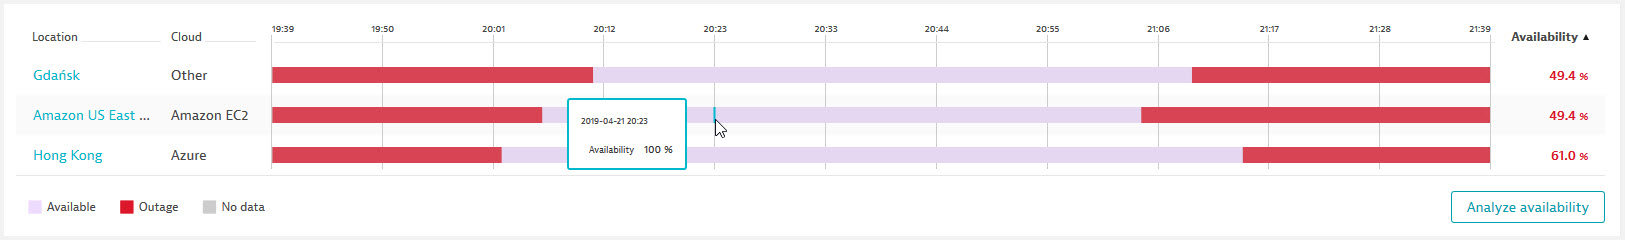
The graph shows availability for the global timeframe for each monitor location. You can sort locations by Location name, Cloud, or Availability.
Time periods with availability outages are blocked in red. Hover over any of the bars to view availability at a given point in time for that location.
Click any location name to see the Analysis page showing details of individual data points filtered by that location; or click Analyze availability to see data points for all locations.
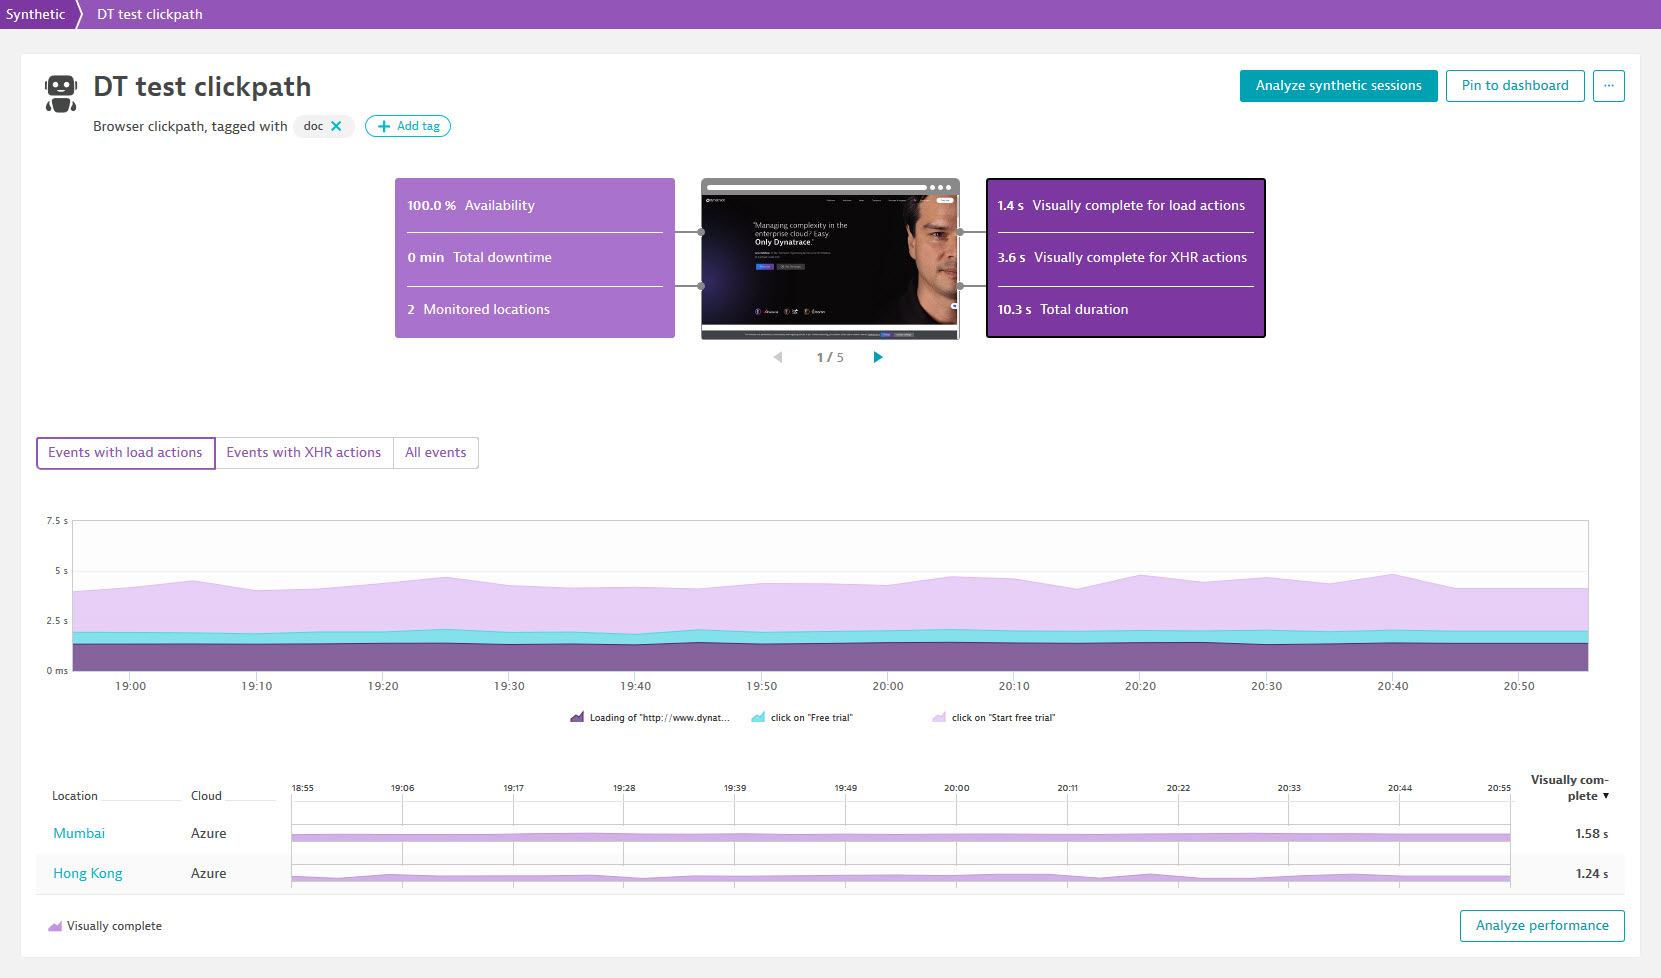
Performance
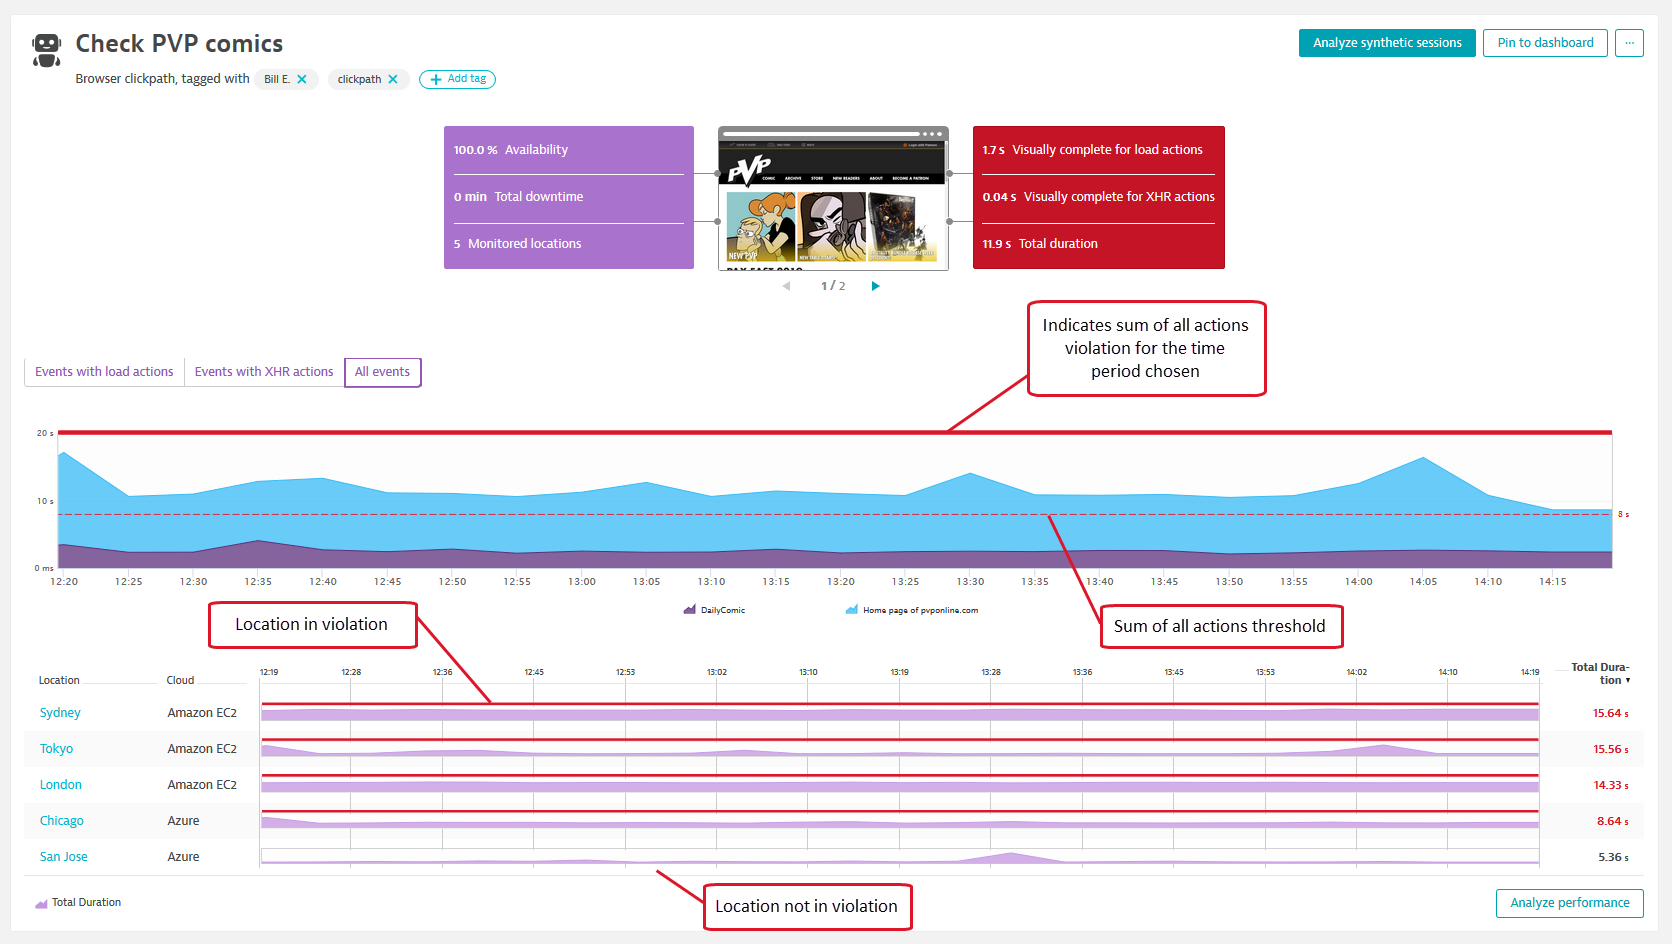
Click the box on the right to view a visualization of the monitor's performance for the global timeframe. If the monitor violates a performance threshold, whether for the sum of all actions or individual actions, the box appears in red.
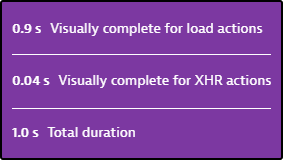
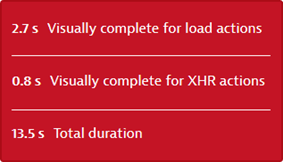
In addition to Total duration, you see average key performance metric (such as Visually complete) timings for load actions and XHR actions.
Key performance metrics enable you to choose performance goals that best fit the variable needs of each application you monitor. For example, you might want to choose User action duration to optimize the performance of a traditional web application. For other applications where the speed of user interaction is more important than the UI, you might want to optimize the time it takes for JavaScript resources to load. The default is Visually complete for both load and XHR actions as it measures how long it takes for the visible portion of each user’s browser screen to be fully rendered.
As DESK captures a list of key performance metrics out of the box, you can switch your selection in monitor settings and immediately have historical data available.
Note that while Total duration is calculated as a summation, key performance metric values are averages, calculated separately for load actions and XHR actions.
If you compare the top panel to the Synthetic events and actions card, you can see that performance is only calculated for actions, which are events that generate network activity—see Number of actions consumed by browser clickpaths for more information.
The graphs below show:
- Performance split by individual actions (across all locations) for the global timeframe.
- Performance split by location (for all actions) for the global timeframe.
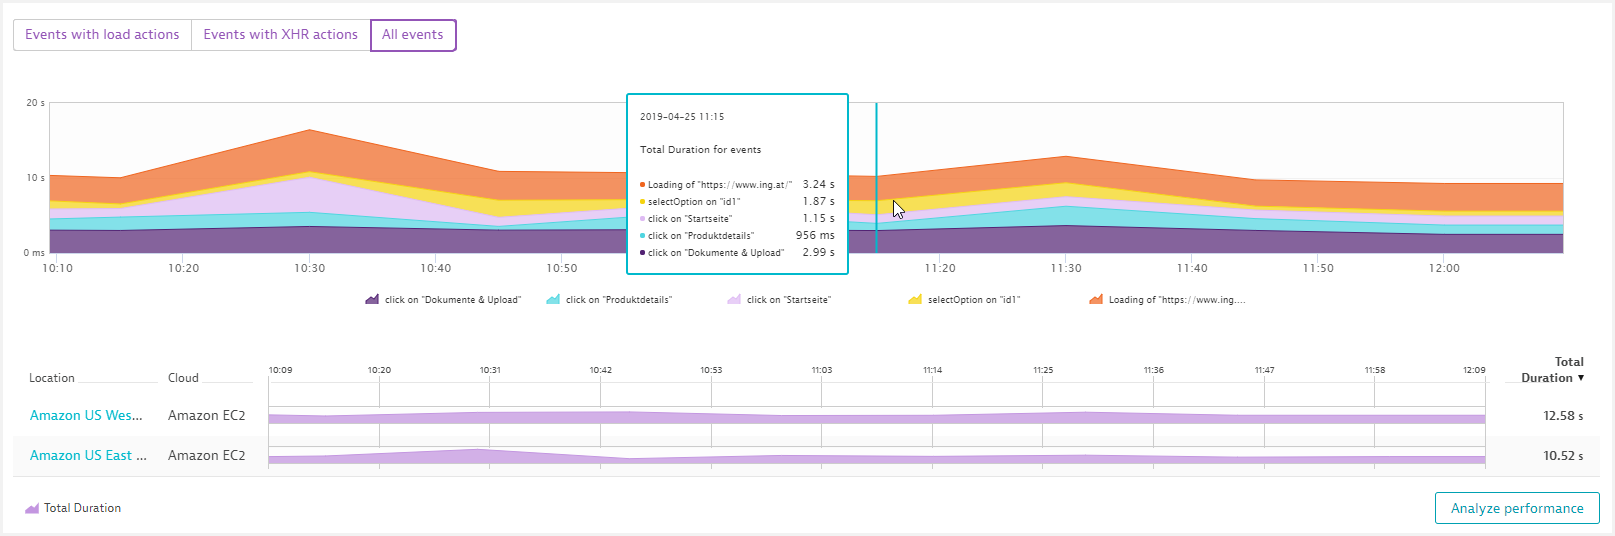
Events with load actions and Events with XHR actions show key performance metric graphs for individual events that trigger load actions and XHR actions, respectively. All events shows the Total duration for all events, split by individual events (events with no network activity are not included in performance graphs by definition). The location graphs adjust to match your selection.
Click an event name in the legend to include/exclude it from the stacked line graph. Hover over the stacked graph to see the performance (key performance metric or Total duration) of individual events at a given point in time.
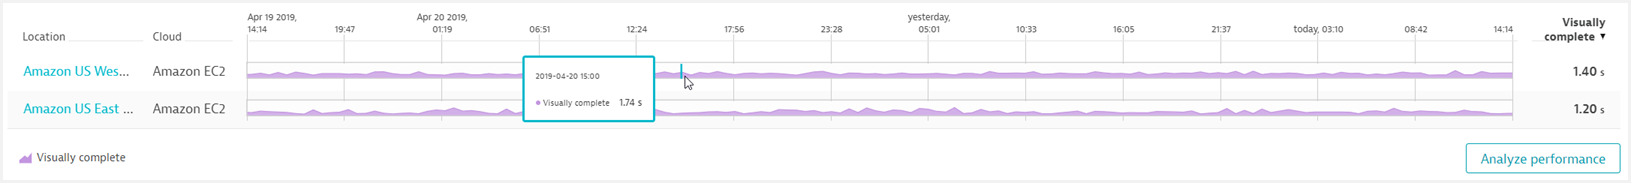
Hover over any of the location graphs to view performance at a given point in time for that location. The graph shows performance for the global timeframe for each monitor location. You can sort locations by Location name, Cloud, or performance metric (e.g., Visually complete).
Click any location name to see the Analysis page showing details of individual data points filtered by that location; or click Analyze performance to see all data points for the time range.
If there is a violation of the performance threshold for the sum of all actions, a solid red line appears above the All events stacked line graph for the duration of the problem; the threshold appears as a dotted red line. A solid red line also appears for locations violating the threshold.
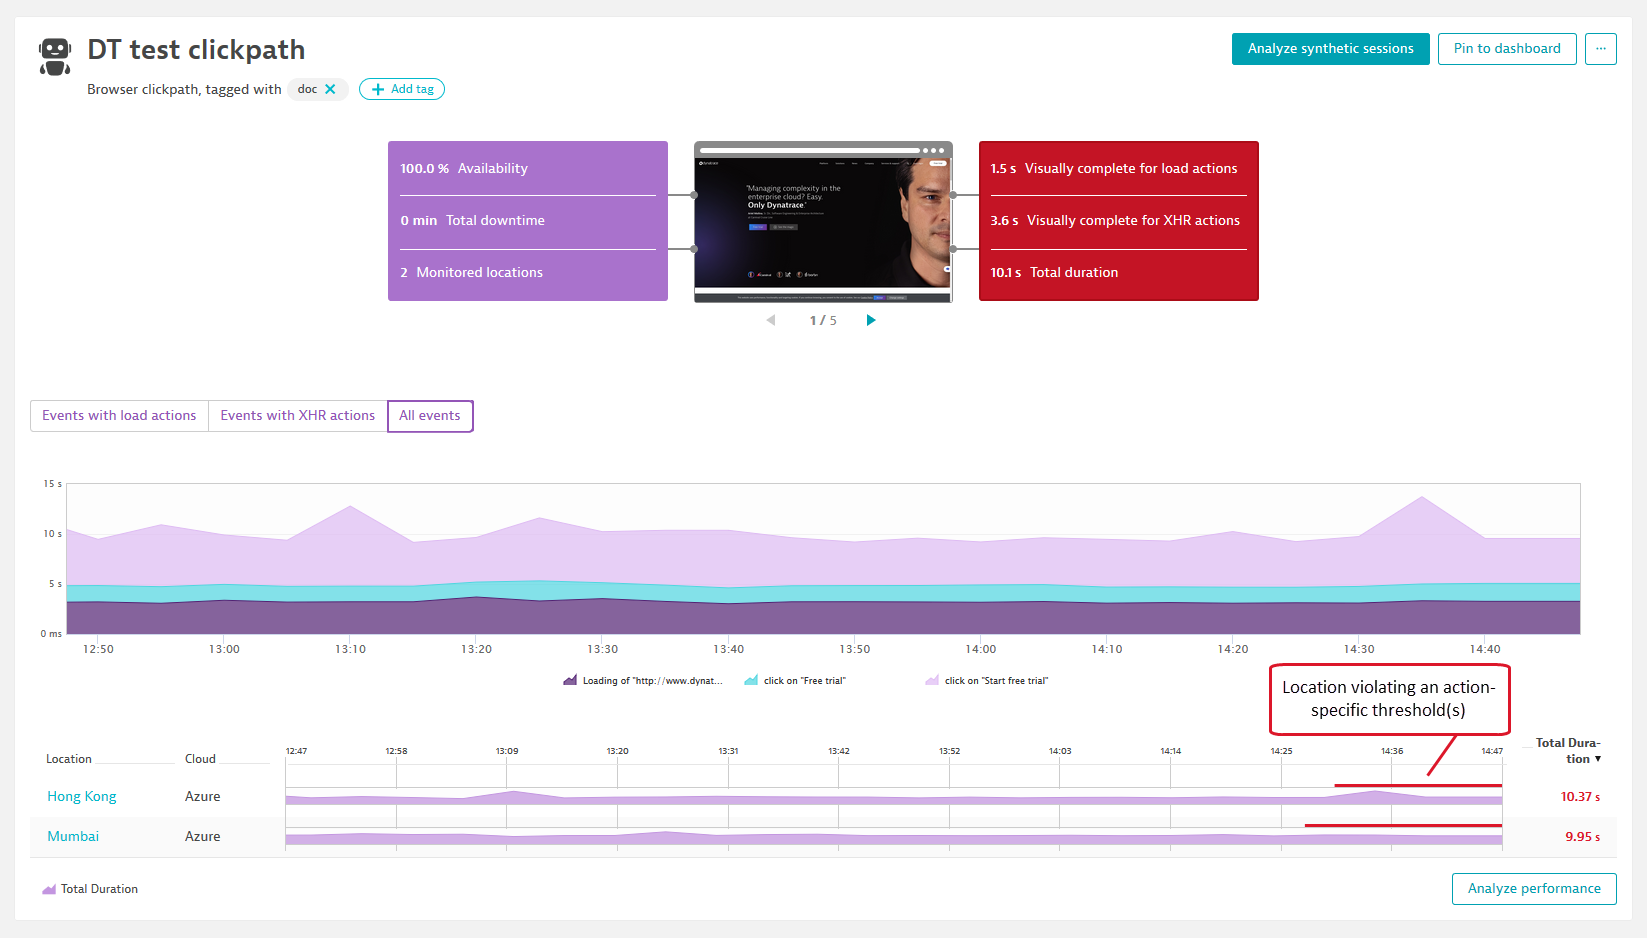
For a violation of an event-specific thresholds, only location graphs indicate violation. The Synthetic events and actions card highlights the events in violation, their duration, and the thresholds involved.
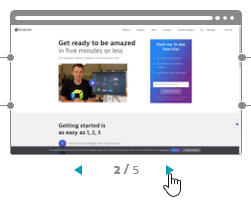
Screenshots
Reference screenshots available on the Synthetic details page are taken if the monitor runs successfully when the monitor is created or edited, and thereafter, once every 24 hours from a random monitor location (including private locations). Screenshots are taken at the end of each script event (even those without timings). You can scroll through screenshots here or click an image to scroll through enlarged versions.
Note that reference screenshots are always the most current, even when viewing Synthetic details for a historical dashboard time frame.
When a monitor fails, screenshots for every failing execution (SCoE) are available on the Analysis page.
To view screenshots from private browser monitors, your synthetic-enabled Environment ActiveGate or the browser you access DESK from must be able to access the Amazon S3 service—ensure that your firewall allows connections to *.s3.amazonaws.com on port 443.
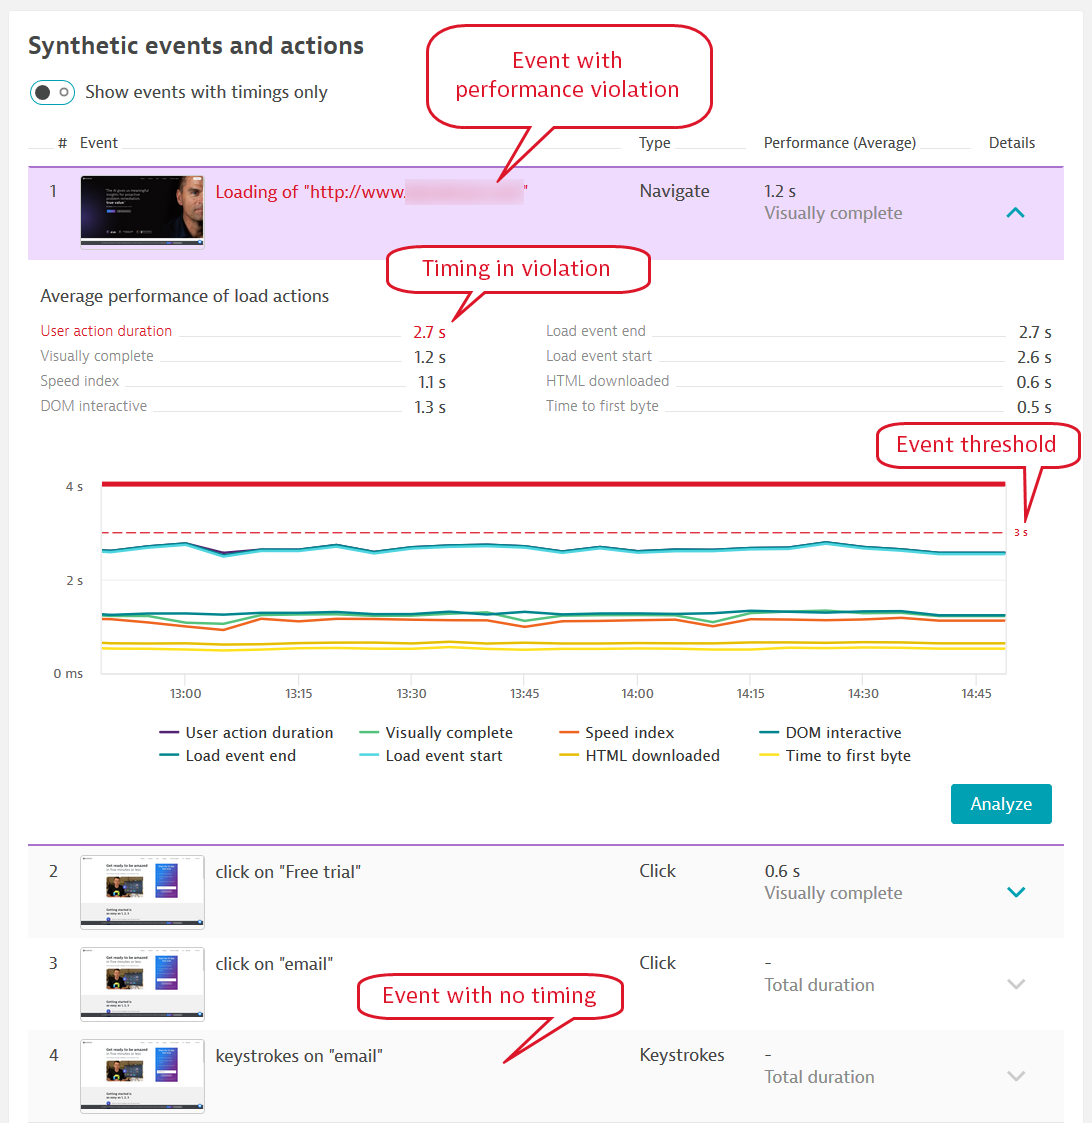
Synthetic events and actions
The Synthetic events and actions card helps you distinguish between script events with and without timings (i.e., actions). Use the Show events with timings only toggle to view only events that captured actions or all events. For each event, you see the average action timing of your selected key performance metric.
Events are all the interactions you record and are therefore simulated during the playback of a browser clickpath. Not all events necessarily trigger network requests, for example, clicking an input field or entering text into a form. These events are important from a functional perspective but don’t generate any performance data. Events with timings, or events that trigger actions, are the basis of performance data.
If you expand an event from the list below, you can compare all key performance metrics in one chart. Click a metric in the legend to deselect/select it from the action performance graph. Click Edit clickpath to go to monitor settings from this card.
When an event is in violation of its performance threshold, it is highlighted. Expand the event to see the action duration and the action-specific threshold.

Problems
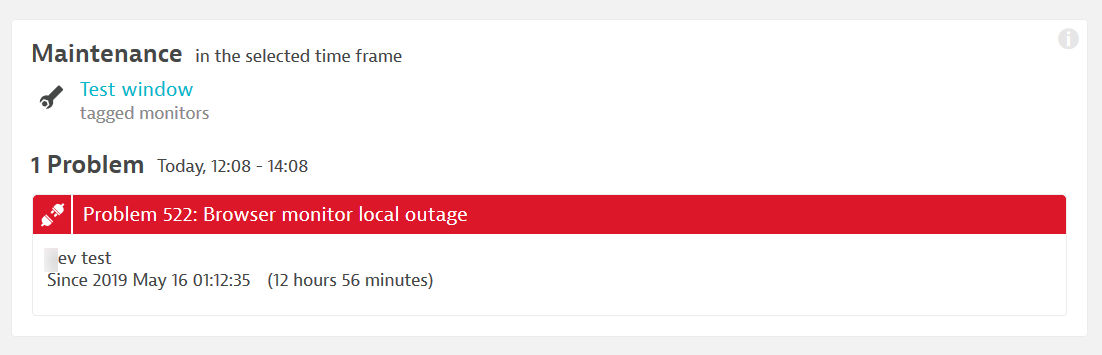
The Problems card shows performance (threshold violation) and availability (local or global outage) problems when you enable the respective thresholds in monitor settings. Expand the card to see active as well as resolved problems for the dashboard time frame. If the time frame contains a maintenance window, the card indicates so.
See Configure browser monitors for how performance and availability thresholds are defined. See the Synthetic alerting overview for alerting workflow and concepts, including setting up notification profiles and templates.
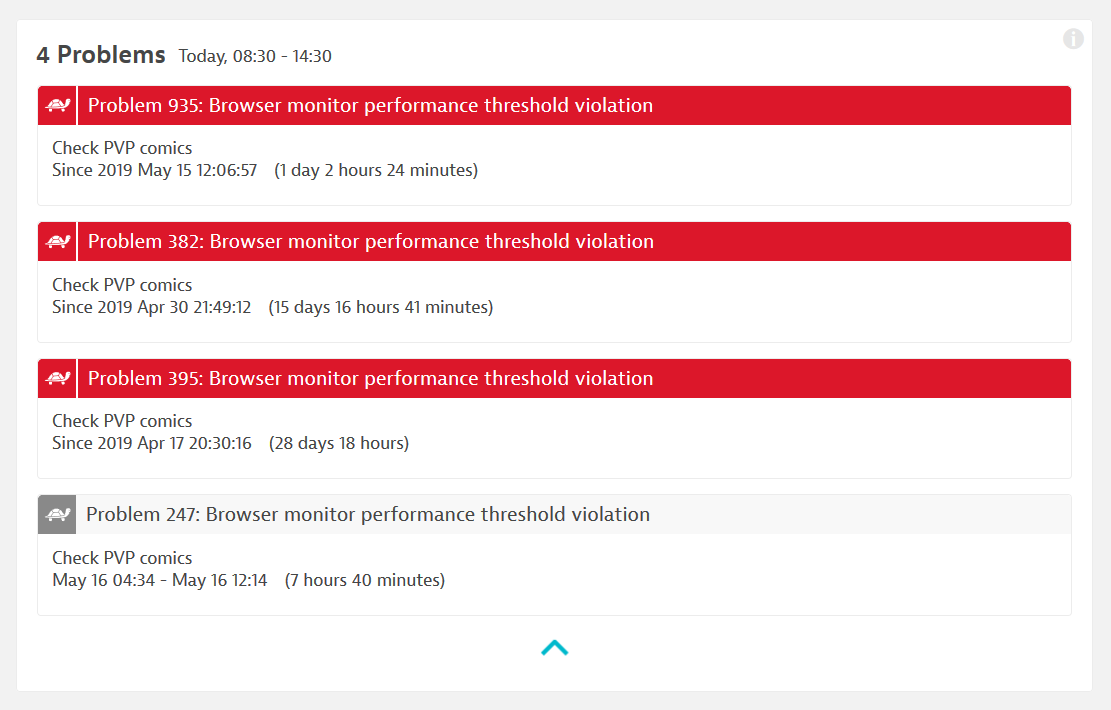
There are three main problem types for browser monitors:
- Global outage (availability)
- Local outage (availability)
- Performance threshold violation (performance)
Click a problem to view problem details in the Problems page. Drill further into the problem to see Synthetic details filtered by the problem duration.
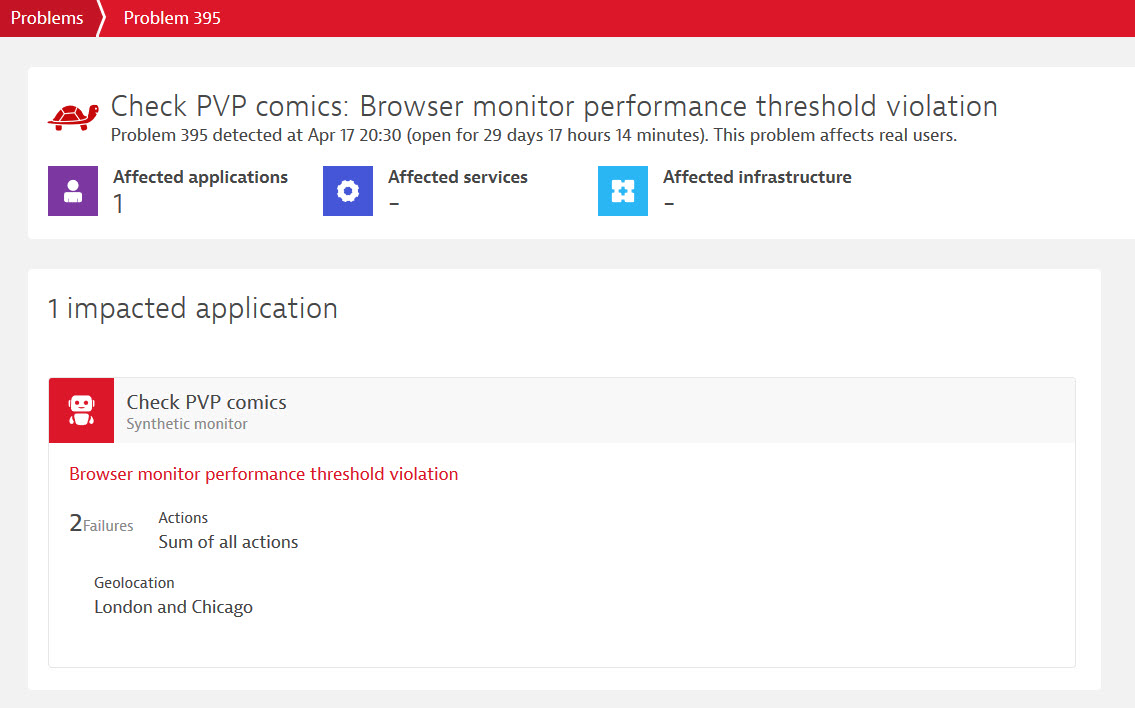
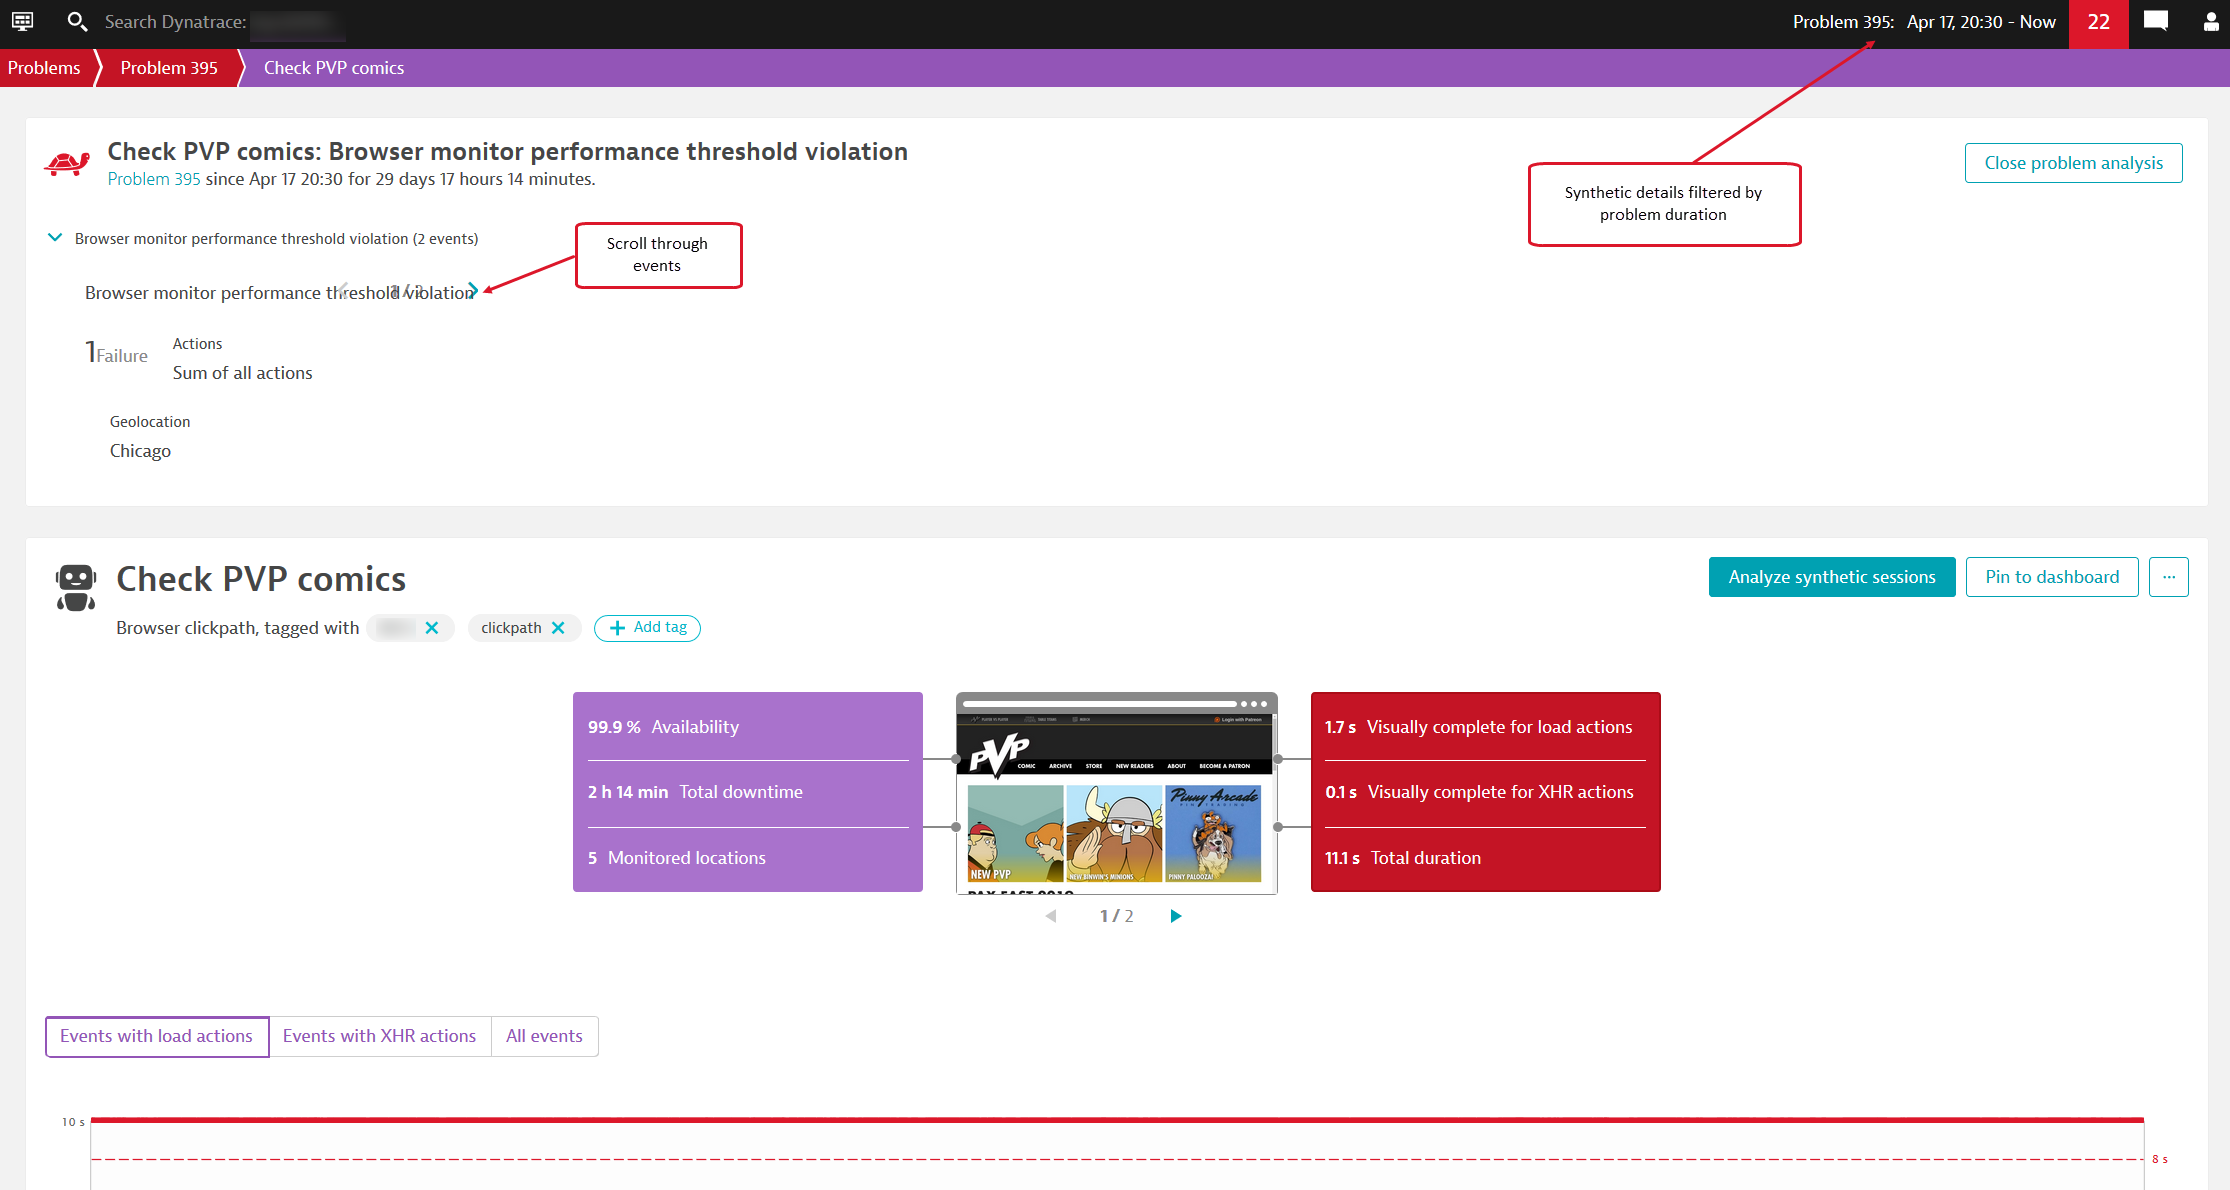
Problems, along with their constituent events and any errors give you a full picture of the number and scope of your monitor's issues.
Events
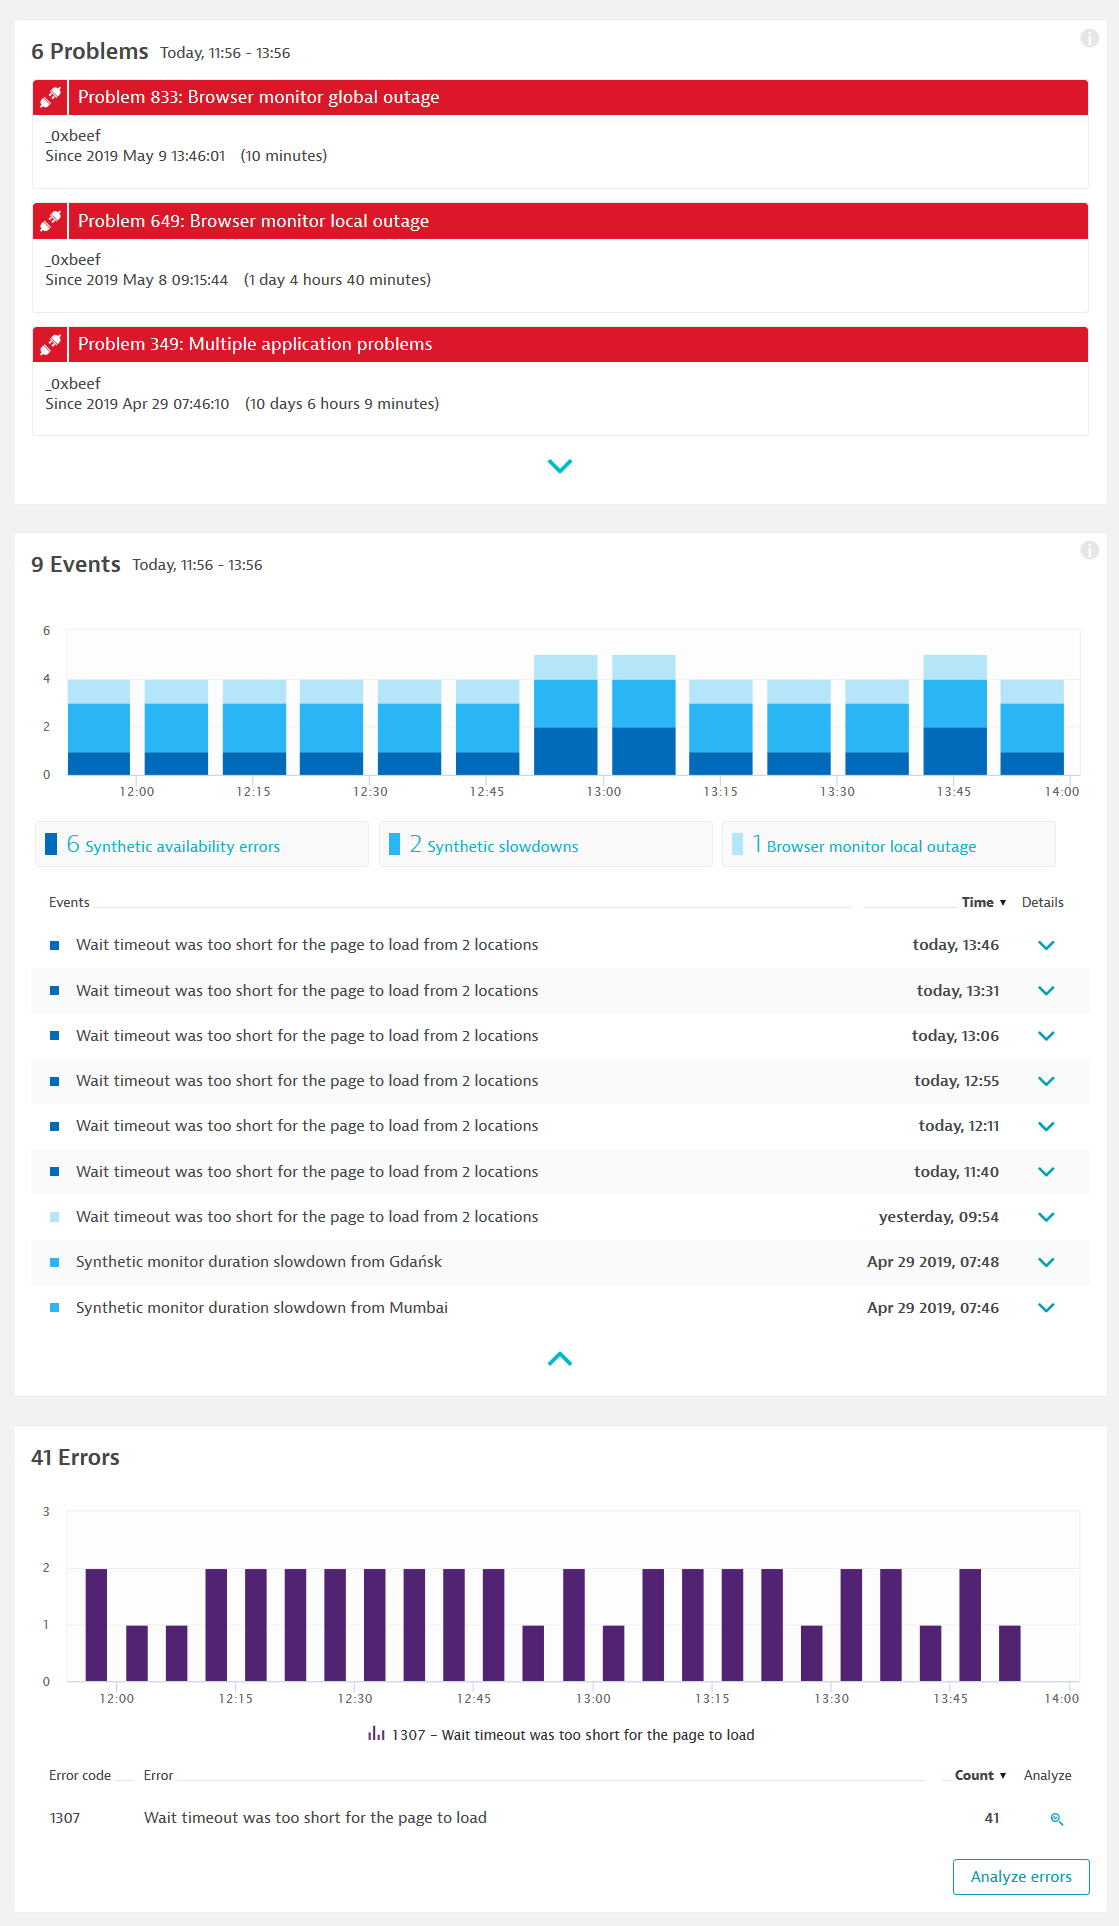
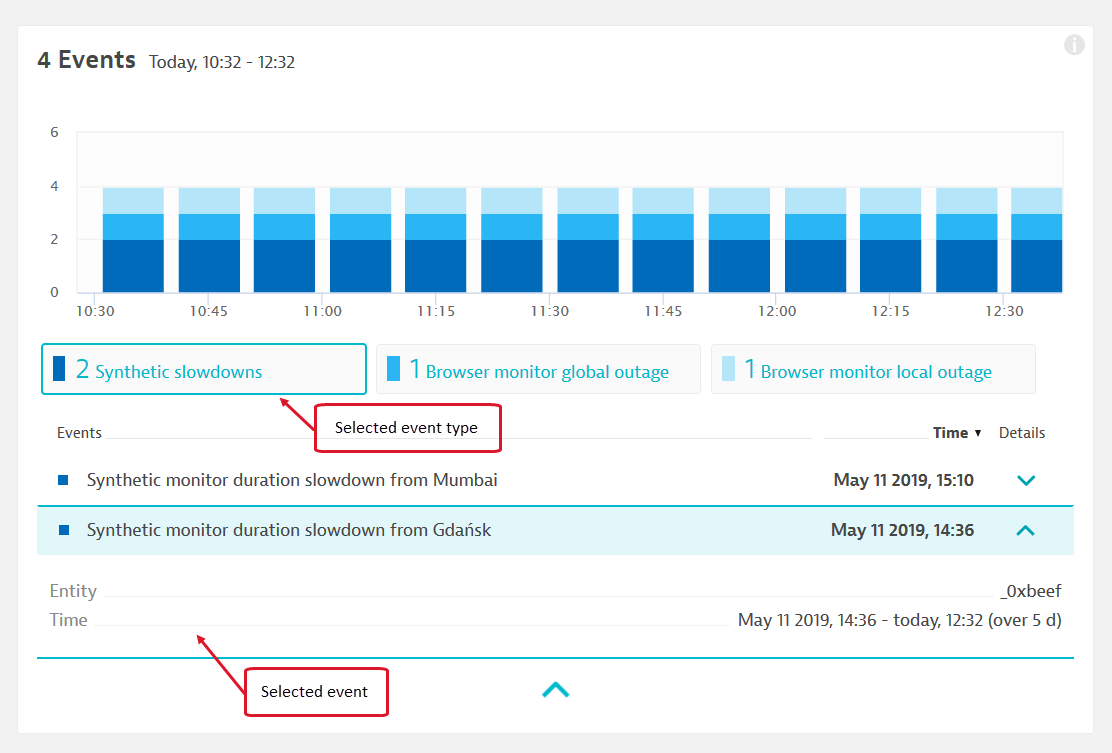
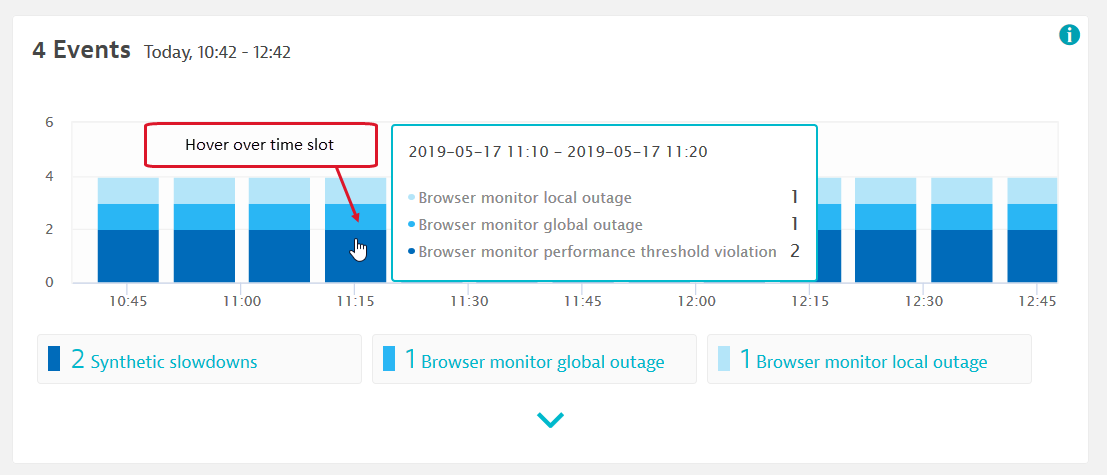
The Events card shows all events that can lead to problems. Custom events you ingest into DESK also show up in this card. Events for active as well as resolved problems show up here in a list and timeline.
Click an event type, for example, Synthetic slowdown, to see the list of events. There is always one slowdown event created per location where your monitor violates a sum of all actions and/or an action-specific threshold. Click an individual event to see details.
Hover over a time slot in the event timeline to see the type and number of events generated in that interval. Click to select the time slot and display a list of events in it.
Errors
The Errors card displays the timeline of all failed executions of the monitor with the corresponding error codes, providing an easy way to quickly find the main reason for monitor failures.
Click Analyze errors at the bottom of the card to view these error runs in the Analysis page. Click Analyze  next to an individual error to view the Analysis page filtered by that error.
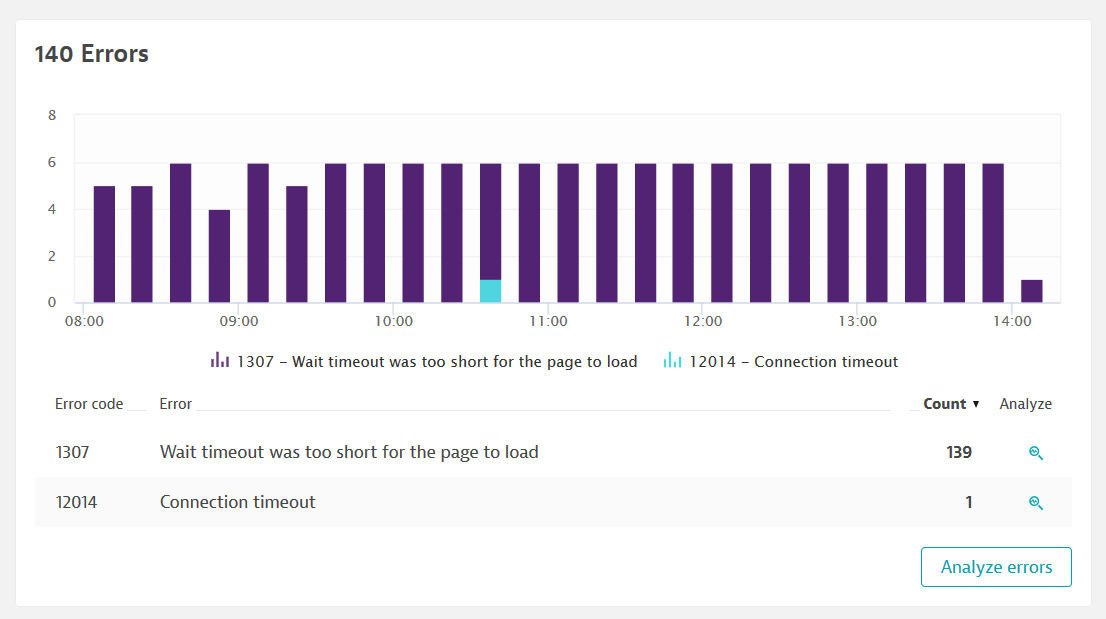
A monitor failure counts towards availability outages (global or local threshold violations). A performance threshold violation is not necessarily an error unless the run also fails. You might see errors with no problems if you haven't enabled availability thresholds or if the errors don't cause a violation of your availability thresholds.
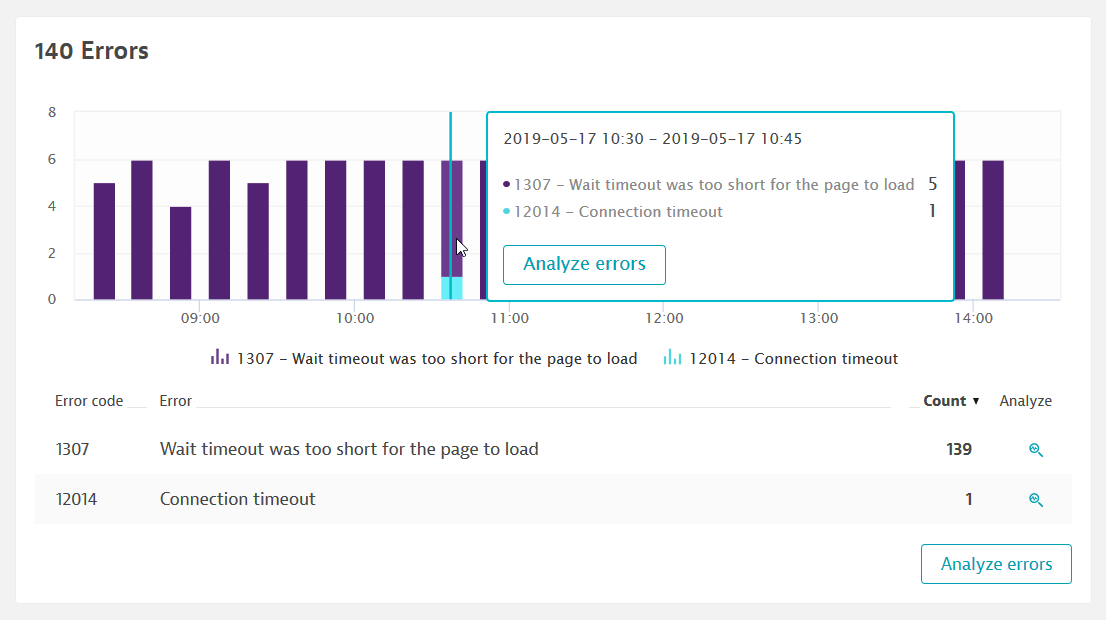
Hover over any time slot in the error timeline to see the count of errors by type during that interval. Click Analyze errors in the hover tooltip to view the Analyze page showing that time slot.
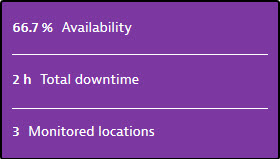
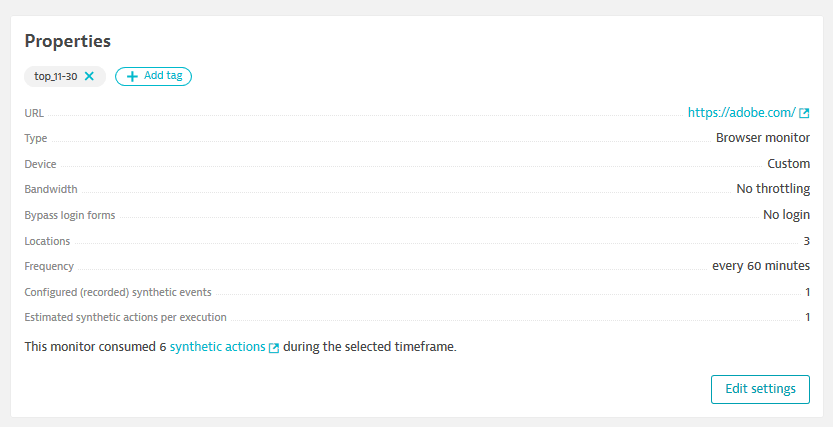
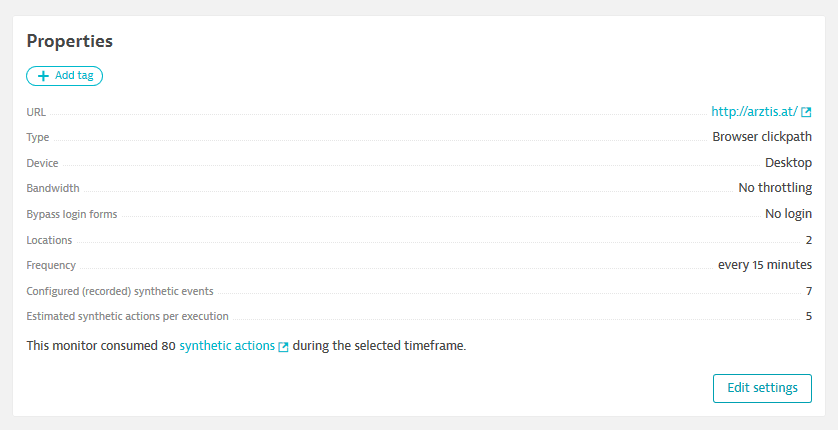
Properties
The Properties card summarizes key properties of your monitor and displays the number of actions, events, and the consumption for the global timeframe. For single-URL browser monitors, the number of events and actions is always 1. In the first image below, the monitor runs once an hour from 3 locations so its consumption is 6 actions for a 2-hour time period.
In the second image, the browser clickpath has 7 events and 5 actions and runs every 15 minutes from 2 locations. Its consumption over 2 hours is 5 (actions) x 2 (locations) x 4 (times an hour) x 2 (hours) = 80 actions.
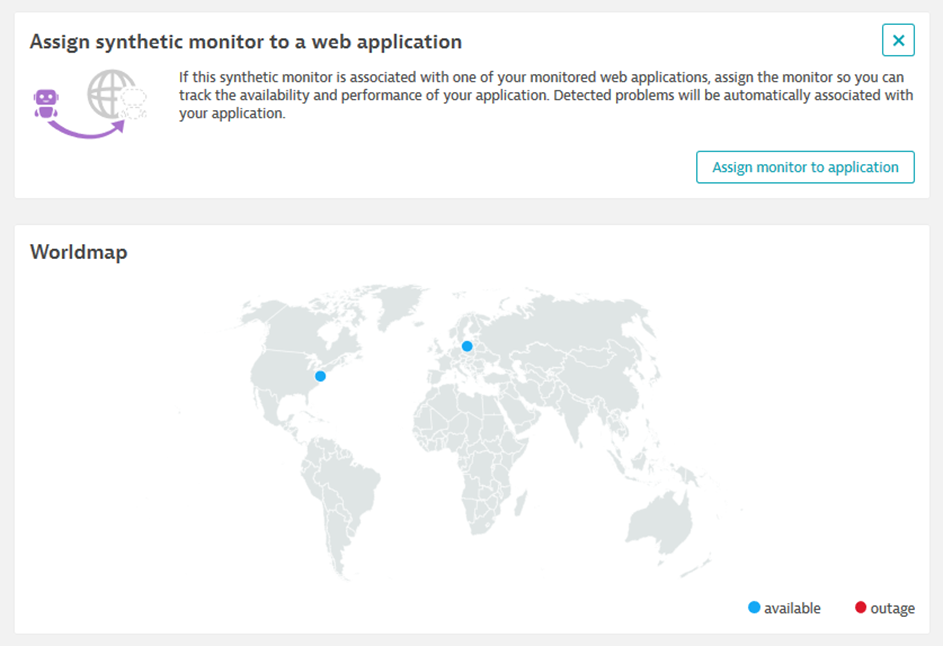
World map
The World map shows if your monitoring locations are online or have an outage, helping you distinguish between global and local outages. Assign monitor to application (see the first image below) takes you to monitor settings where you can associate the monitor with one of your monitored web applications.
If Real User Monitoring (RUM) is enabled for the web applications your synthetic monitor runs against, DESK automatically links the RUM applications to the monitor, and the Monitored applications card is displayed (see the second image below). You can see the key metrics of the application and can jump directly to RUM data from here.
If a RUM application is linked to the monitor, you’ll see a toggle to augment the world map with RUM data. When there's an outage at a synthetic location, you can immediately compare the RUM traffic. The RUM data is also a good indicator of which other locations you should run your synthetic monitor from.