Service flow filtering
Modern web applications typically feature complex service architectures that can process millions of different types of requests. With each unique request behaving slightly differently and triggering a slightly varied service flow, it can be a real challenge to analyze the performance and behavior of individual requests.
The filtering features help you to navigate the complexity of your application's service architecture—enabling you to find the proverbial needle in the haystack. DESK Service flow enables you to analyze subsets of requests triggered by a given service.
The general Service flow filtration procedure looks like this:
- Click Transactions & services in the navigation menu.
- Select the service you want to analyze.
- In the Understand dependencies pane click Service flow.
- Within Service flow, select a called service to define the sequence of services you want to analyze.
The Passing transactions pane appears on the right side of the page. - To create a filter for the selected service sequence do one of the following:
- Click the Filter service flow button in the top tile.
- Click the filter
 icon on top of the selected service.
- Add more criteria to the filter:
- In the filter, click the service where you want to apply additional filtration.
- From the Create filter for list, select the criterion.
- Specify the threshold or matching rules for the criterion.
- Click Add.
- If needed, add more criteria to the filter.
- When finished, click Apply.
See below for a more detailed explanation.
Filter requests based on specific call sequences
Call sequence filters are available in most service analysis views, but they’re most obvious in Service flow. As you can see in the example below, only 7.5% of the requests to the easyTravel Customer Frontend service also called the JourneyService service. Next, 99% of those called the easyTravel-Business database service.
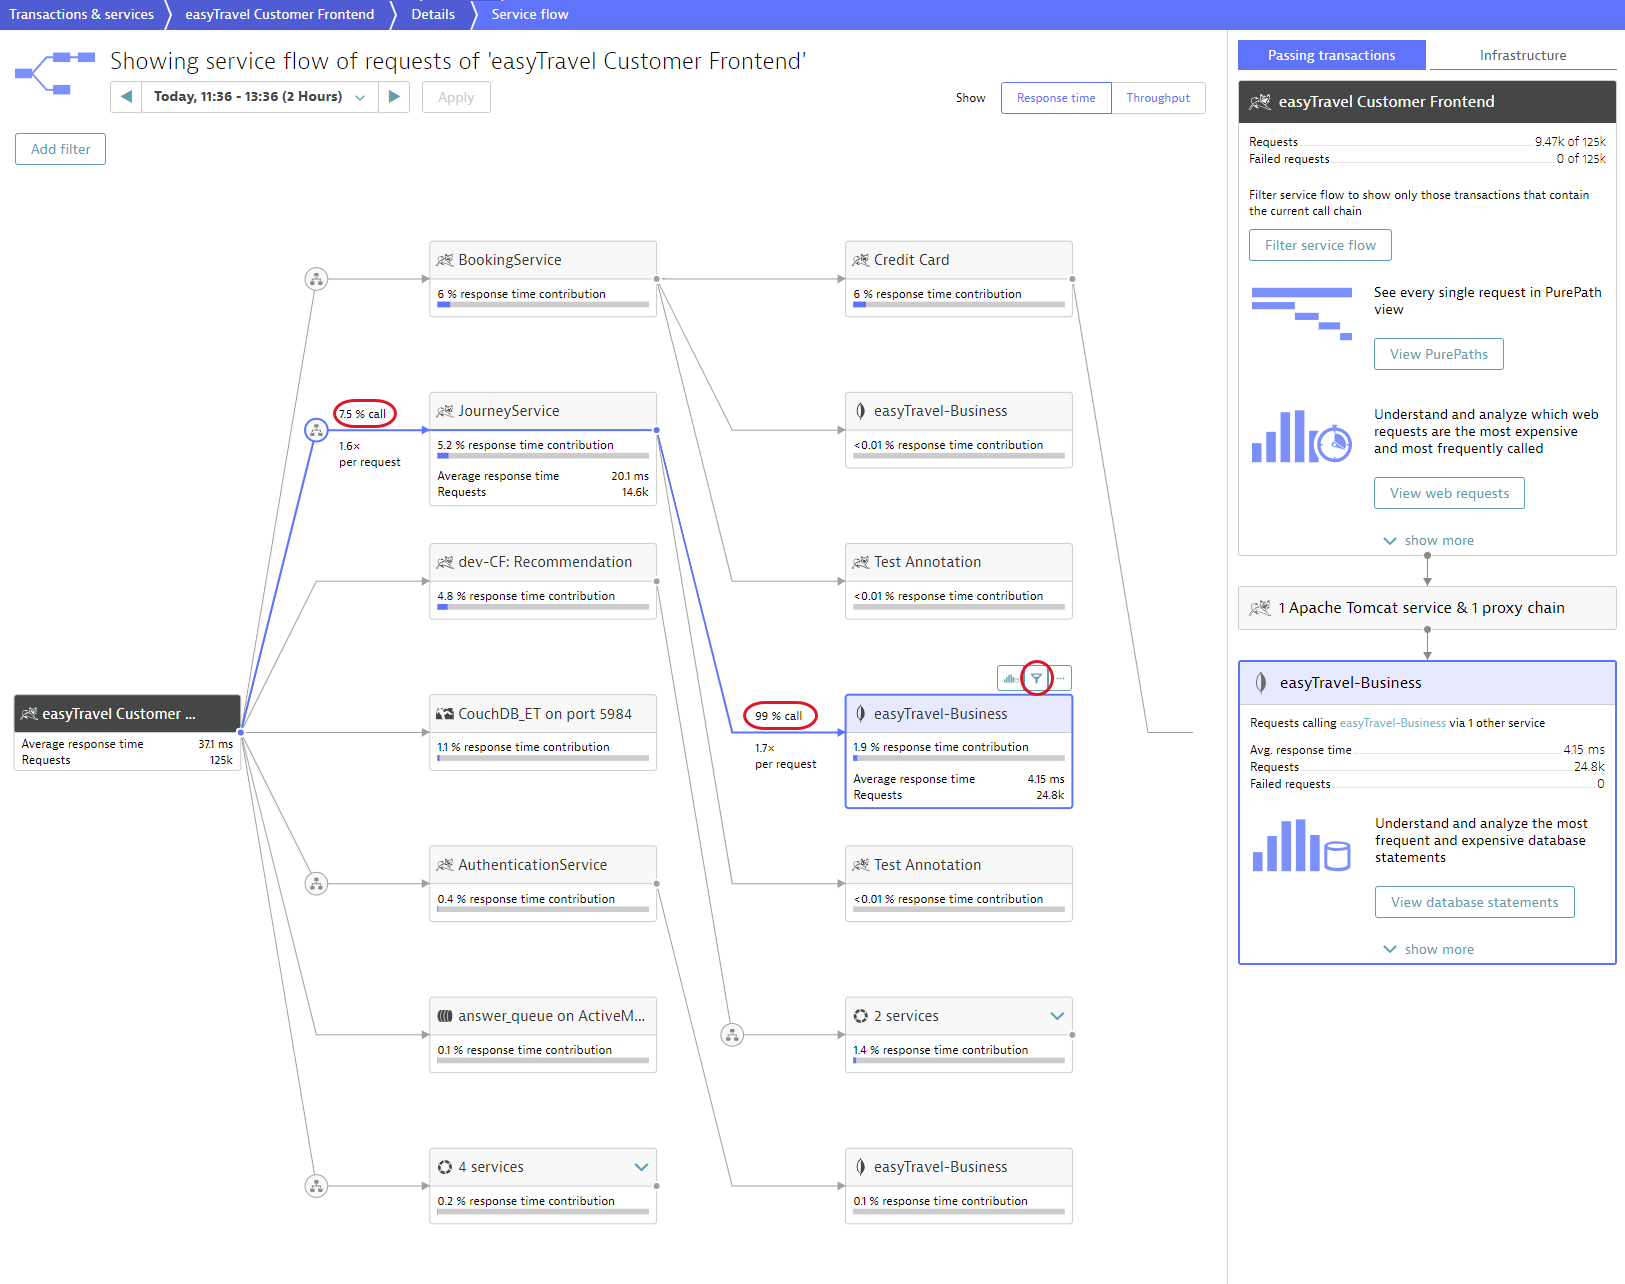
To focus Service Flow on these calls
- Click Transactions & services in the navigation menu.
- Select the service you want to analyze.
- In the Understand dependencies pane click Service flow.
- Within Service flow, select a called service to define the sequence of services you want to analyze. In our example it's
easyTravel-Business.
The Passing transactions pane appears on the right side of the page. - To create a filter for the selected service sequence do one of the following:
- Click the Filter service flow button in the top tile.
- Click the filter icon on top of the selected service.
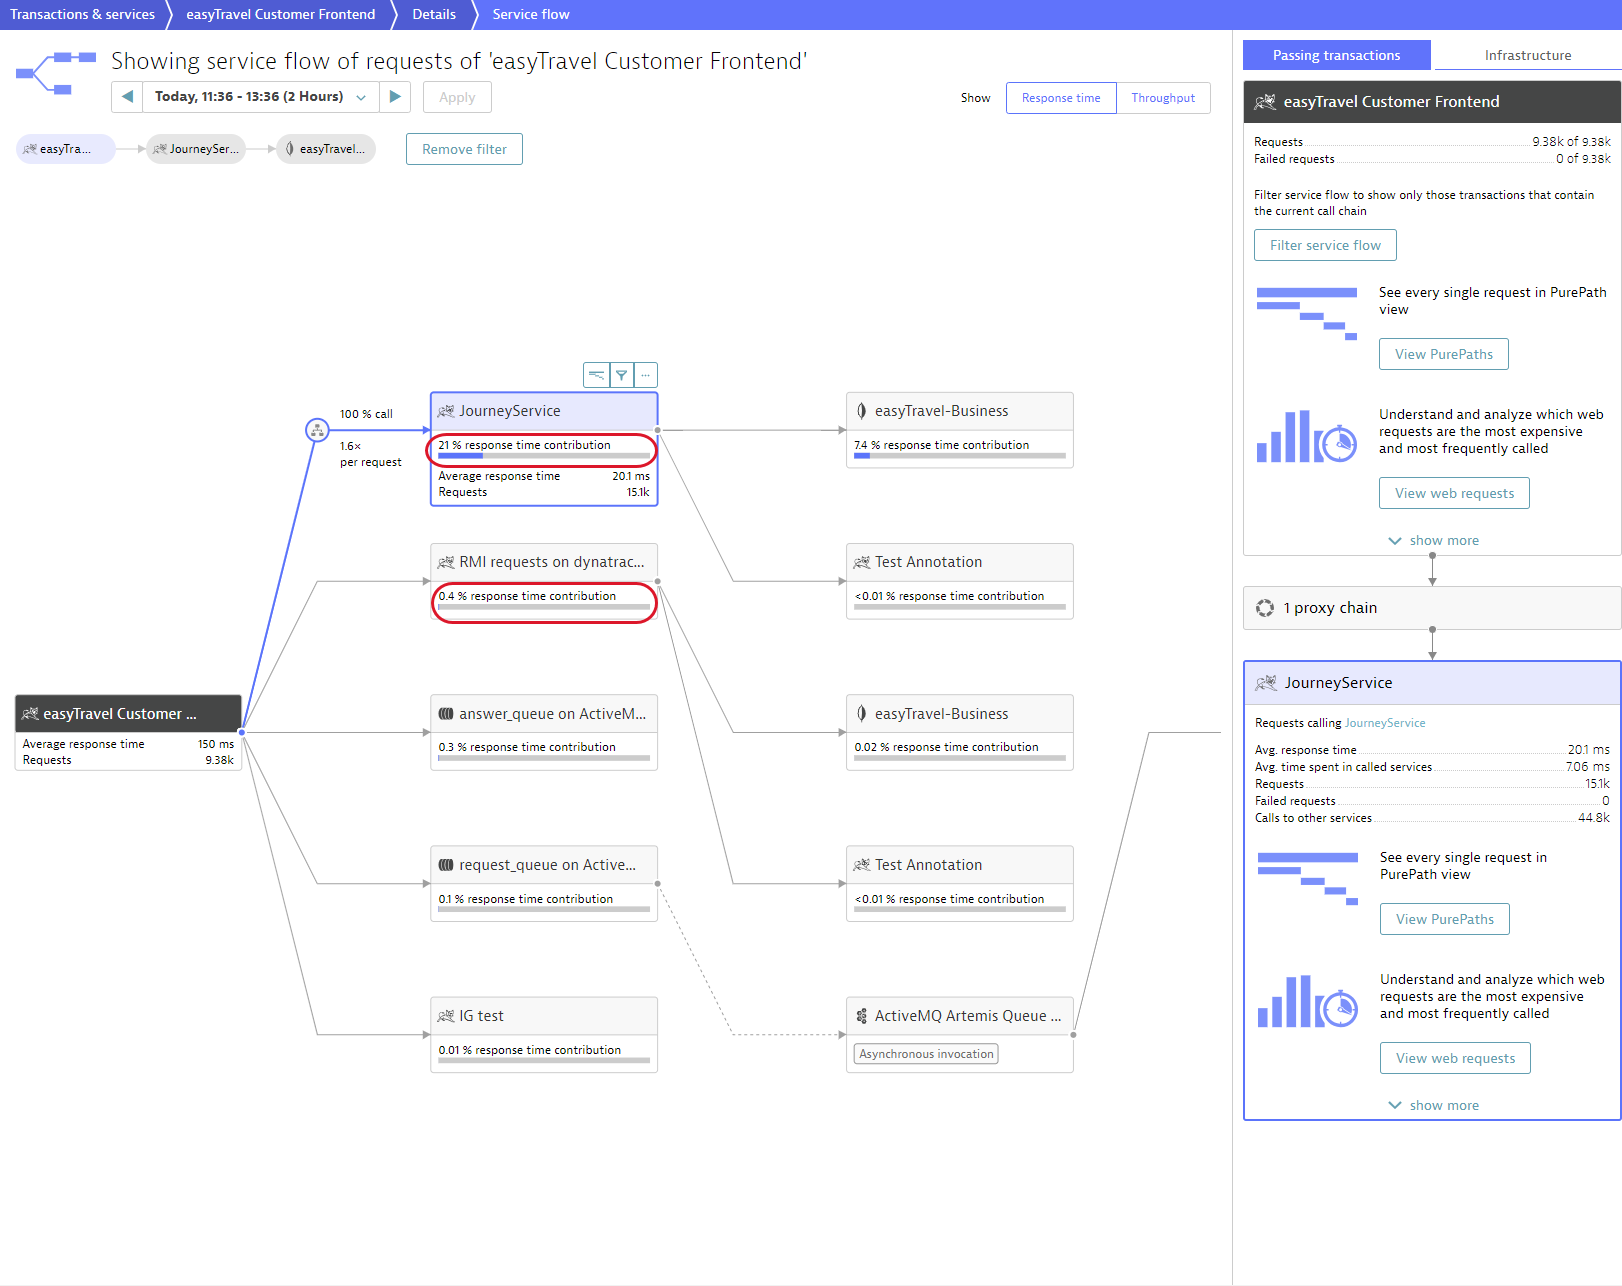
Let's go back to our example. A filter has been created to focus analysis only on those requests from the easyTravel Customer Frontend service that call the JourneyService service and subsequently call the easyTravel-Business database.
Notice that the number of requests analyzed on easyTravel Customer Frontend has been reduced to 9.38k from 125k, as only a subset of call is now taken into account. Consequently the average response time now represents only those easyTravel Customer Frontend requests that call JourneyService.
Now take a close look at the JourneyService node. Note that 21% of the easyTravel Customer Frontend service's response time is taken up by JourneyService. Service flow also reveals something unexpected—some of the selected requests trigger the RMI server.
Multi-faceted filters
Each filter can contain multiple call sequences. This means you can create complex, multi-faceted call-sequence filters based on your unique service-analysis needs. Service Flow will only focus on calls that fit all the criteria.
To add the new sequences to the existing filter
- While your current filer is still active, click an additional call sequence in Service Flow.
- Click the Filter service flow button in the top pane on the right side of the page.
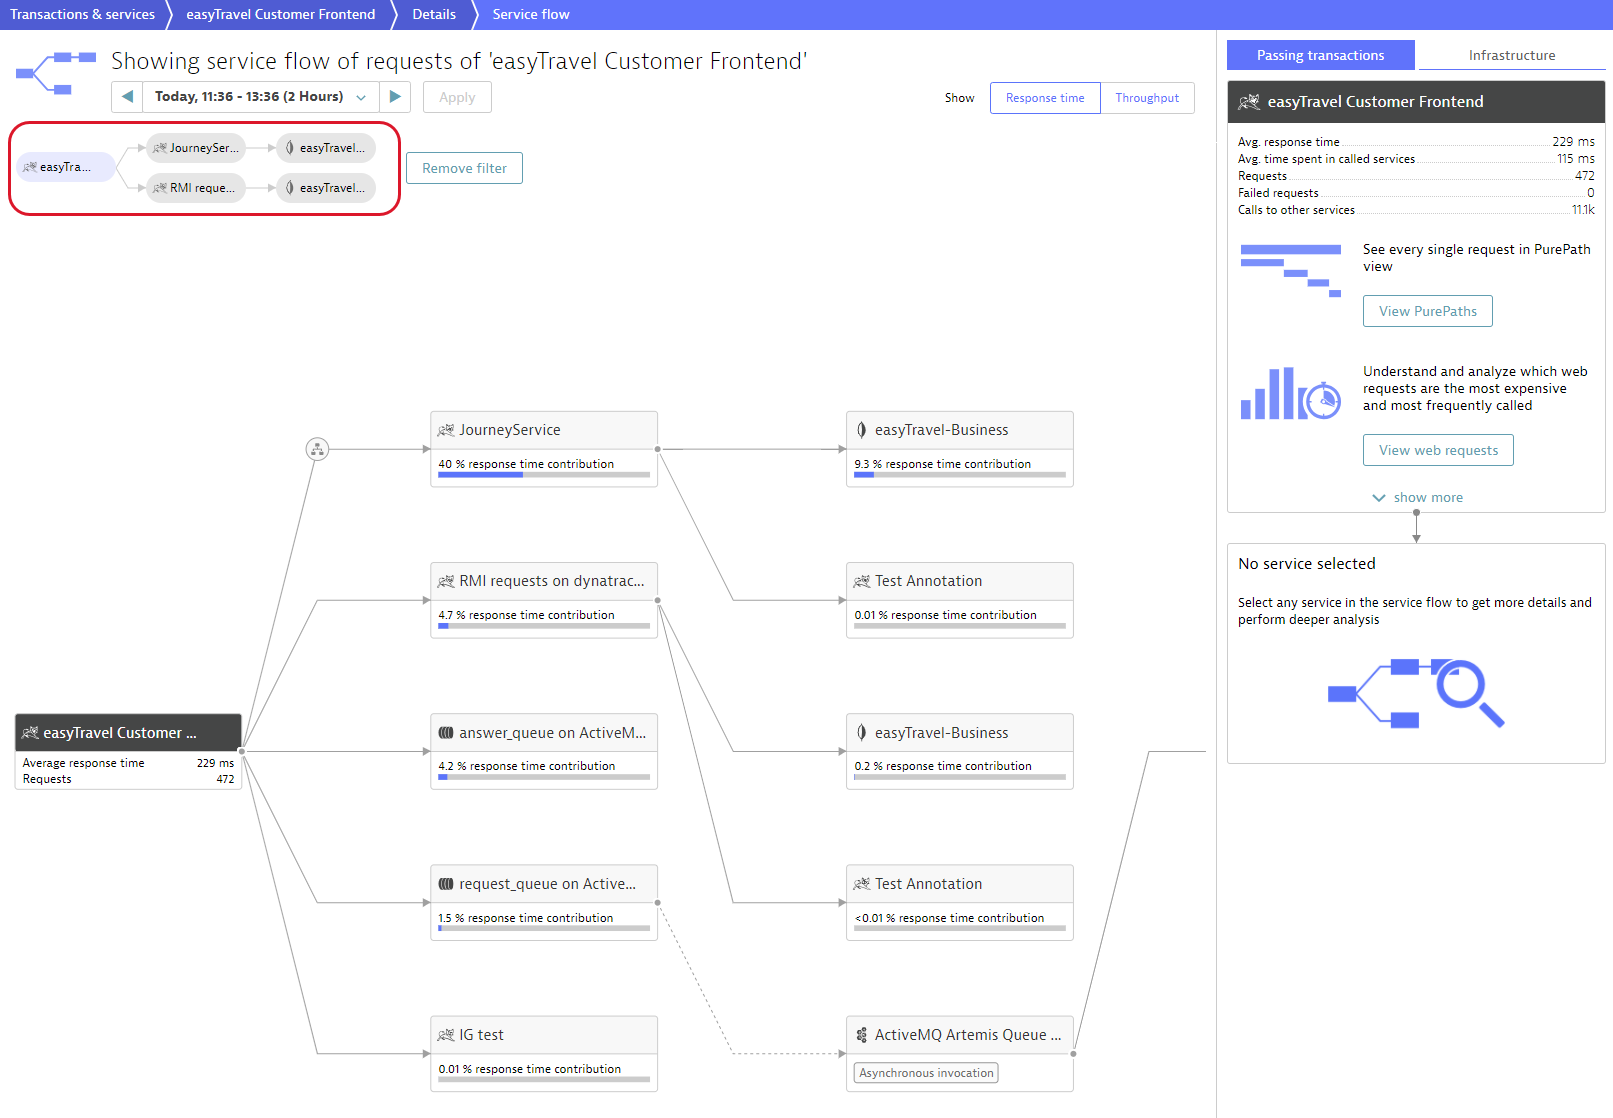
In the example below, the filter criteria is extended with calls from the easyTravel Customer Frontend service that call the RMI server service and subsequently call the easyTravel-Business database. Now the number of requests analyzed on easyTravel Customer Frontend has been reduced to 472. Also the JourneyService service is now responsible for 40% of the response time.
Extend your filters with additional criteria
Once you've narrowed down the number of calls based on the involved services, you can add more criteria to the filtration.
- In the filter, click the service where you want to apply additional filtration.
- From the Create filter for list, select the criterion.
- Specify the threshold or matching rules for the criterion.
- Click Add.
- If needed, add more criteria to the filter.
- When finished, click Apply.
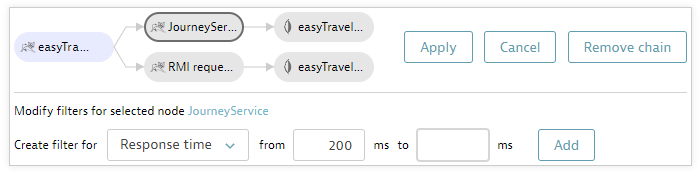
In our example, we applied the Response time threshold of 200 ms to JourneyService. Now only calls with response time longer than 200 ms are shown, and there are just 4 of them. We're now very close to finding the needle in this haystack!
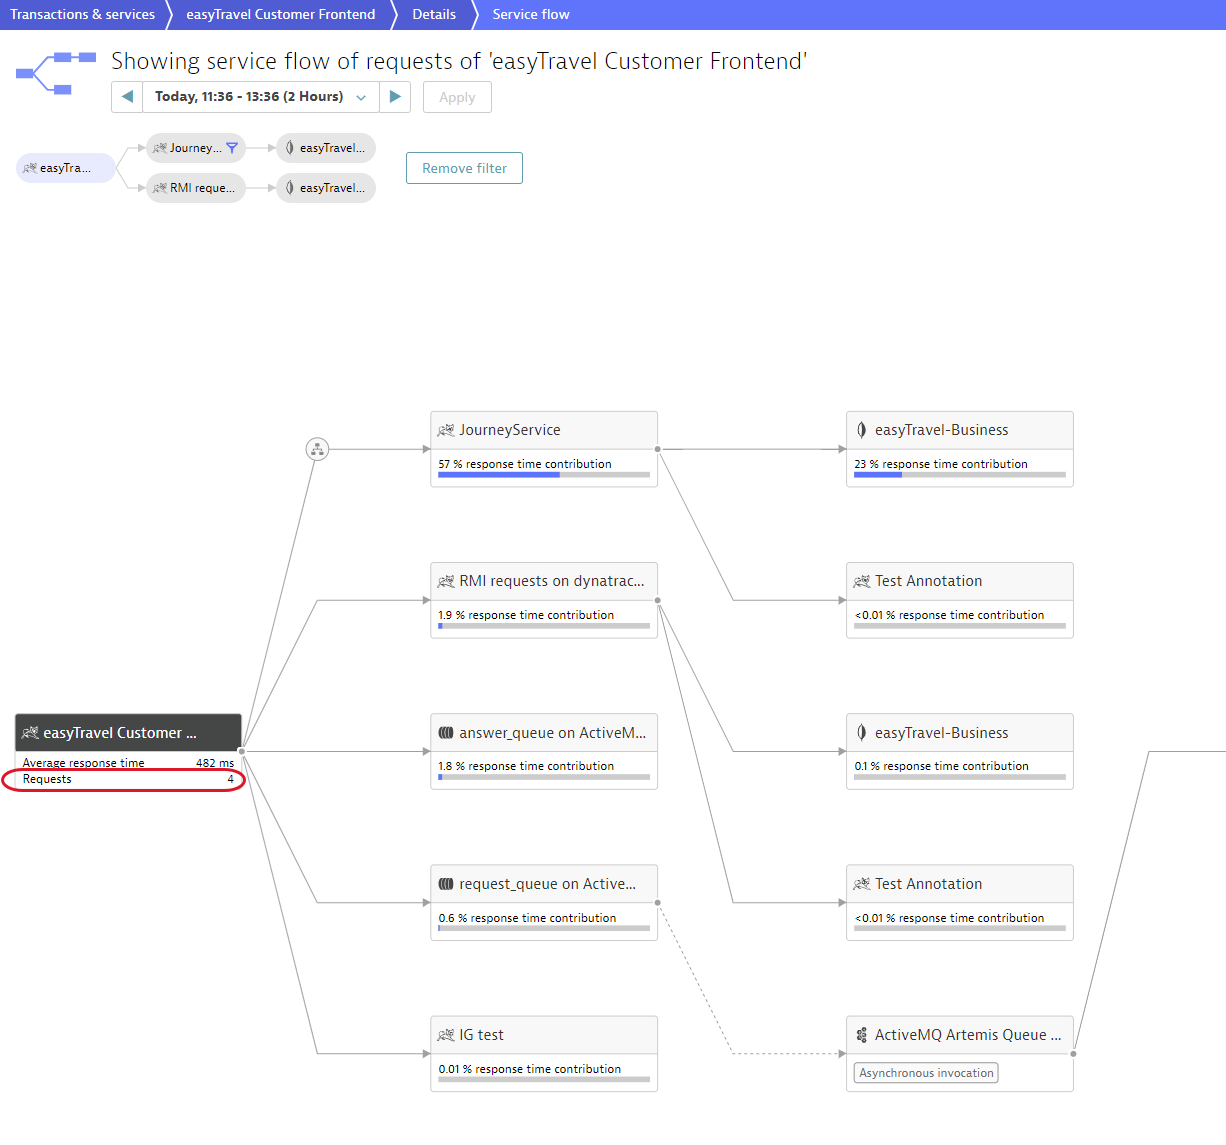
Analyze call sequences from multiple angles
The true power of call-sequence filtering becomes apparent once you begin analysis of a problematic call sequence. In the example above, Service flow now shows us that the 57% of the easyTravel Customer Frontend service's response time is taken up by JourneyService.
The next logical step is to analyze the response time of the JourneyService service in the context of the selected call sequence. To do this, simply click the JourneyService box within Service flow. The right-hand pane expands, revealing all of the types of DESK analysis that you can perform on this service—all within the context of the filtered call sequence. Learn more about further analysis in one of topics listed below. All the filters you created in Service flow will also be applied to the further analysis.
- View PurePaths
Analyze the detailed method-level chain of calls. - Analyze backtrace
Explore the sequence of service calls that led up to the specific service request. - View response time
View how the response time is distributed along different functions of the service (for example, database usage, code execution, etc.) - Analyze outliers
View the response time distribution of requests to the service within a specific timeframe.