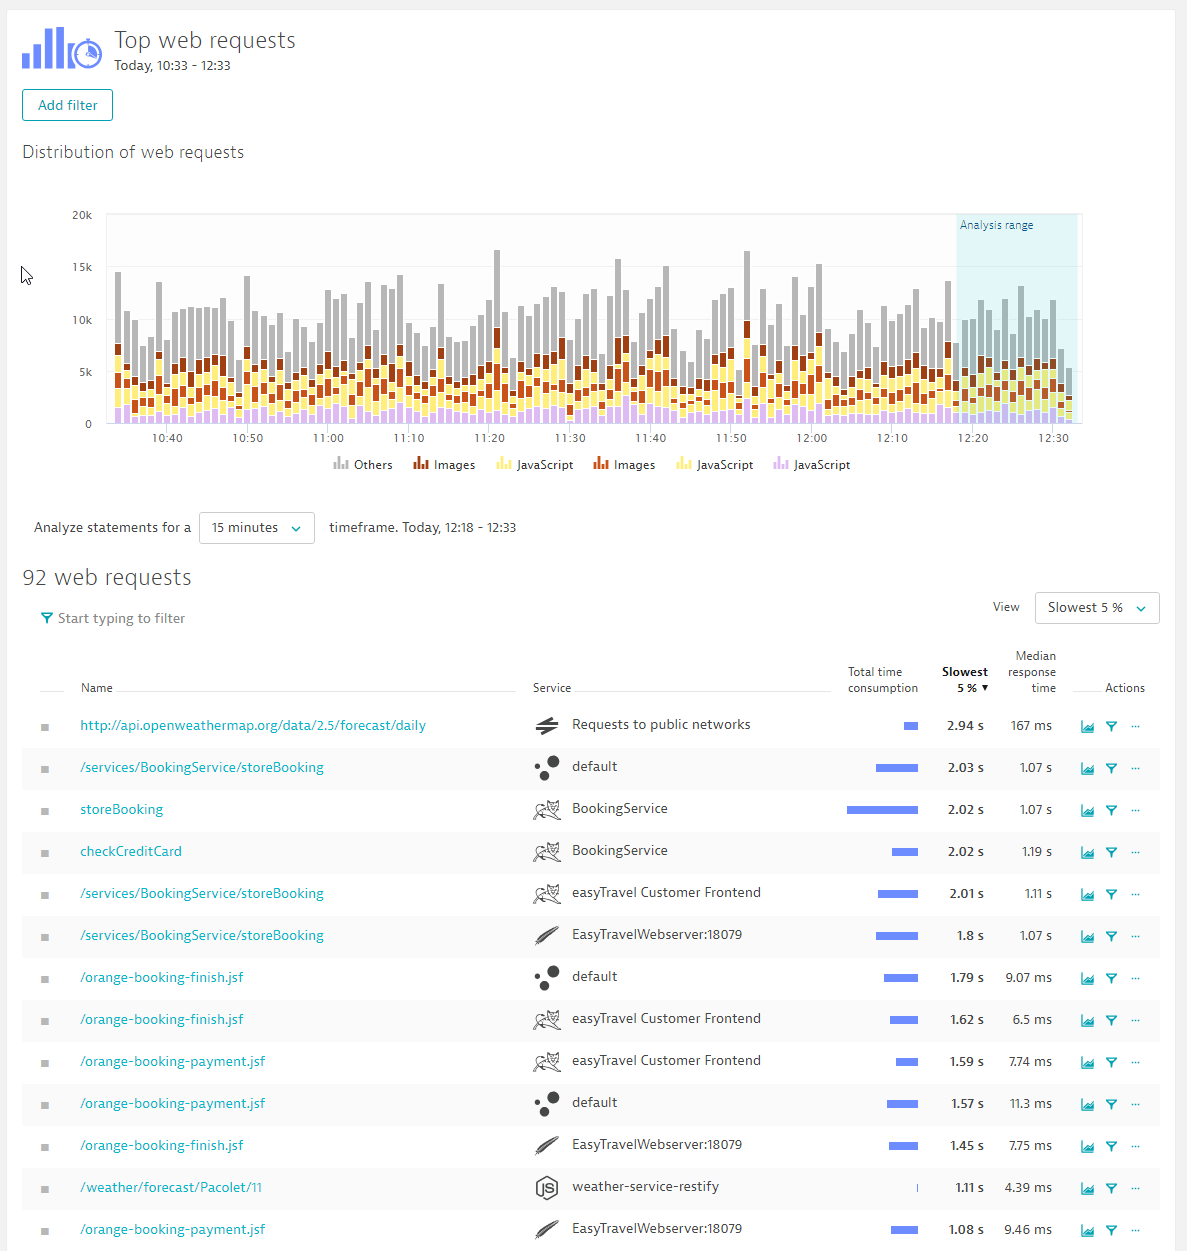
Top web requests
The Top web requests view can be used to analyze top web requests across all services and to search for the specific URLs underlying these web requests.
To analyze top web requests in DESK:
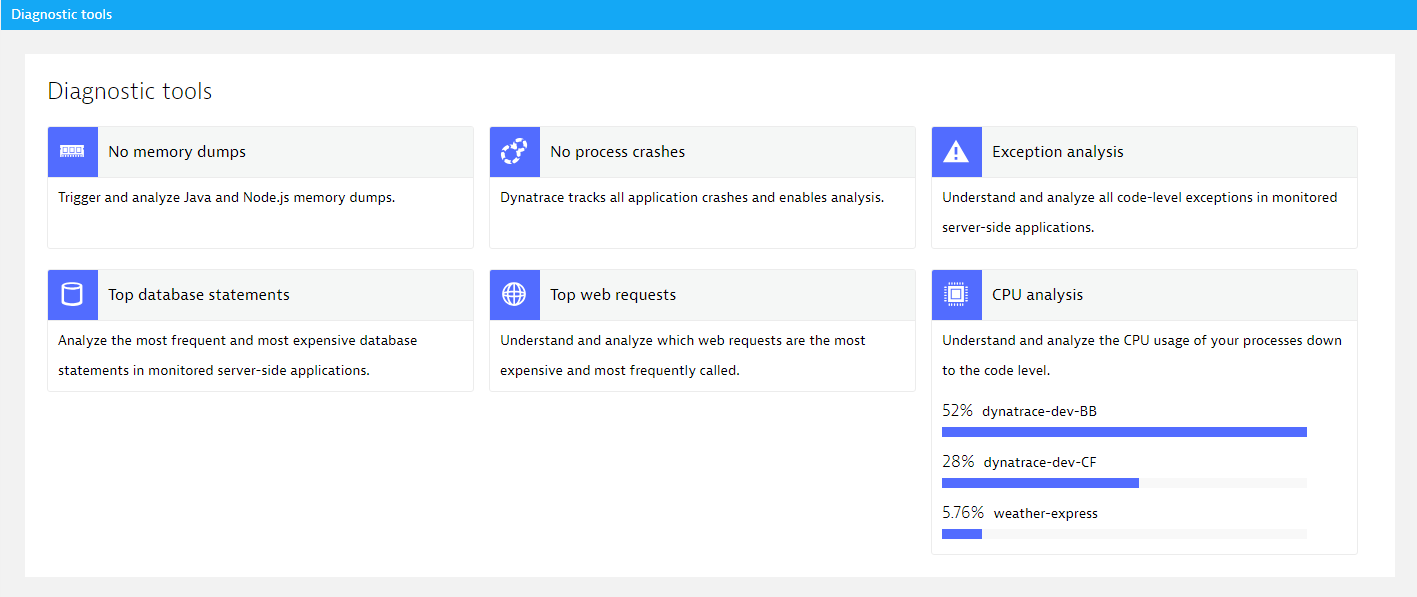
- Select Diagnostic tools from the navigation menu.
- Click the Top web requests tile.
The Top web requests page lists all web requests in the selected timeframe for all services, including web services.
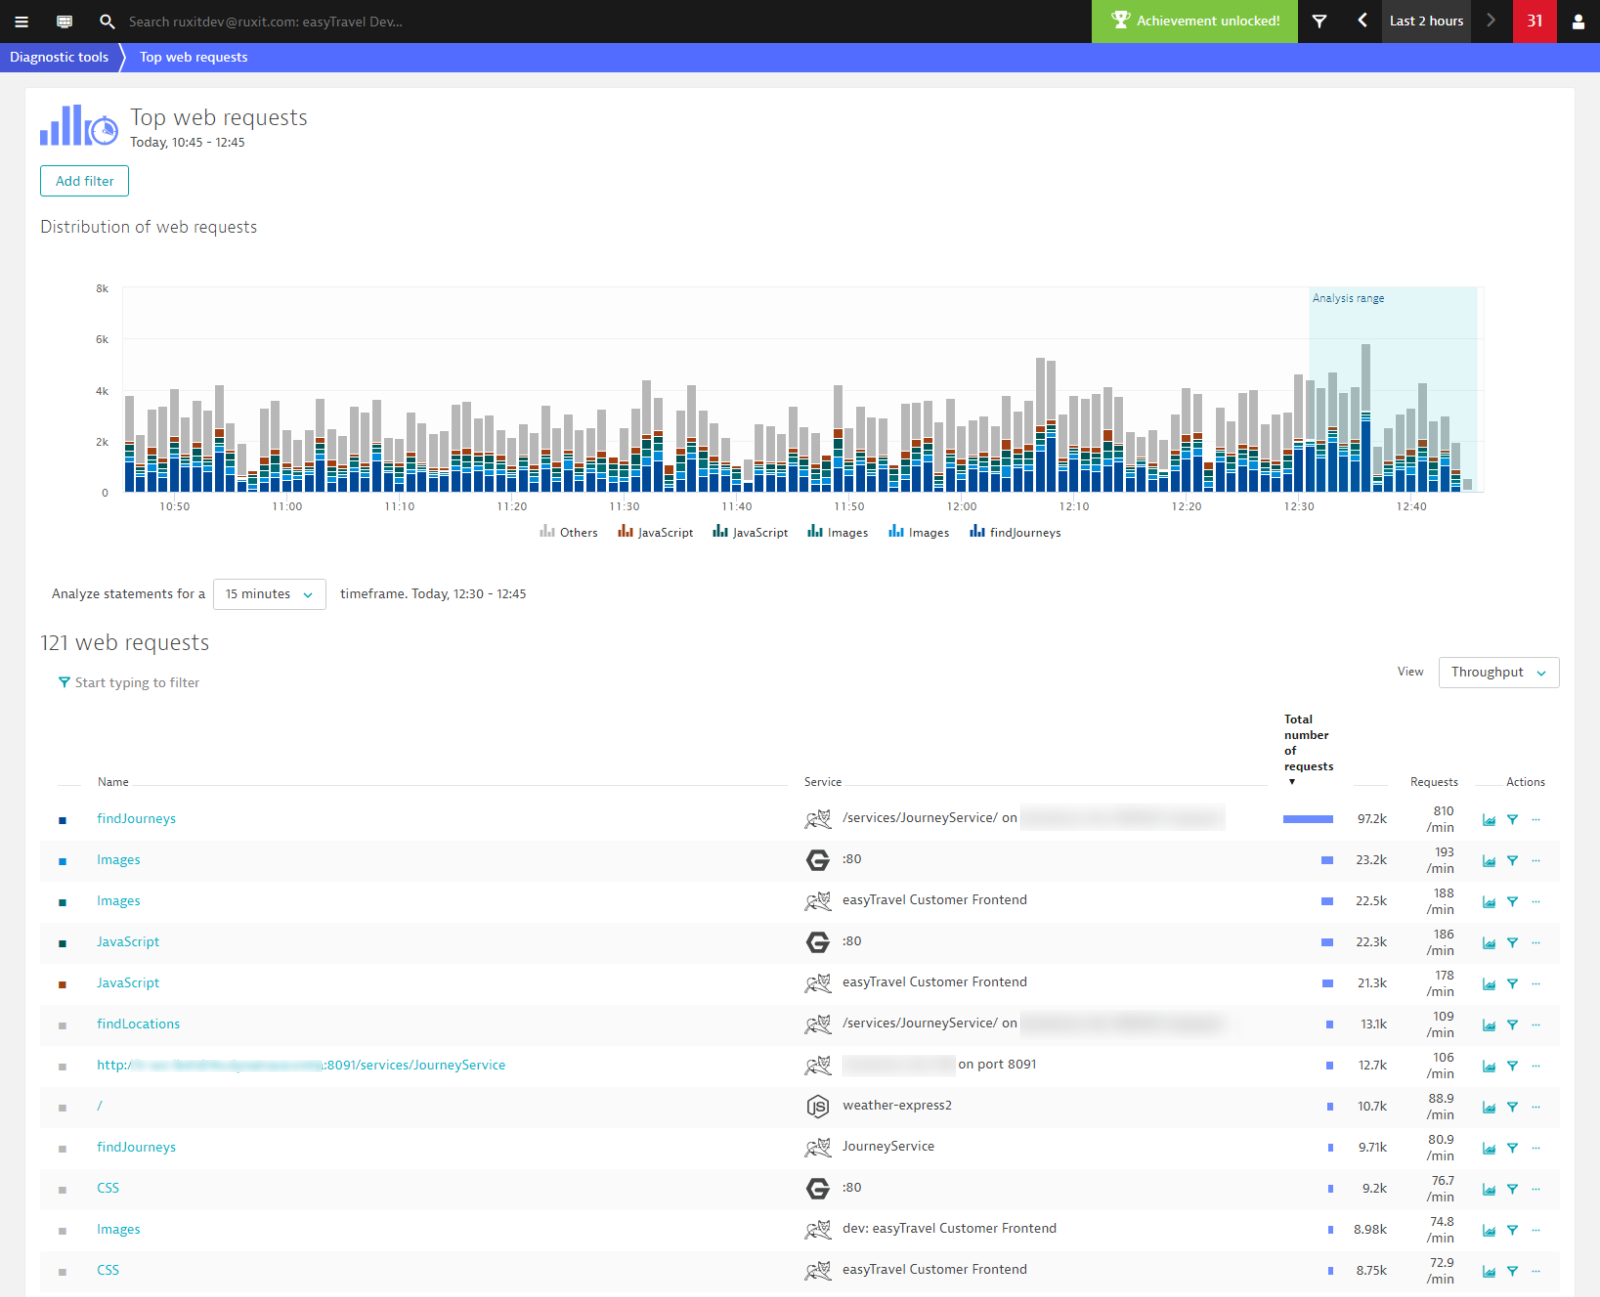
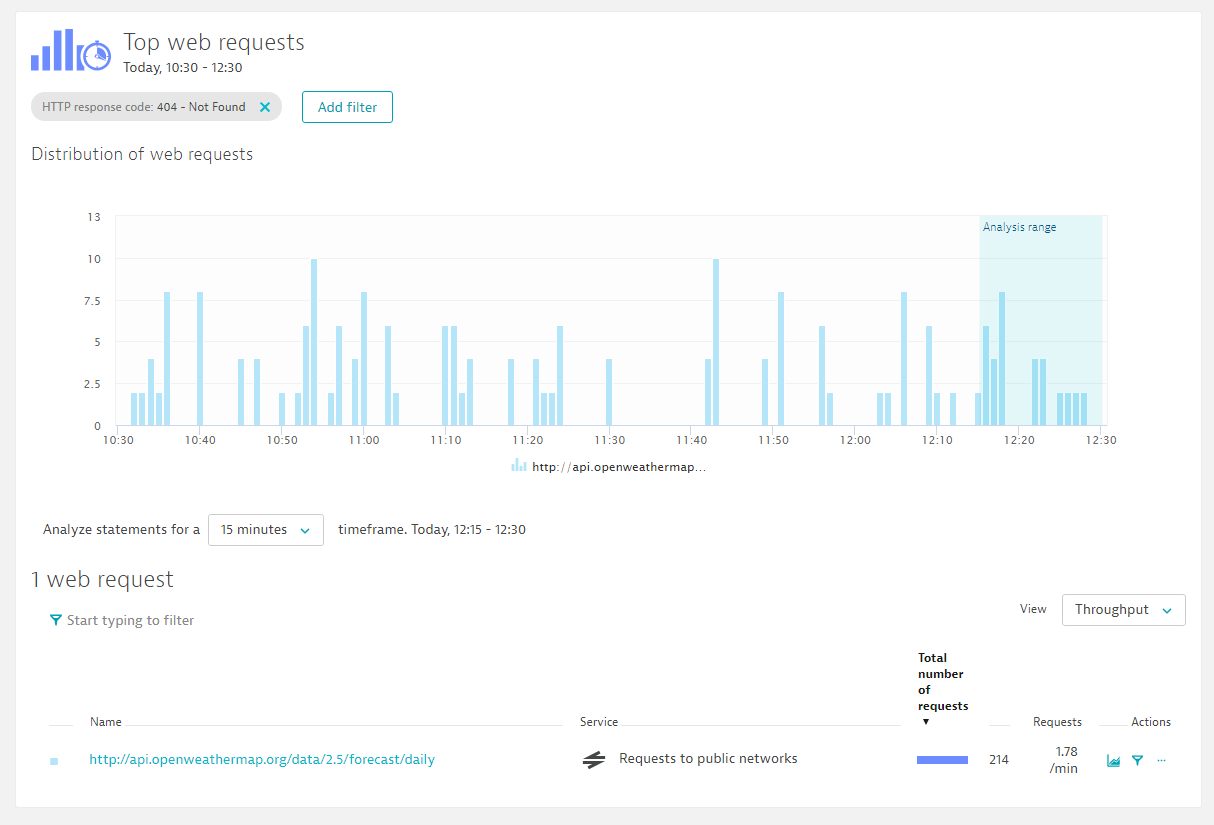
You can add filters for the various aspects of web requests, such as HTTP methods, request attributes, and 404 response codes, and use this view to isolate specific requests. In the following example, we’ve isolated one web request that returns a 404 – Not found response code.
You can also use this view to identify the slowest or the most resource-consuming requests in your system. You can then analyze these problematic requests by using the analysis tools that are available in the Analyze (…) menu under the Actions column of each web request listing.
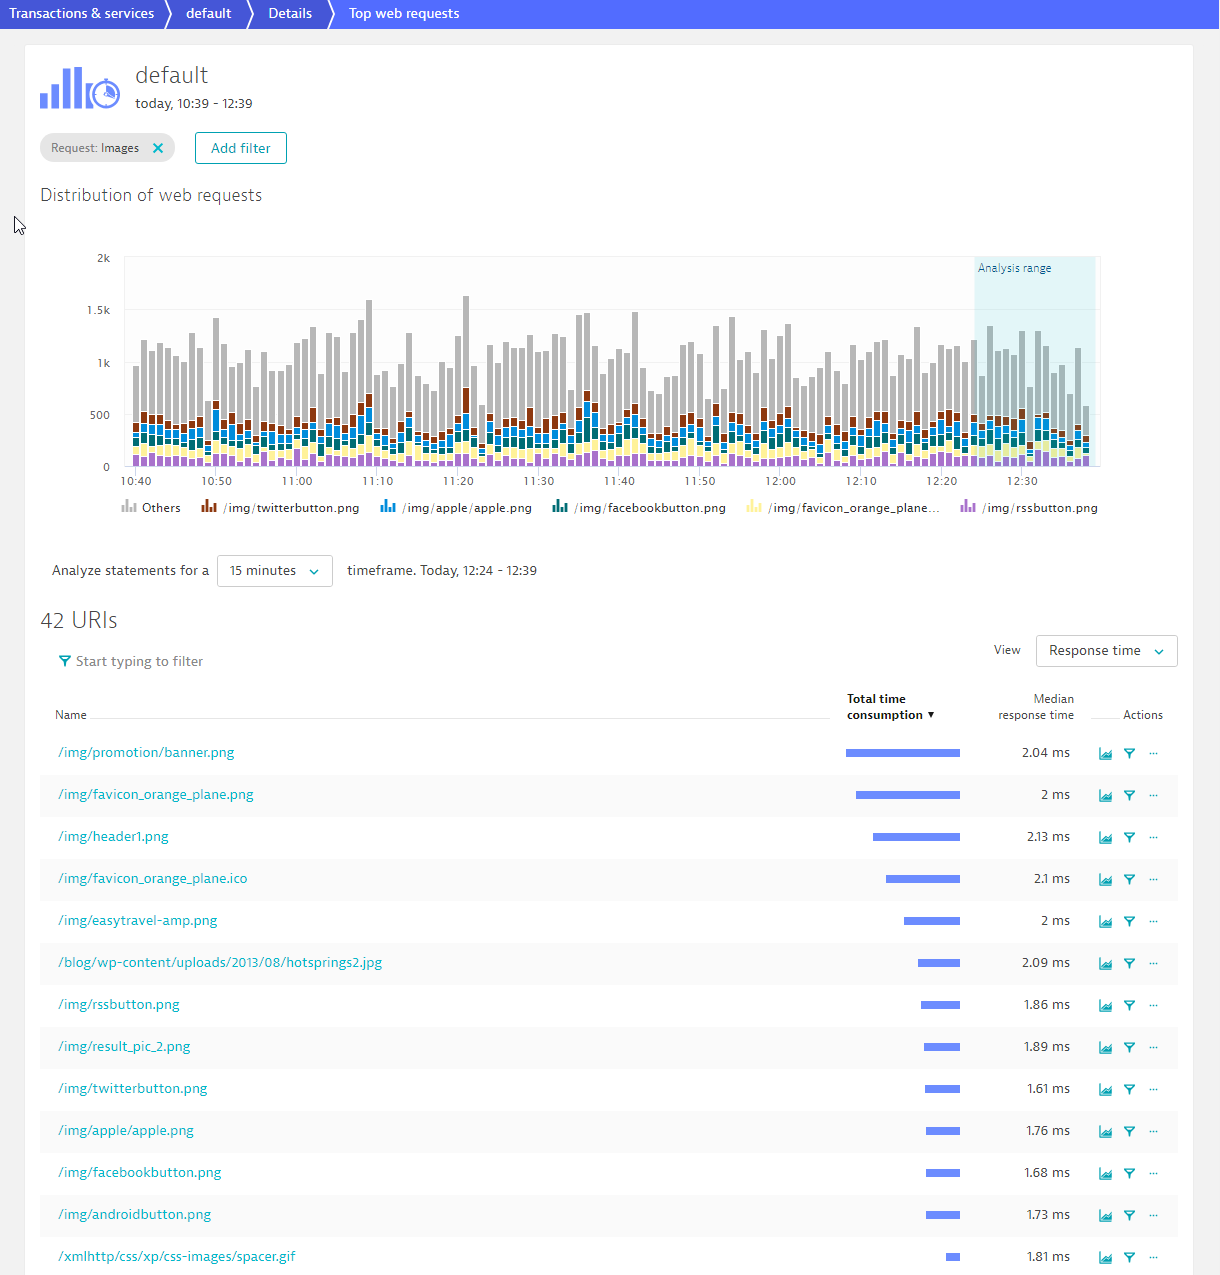
View complete URLs of web requests
The Top web requests view doesn’t always display the underlying web requests URLs but only the request names, which are based on configurable request naming rules. For web services, Name indicates the web service operation by default.
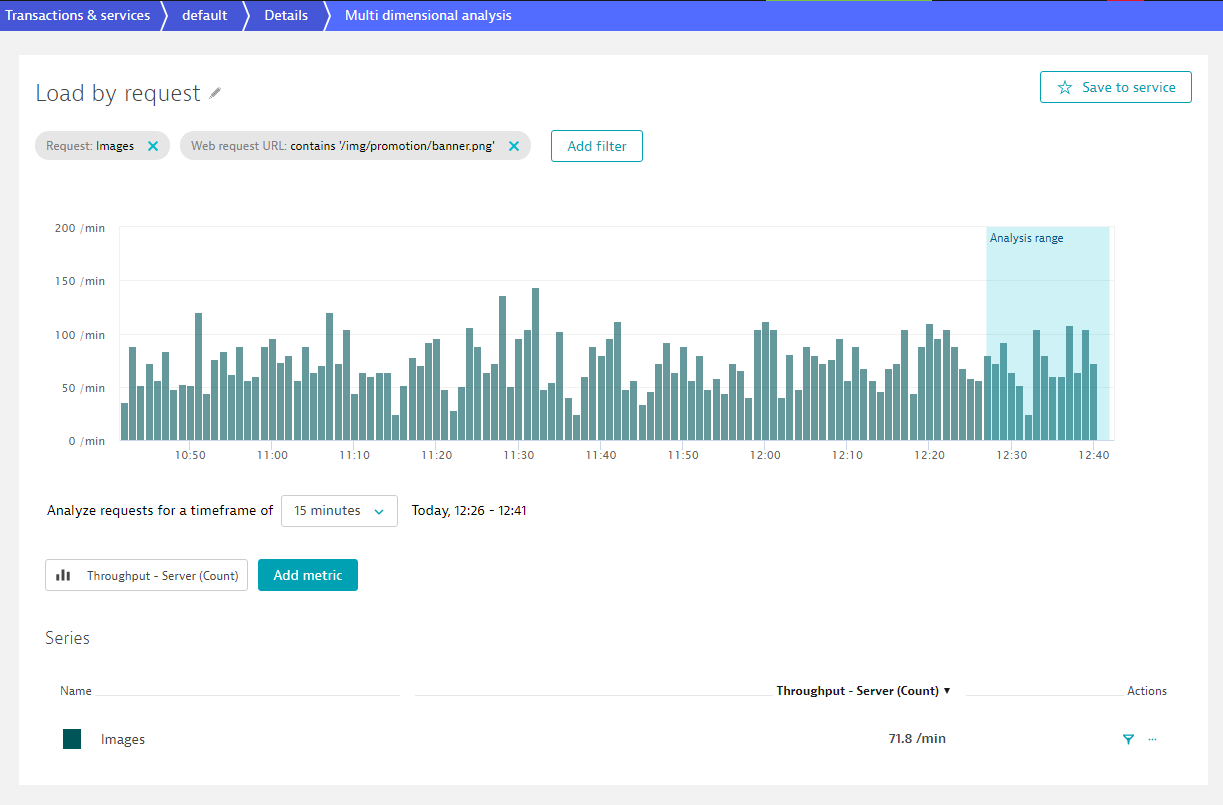
To see the URLs of any request, click the Filter button under the Actions column of the web request listing. The underlying URLs of the selected web request are listed at the bottom of the page. In the following image, we have selected Images as an example. The page displays all image requests or all URLs of an otherwise grouped request.
Multidimensional analysis View
This view also supports multidimensional charting. Each row features a Chart button next to the filter button. Click the Chart button to create a Multidimensional analysis view of the selected request that can be used to create your own analysis views.