Waterfall graphs
Sometimes it's necessary to analyze individual browser monitor executions to understand the impact of certain locations, local CDN partners, or other variables. Waterfall analysis is a great tool for viewing detailed information about the various resources that comprise a specific load or XHR action in an execution.
A waterfall graph is a graphical display of every request and resource downloaded for an action, which can be an entire page load (load action) or the update of a specific in-page context without navigating to a new URL (XHR action). Resource- and page-level analysis is based on W3C timings.
Waterfall graphs are available on the Synthetic Multidimensional analysis page for every action (an event with timings) in browser monitor executions—both single URL and clickpaths.
Used in conjunction with the scatter plot and filters on the Multidimensional analysis page, waterfall graphs can help you narrow down the specific resources in specific executions that are causing failures or performance violations. Top findings for each waterfall abstract waterfall data into accessible and actionable information.
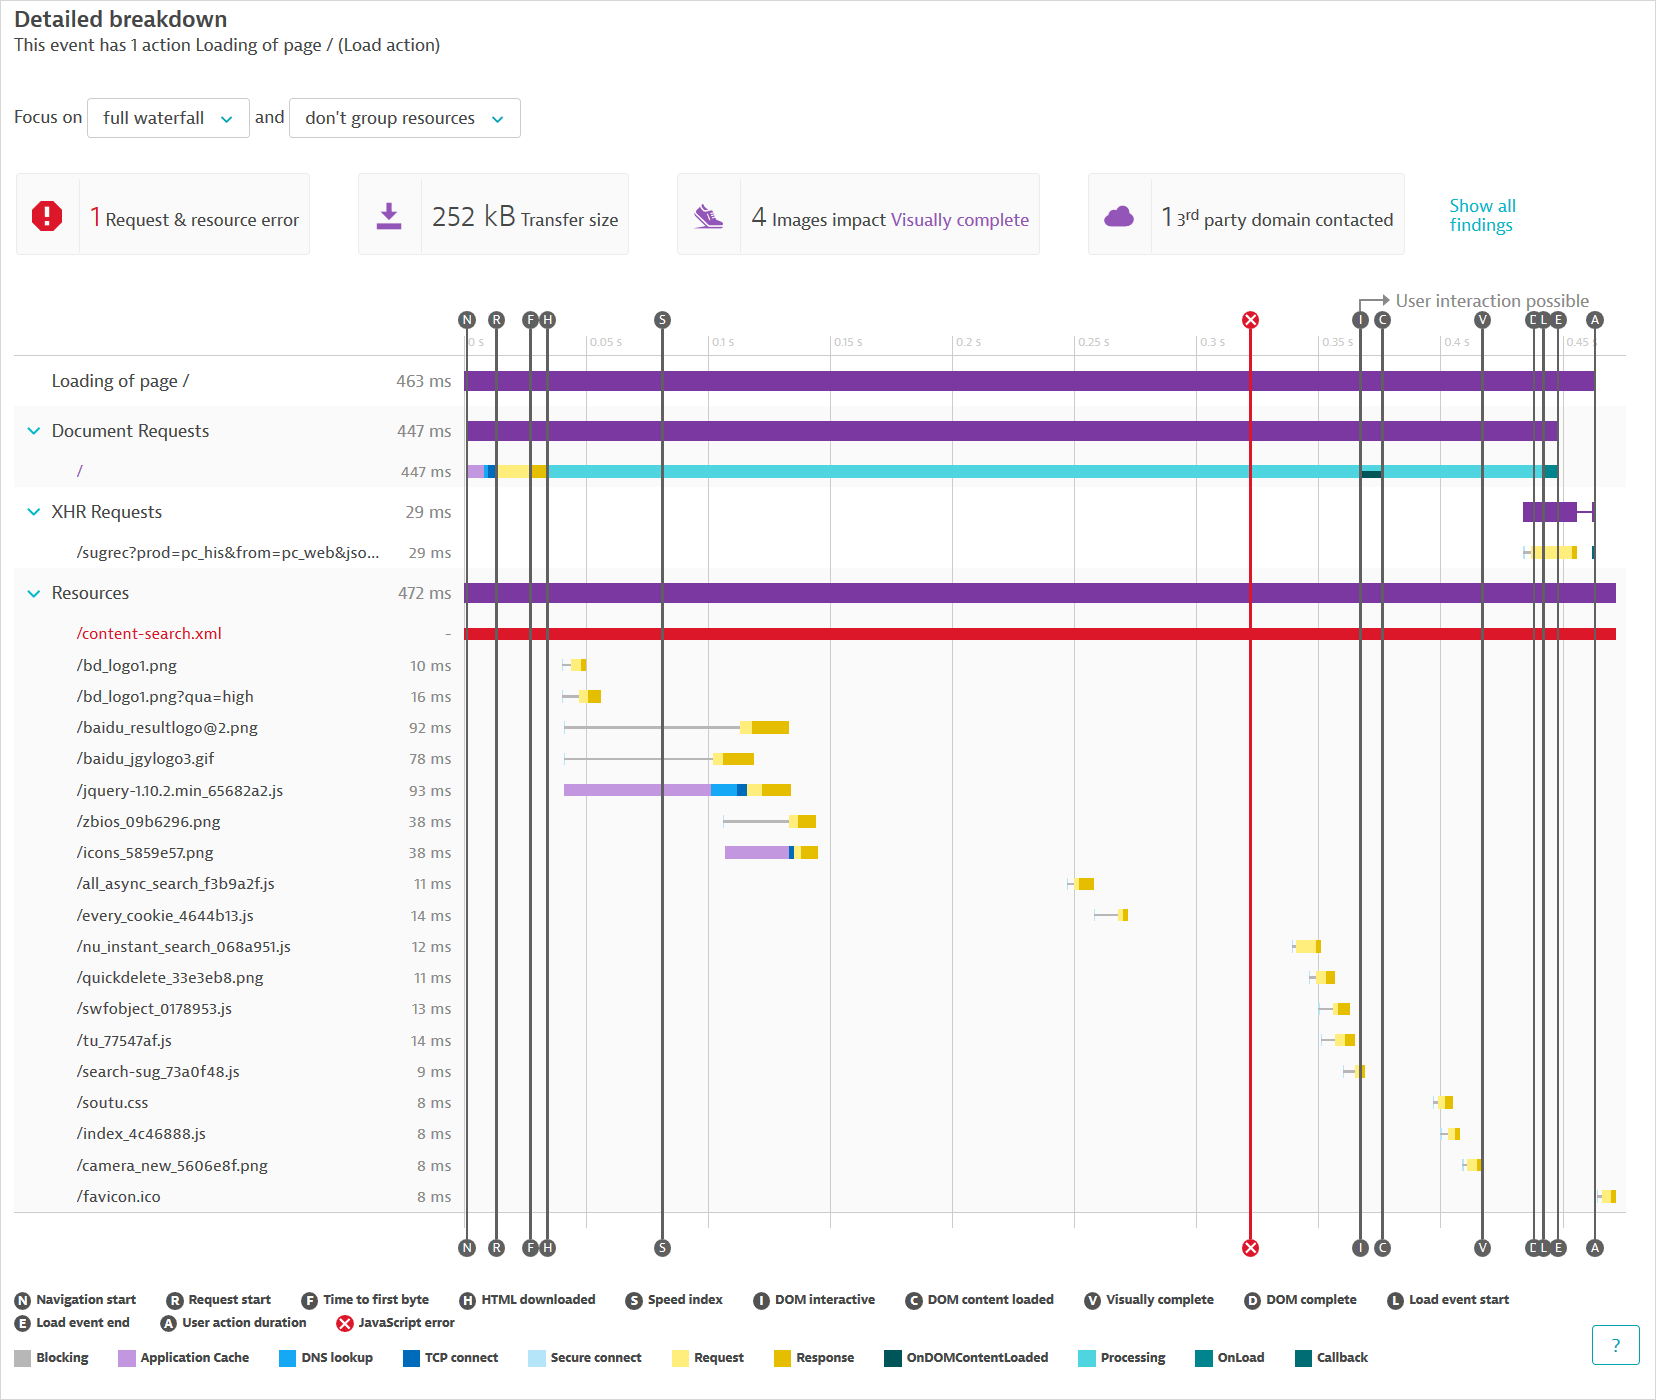
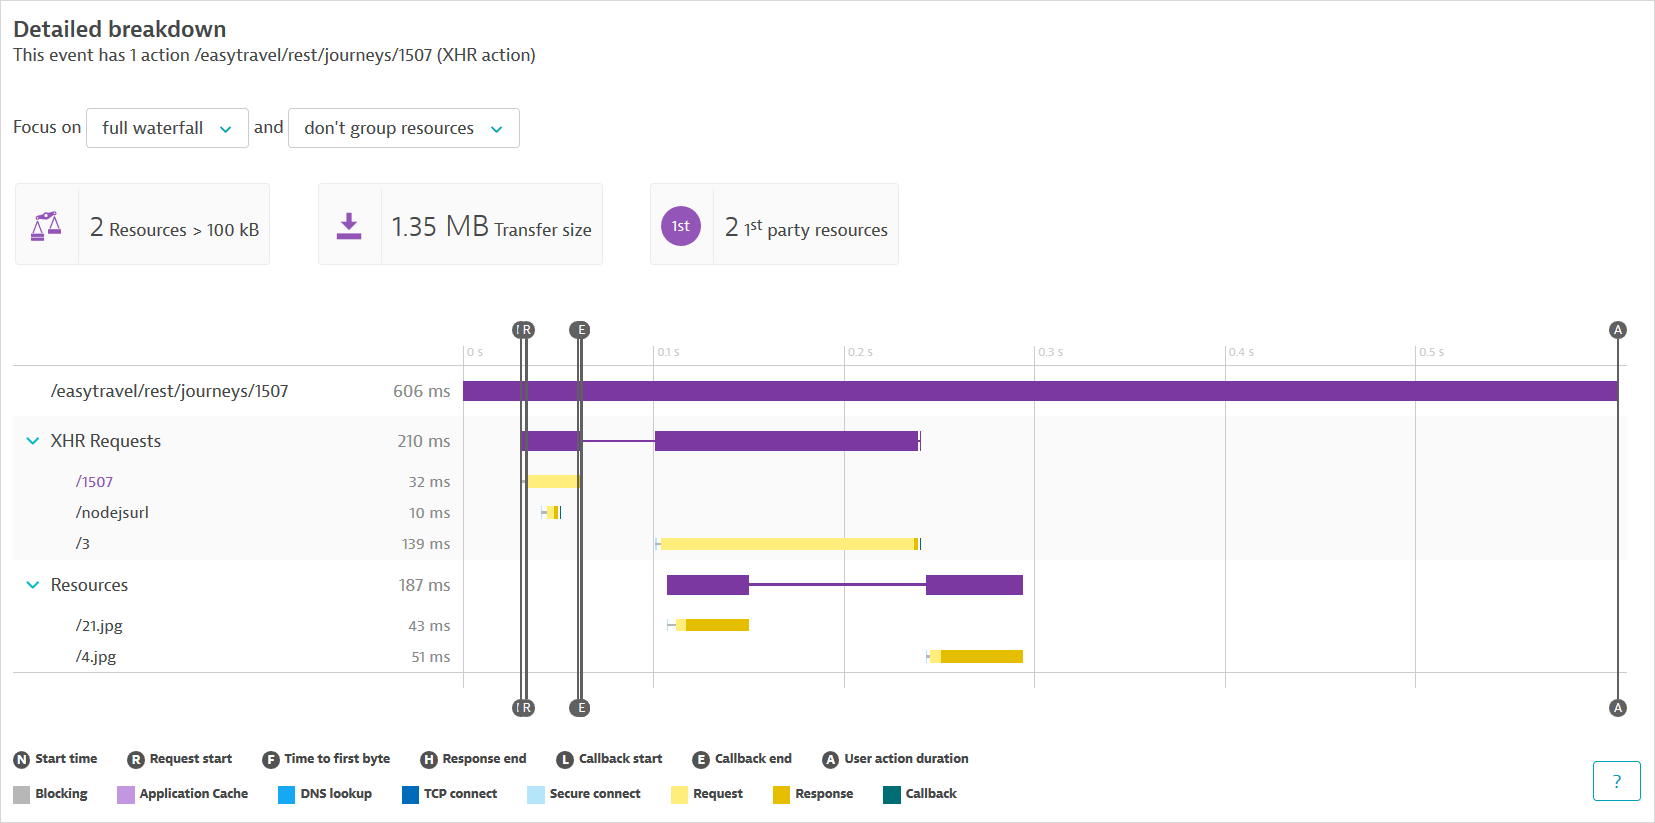
The images below show waterfall graphs for a load and XHR action respectively.
Note that failed executions can have waterfall graphs for constituent actions up to the point when the monitor failed. So, depending on the step at which failure occurs and the error type, you can find waterfall graphs even for monitors with 0% availability, and, consequently, no monitor-level performance data.
Understand the data in waterfall graphs
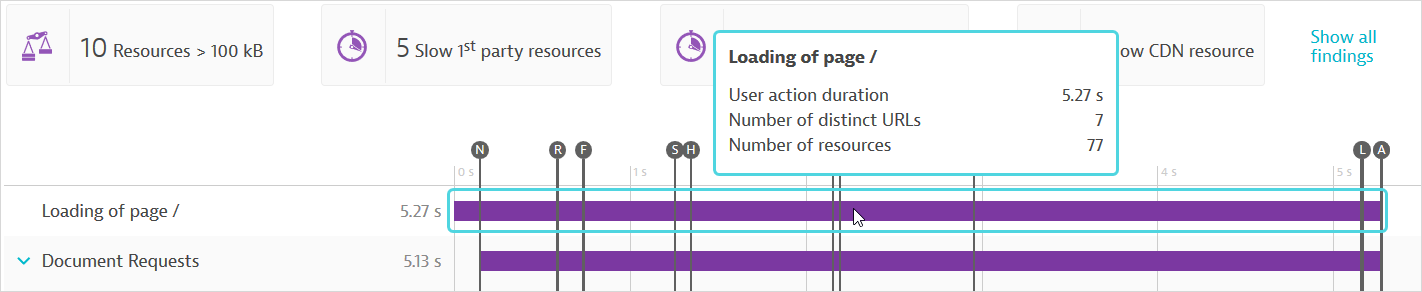
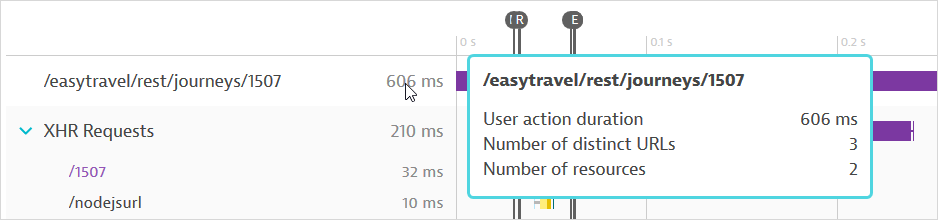
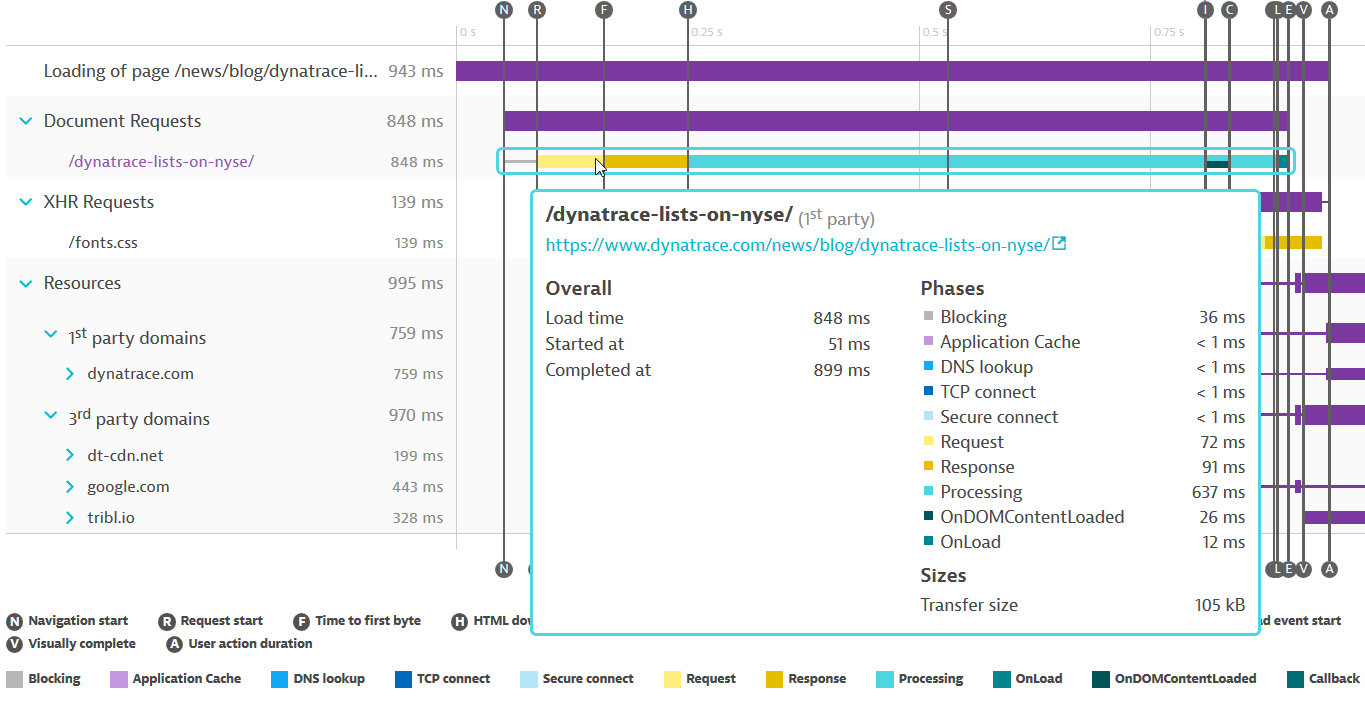
The initial entry in a waterfall graph (Loading of page in a load action or a URL in an XHR action) shows the overall user action duration. The user action duration is also represented by the vertical timing line A.
Hover over the entry to see additional information on the Number of resources downloaded or distinct URLs contacted. (Check findings for the number of first- and third-party resources.)
The waterfall graph organizes its main entries into three categories, Document requests, XHR requests, and Resources. Hover over a request or resource to see the full URL.
Document requests
This section lists the base page and is, therefore, shown only for load actions, which load an entire page. The initial request, usually the base page, is highlighted in purple.
Base page timings are the basis of the page-level vertical timing lines displayed on the chart. For example, the start of base page load time marks the W3C Navigation start metric (the vertical timing line N). Load actions have a different set of page-level timing events compared to XHR actions.
If there's a redirect in place for the page you navigate to, the document request and resources for the page you are redirected to are shown.
Hover over the entry to see a breakdown of its load time into components. The Processing, OnDOMContentLoaded, and OnLoad components are only applicable to the base page.
DESK Synthetic includes processing time in its waterfall display and calculation. Processing time, which is time spent in JavaScript execution or simply browser overhead, is represented by the gap between the end of one resource and the start of another. Processing time is shown as a component of base page load time.
XHR requests
Load actions as well as XHR actions can contain XHR/fetch calls, or resource requests that do not result in a complete page load. An example of generating XHRs is typing into a form field and seeing autocomplete suggestions that change dynamically as you type.
The initial XHR in an XHR action is highlighted in purple, and its timings are displayed as page-level timings in vertical lines. XHR actions have a different set of page-level timing events compared to load actions.
XHR entries display W3C resource timings as well as any JavaScript callback times—in the Callback component. The Callback component is only applicable to XHRs.
Resources
Resources are listed in the order requested and indented to show the offset from the start of page navigation when each was called. Check the top-most entry in a waterfall graph to view the total number of resources downloaded; check findings to view the breakdown by first and third parties.
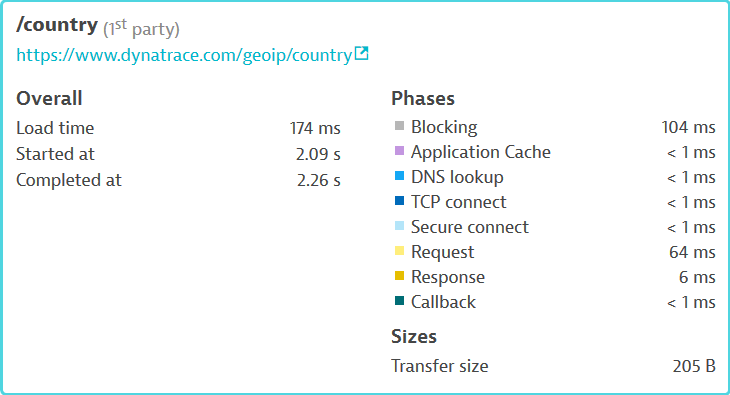
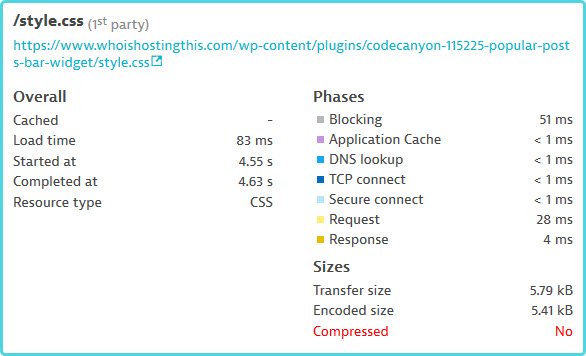
Each resource's download time and its components are shown in relation to that of other resources and in the context of overall page-level W3C timings. Hover over a resource to see timing details.
Resources can be grouped and filtered.
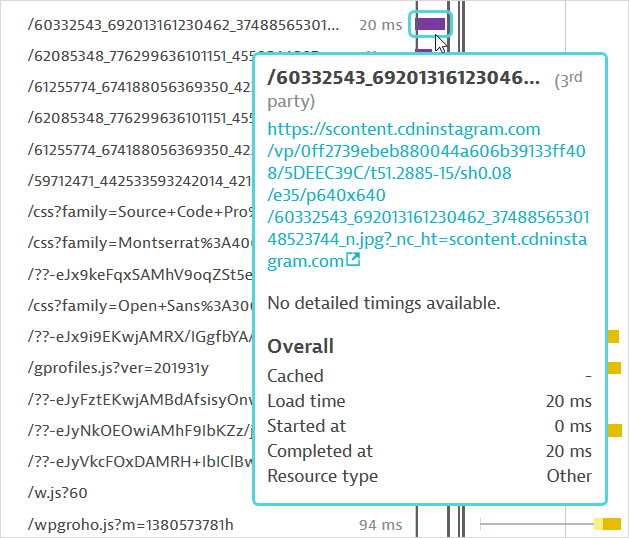
If you have blocked requests to specified domains in monitor settings, resources from such domains are shown without detailed timings.
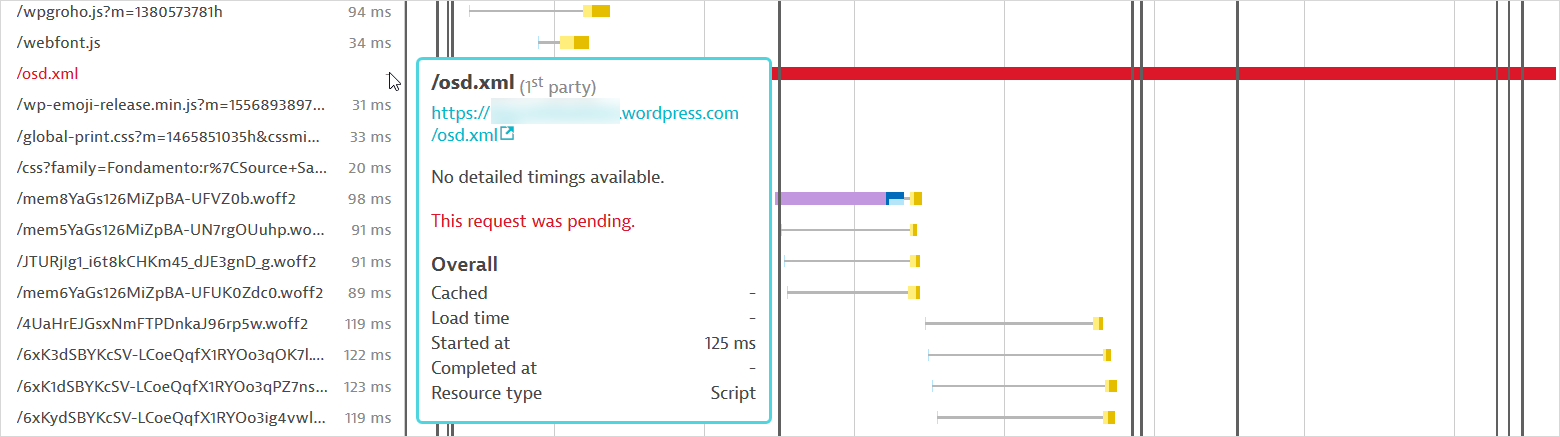
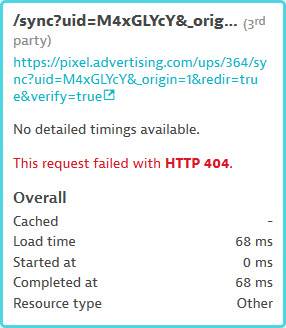
Failed resources are marked in red. Hover over the resource for an explanation. Note that a failed resource does not necessarily result in action or monitor failure.
Findings
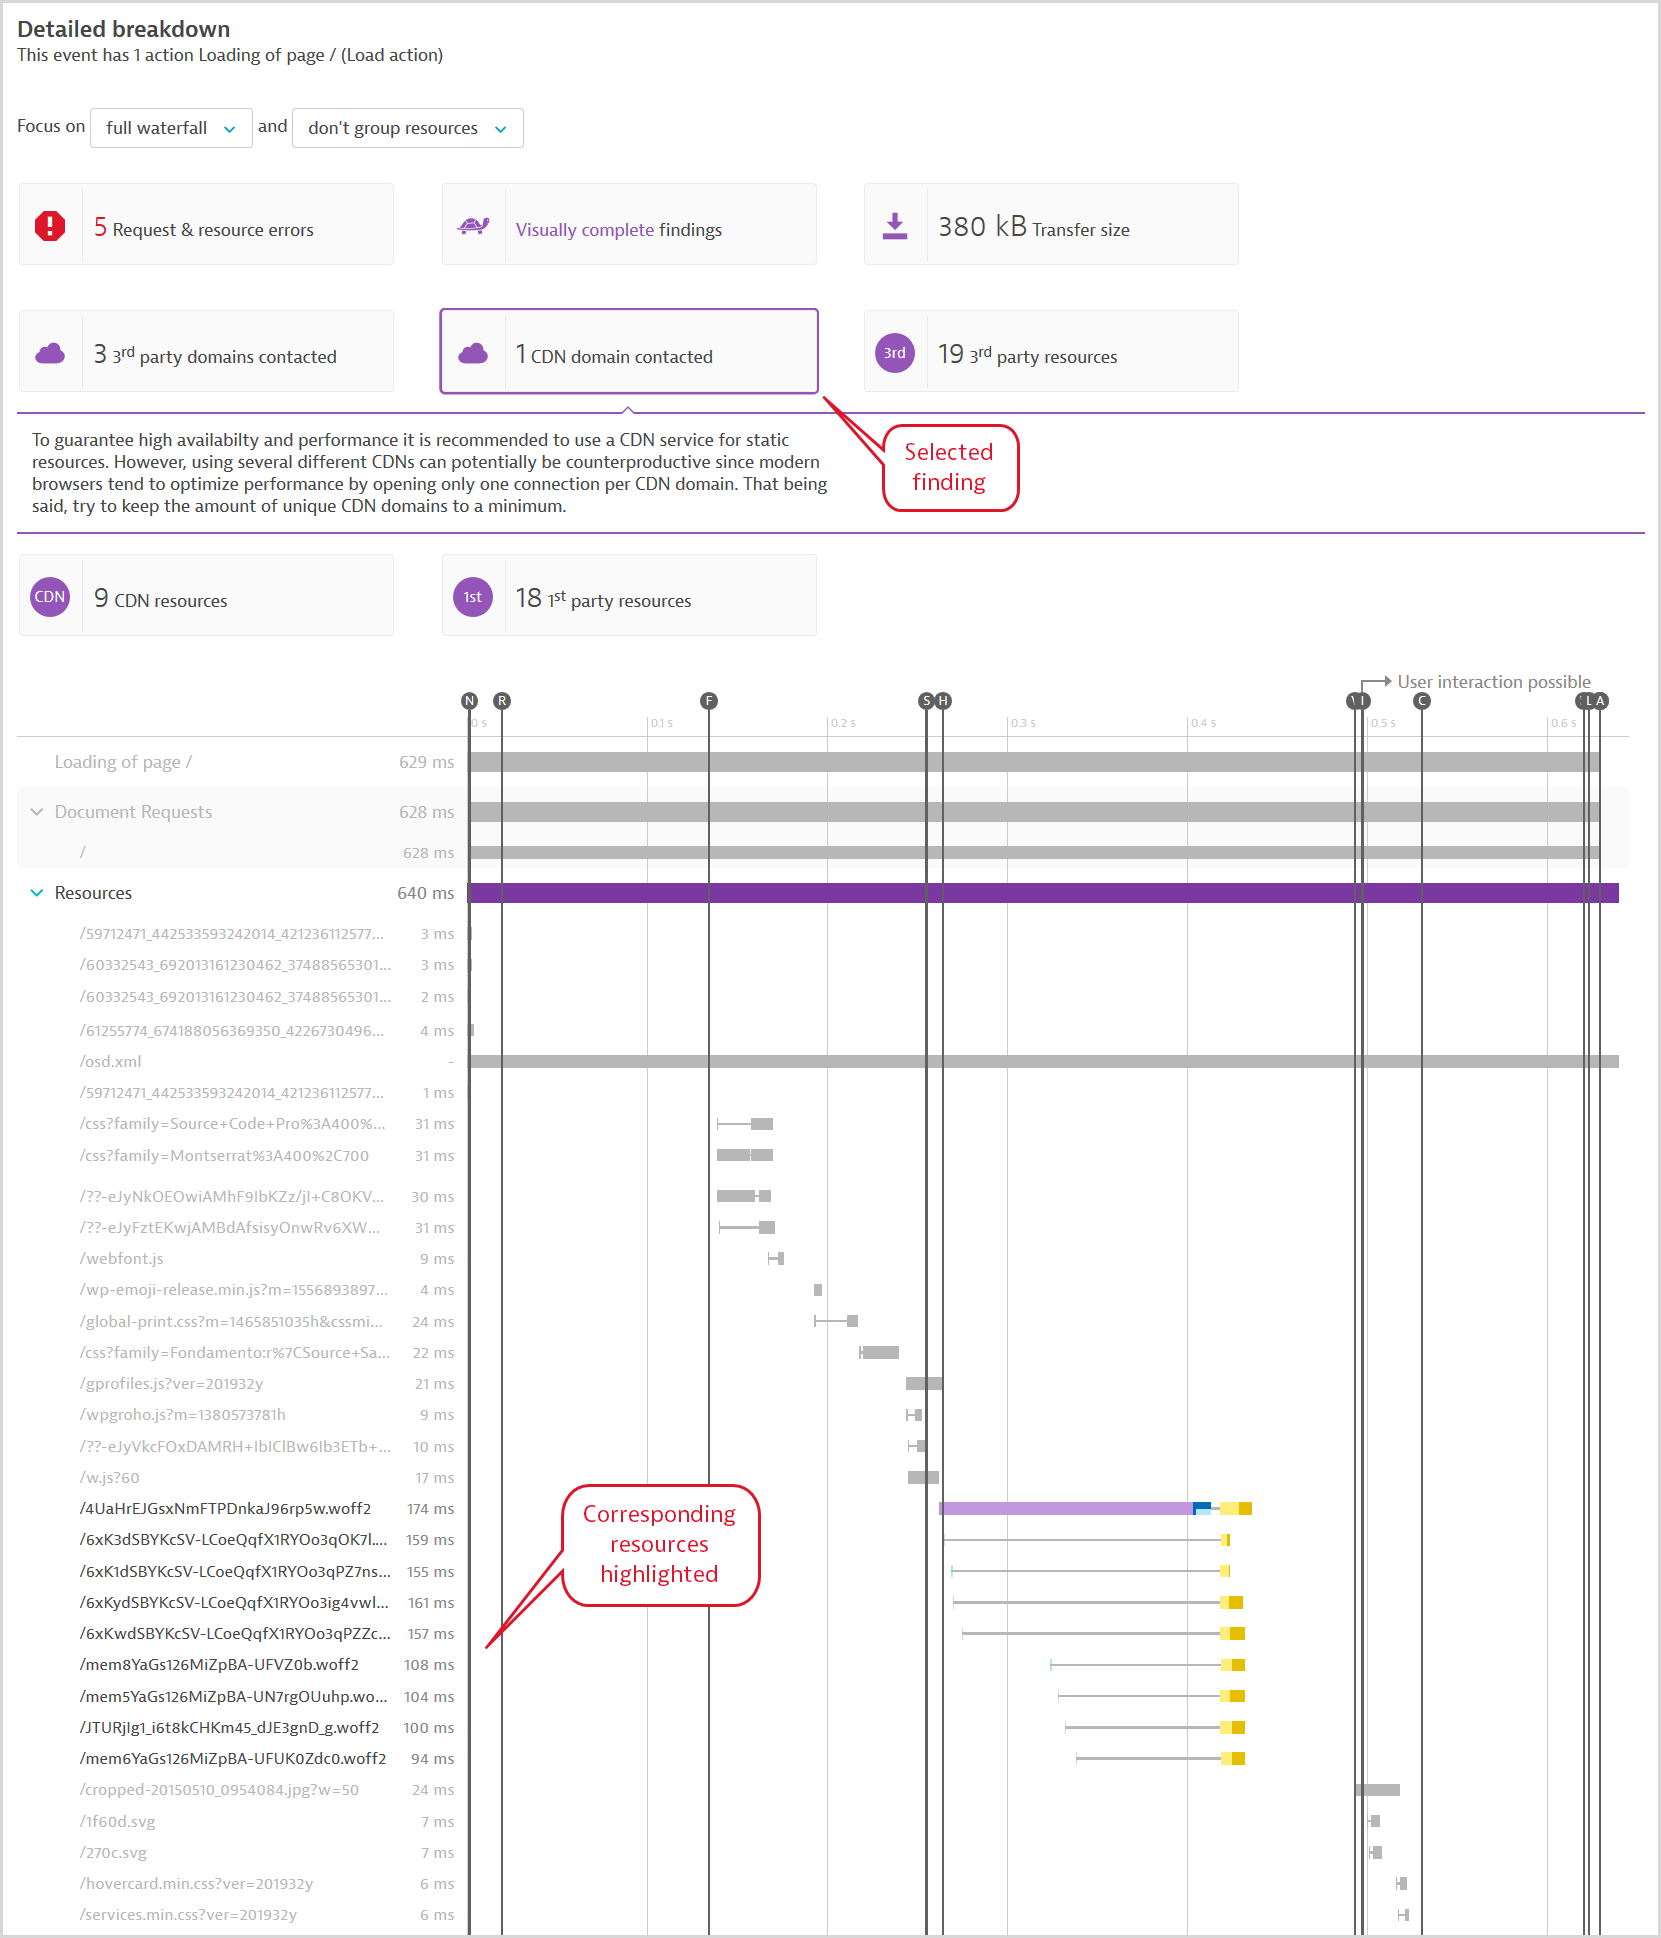
Davis, the DESK AI causation engine, automatically detects top findings for each waterfall. Findings are key statistics and tips that capture how resources can impact page-level W3C timings of the initial request of an action—the base page in the case of load actions or the initial XHR in the case of XHR actions. Initial requests drive the first impressions of new visitors. Top findings are tools that help you identify which resources can be optimized, such as the resources impacting Visually complete (the user's above-the-fold experience), uncompressed text resources, large resources, or slow CDN resources.
Select Show all findings to expand the list of findings above a waterfall. Select a finding to highlight the associated resources in the waterfall graph.
Another finding highlights uncompressed text resources; if an uncompressed text resource is larger than 860 bytes, the hover data on compression is highlighted in red. This threshold may be configurable—see below.
Thresholds for findings
You can also find default values for findings here. For example, you can determine how large is too large when it comes to being warned about the size of resources.
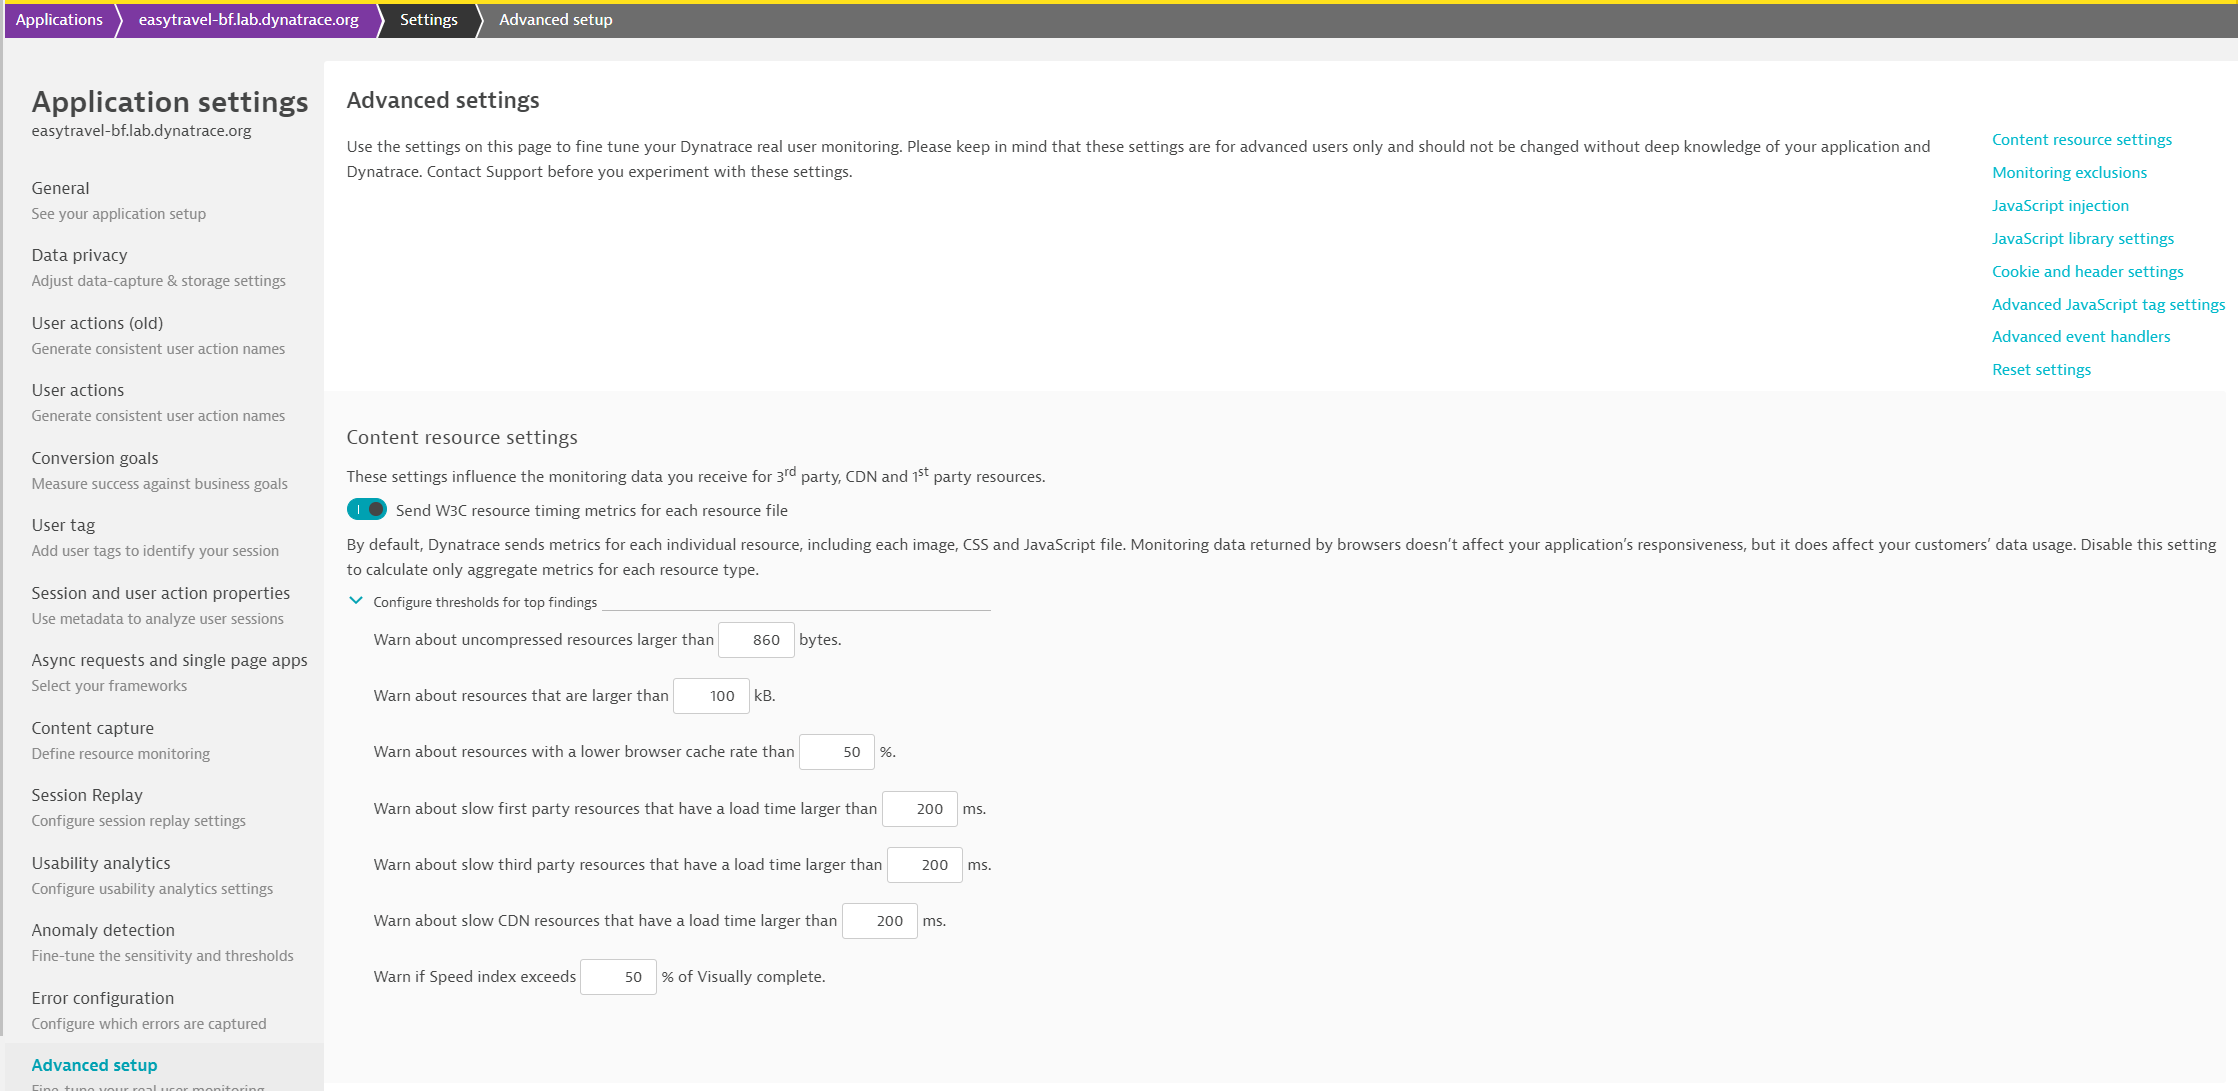
To configure thresholds for top findings
- Select Applications from the navigation menu.
- Select the application you want to configure.
- Click the Browse button (...) and select Edit.
- Select the Advanced setup tab.
- In the Content resource settings section, expand Configure thresholds for top findings.
PurePaths for visibility into application infrastructure
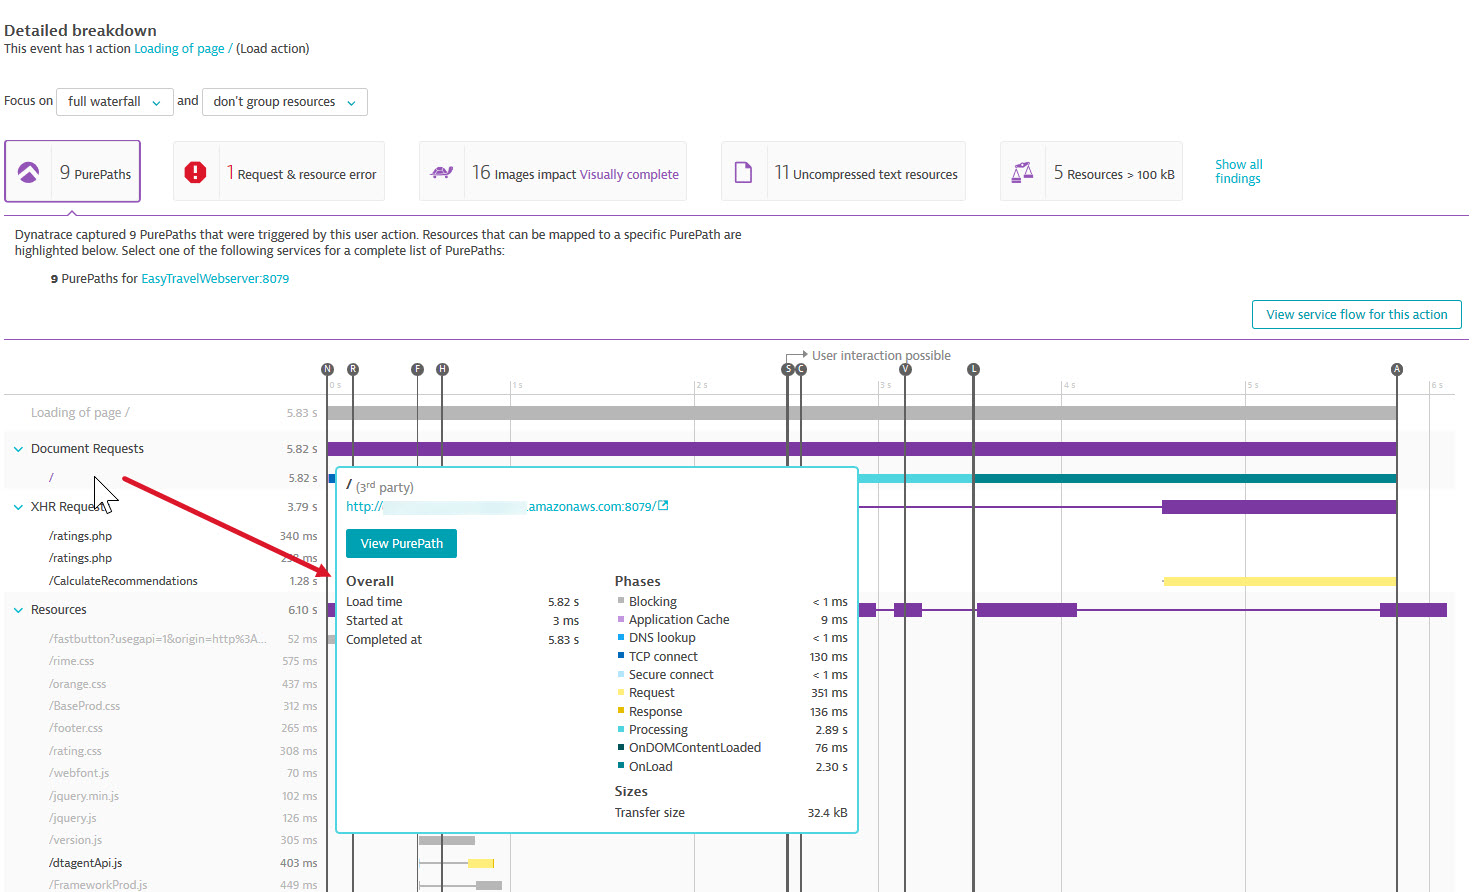
The PurePaths finding is displayed when your browser monitor runs against an application with a OneAgent instance installed on the server side. A PurePath traces a web request through your application infrastructure so you can see what is driving performance behind the scenes at the application level. If you see that one or two requests are taking the majority of the time on a slow page, you can drill into the PurePath to see, for example, if there are too many database requests or just one slow request. You can then use this information to drive performance improvements or error analysis.
When you click the finding, the associated requests and resources are highlighted in the waterfall. You can click the link provided in the top finding to access all available PurePaths or hover over an individual resource/request to drill into a specific PurePath. You'll probably want to analyze PurePaths for your dynamic requests (document requests or XHRs) rather than individual resources. In the image below, hovering over the document request displays the View PurePath link for that request.
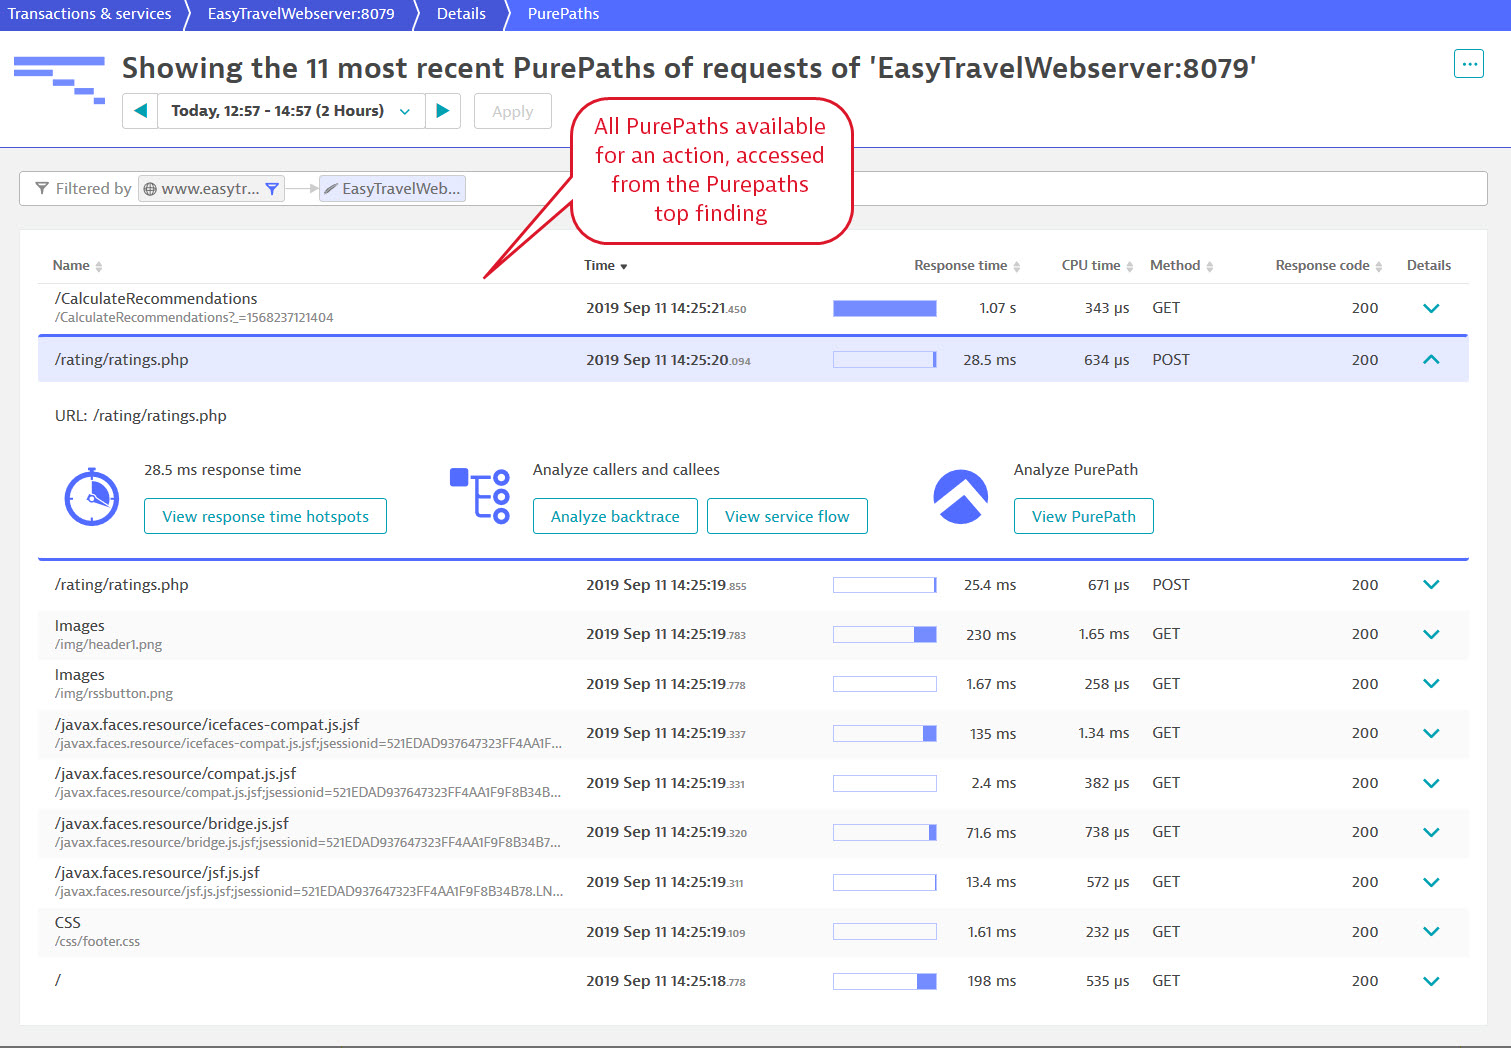
In the PurePaths list view, select a resource/request and drill down to View PurePath.
-
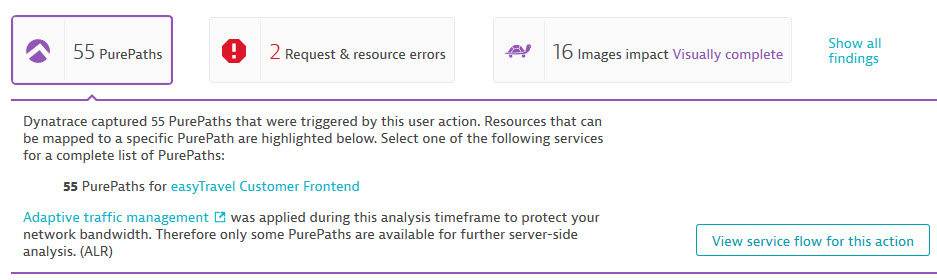
For processes that are under heavy load, DESK OneAgent automatically adjusts the data sent. Therefore, certain PurePaths may not be available. In such cases, you'll see this message about adaptive traffic management in the PurePath finding.
-
Drilling down from an individual resource (based on W3C resource timings) to a PurePath (captured by OneAgent) is enabled by comparing URLs. If there are any rewrite rules or if parts of the URL aren’t identical on the client and server sides, the View PurePath button for the resource won’t be displayed. In such cases, you can get to all your PurePaths from the PurePath finding.
JavaScript errors
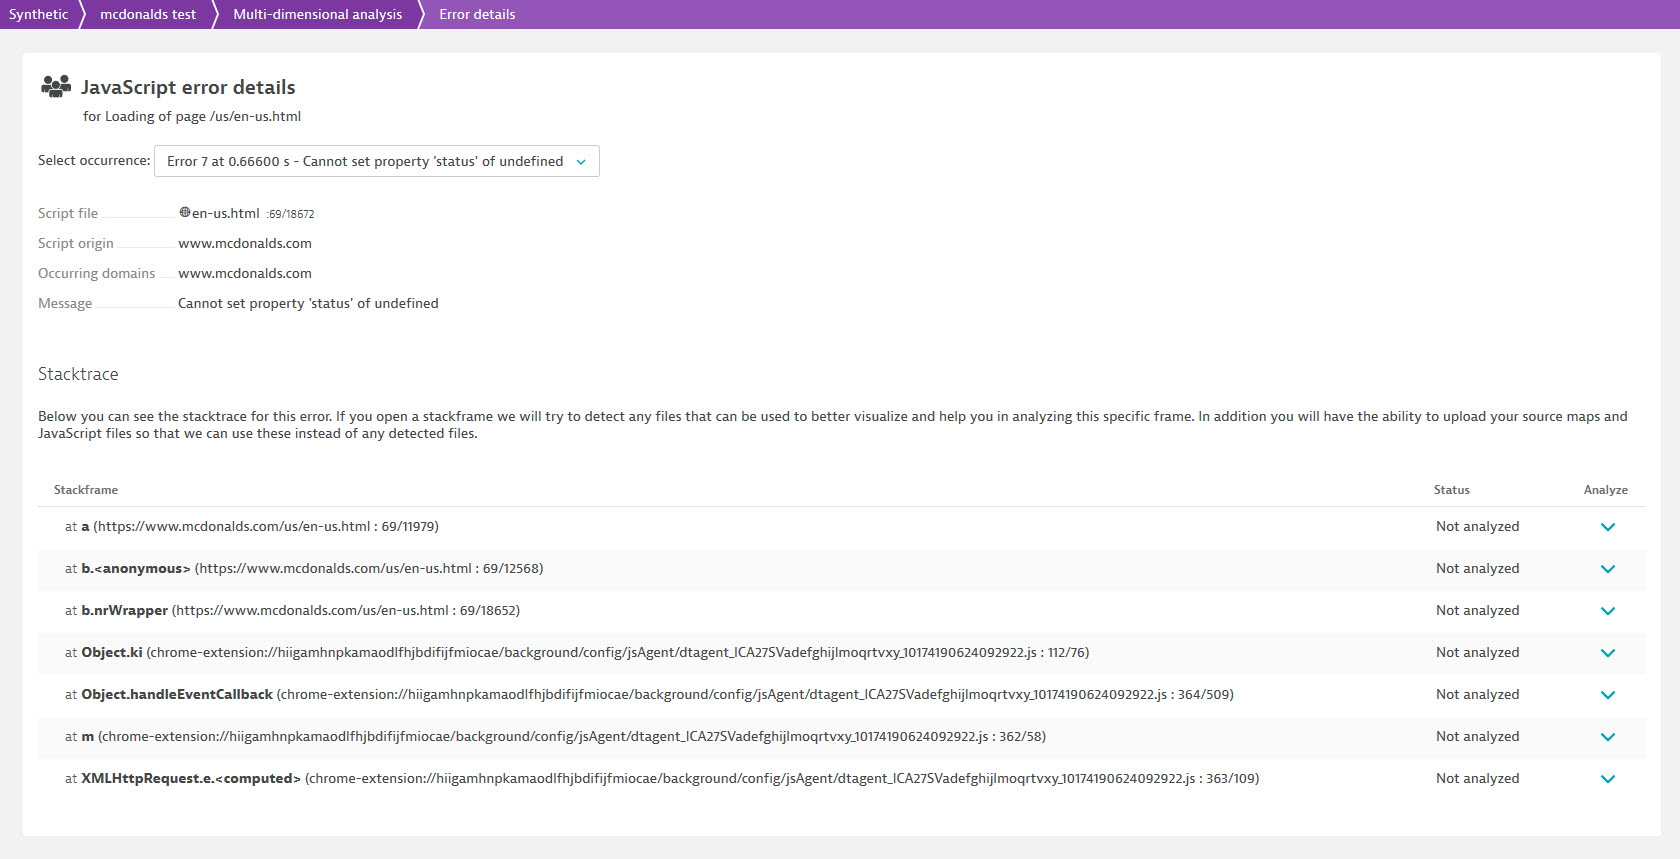
You can analyze the details of JavaScript errors that are detected during the execution of load or XHR actions. JavaScript errors appear as red vertical markers in the waterfall timeline at the point they occurred during the execution. Click a marker to analyze the details of that error. JavaScript errors do not lead to monitor failure, and monitor failure is not directly attributable to any JavaScript errors.
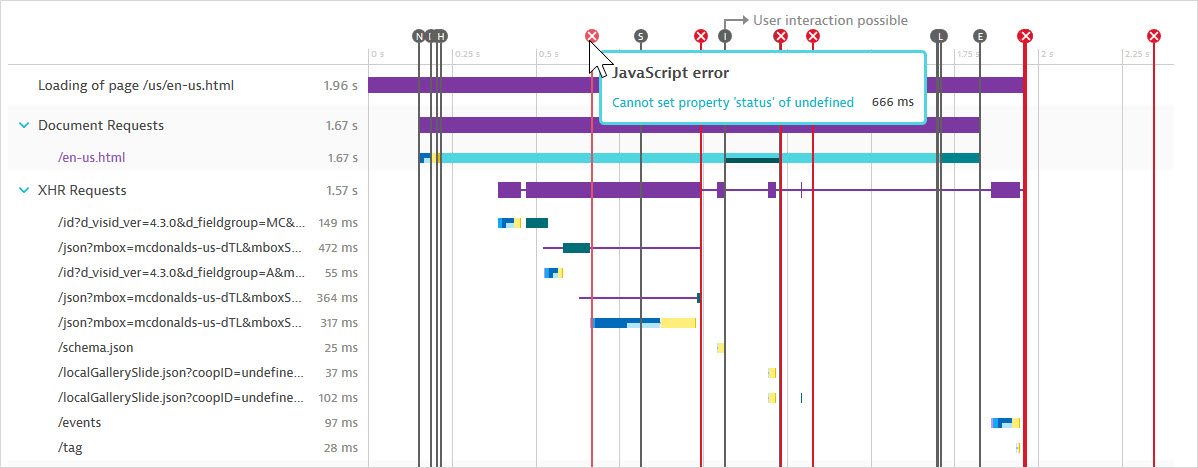
The Error details page for each detected JavaScript error includes a complete stack trace that identifies the exact line of code responsible for the error. This insight can dramatically accelerate the time it takes to resolve such errors.
Grouping, filters, and legend
Grouping and filtering tools help you focus on the resources that matter to you. You can combine grouping and filtering controls.
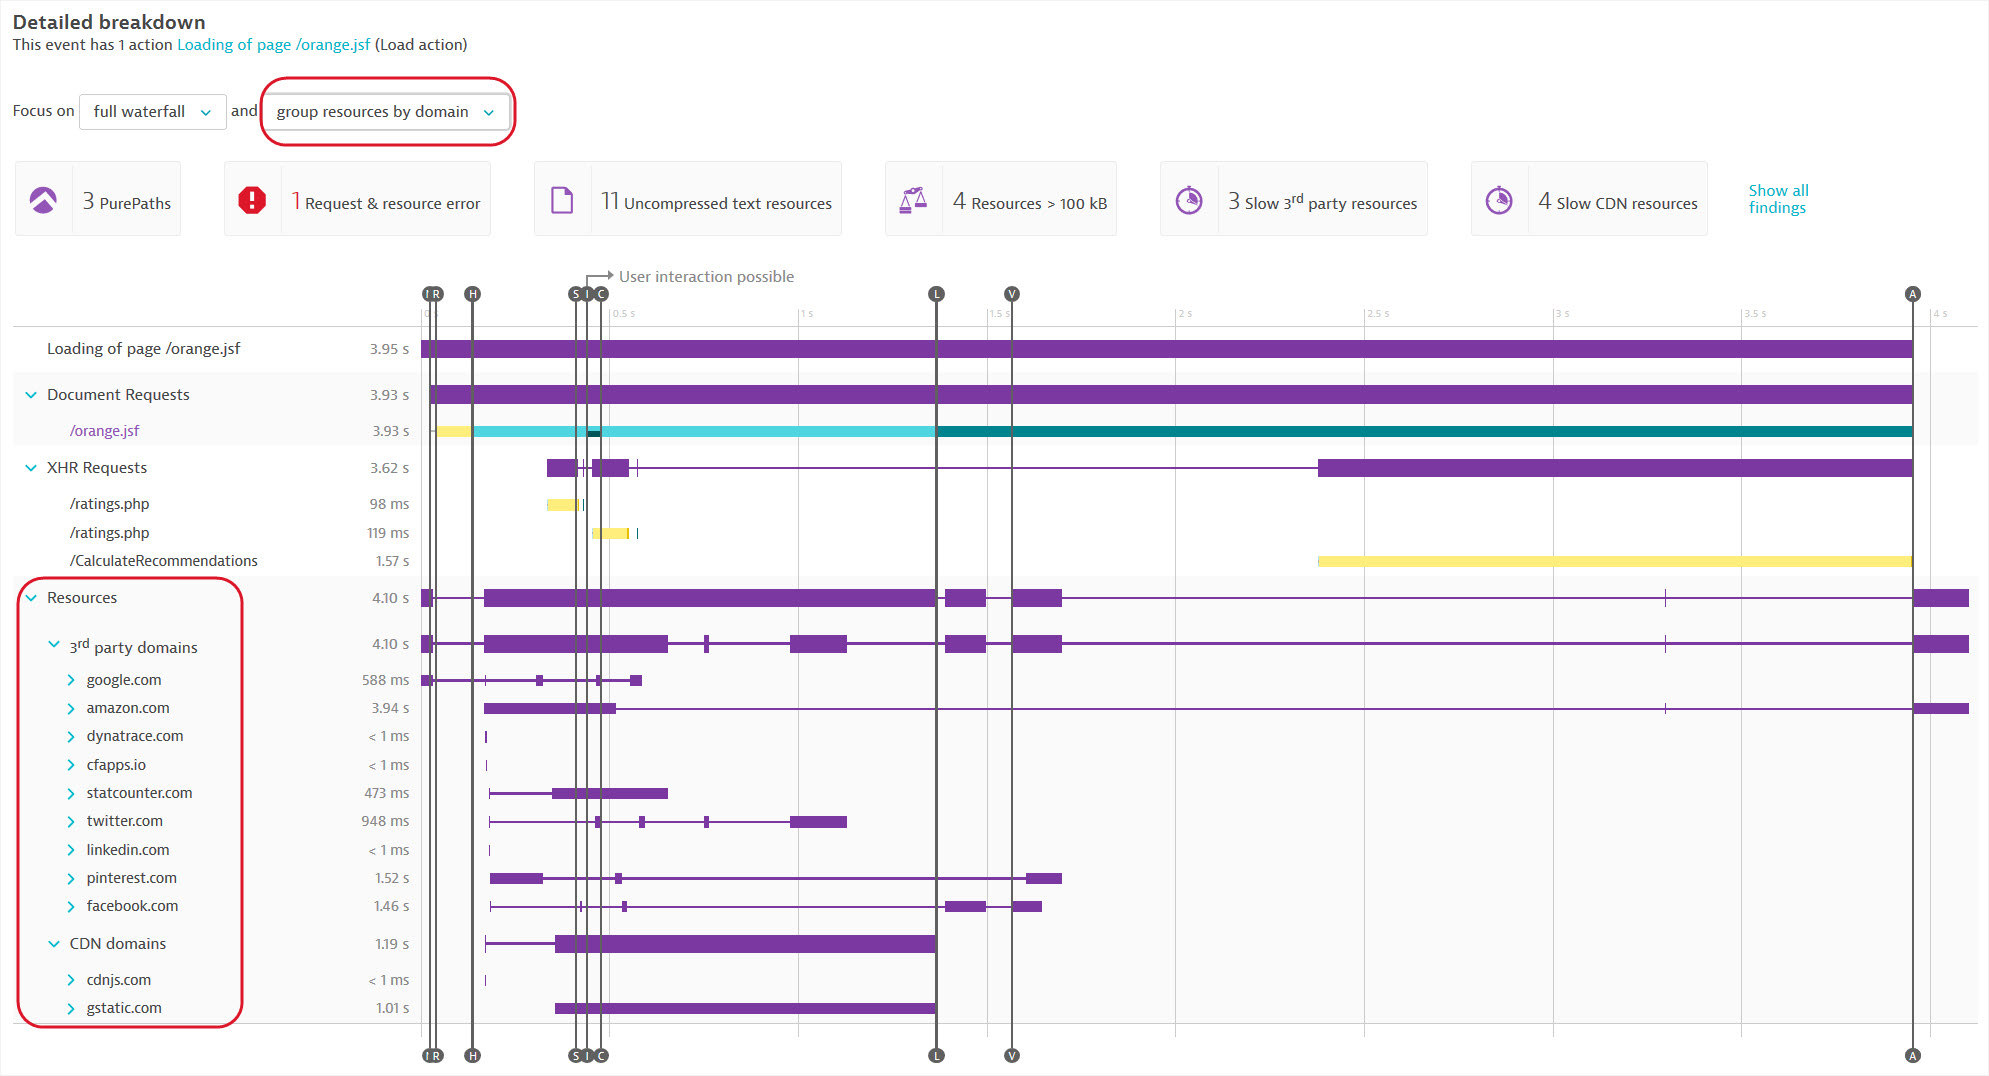
Grouping by domain organizes resources into first-party, third-party, and CDN domains. You can see the load order and timing details for specific domains.
Grouping by type allows you to see the main categories of first-party, third-party, and CDN resources—image, script (JavaScript), CSS, and others.
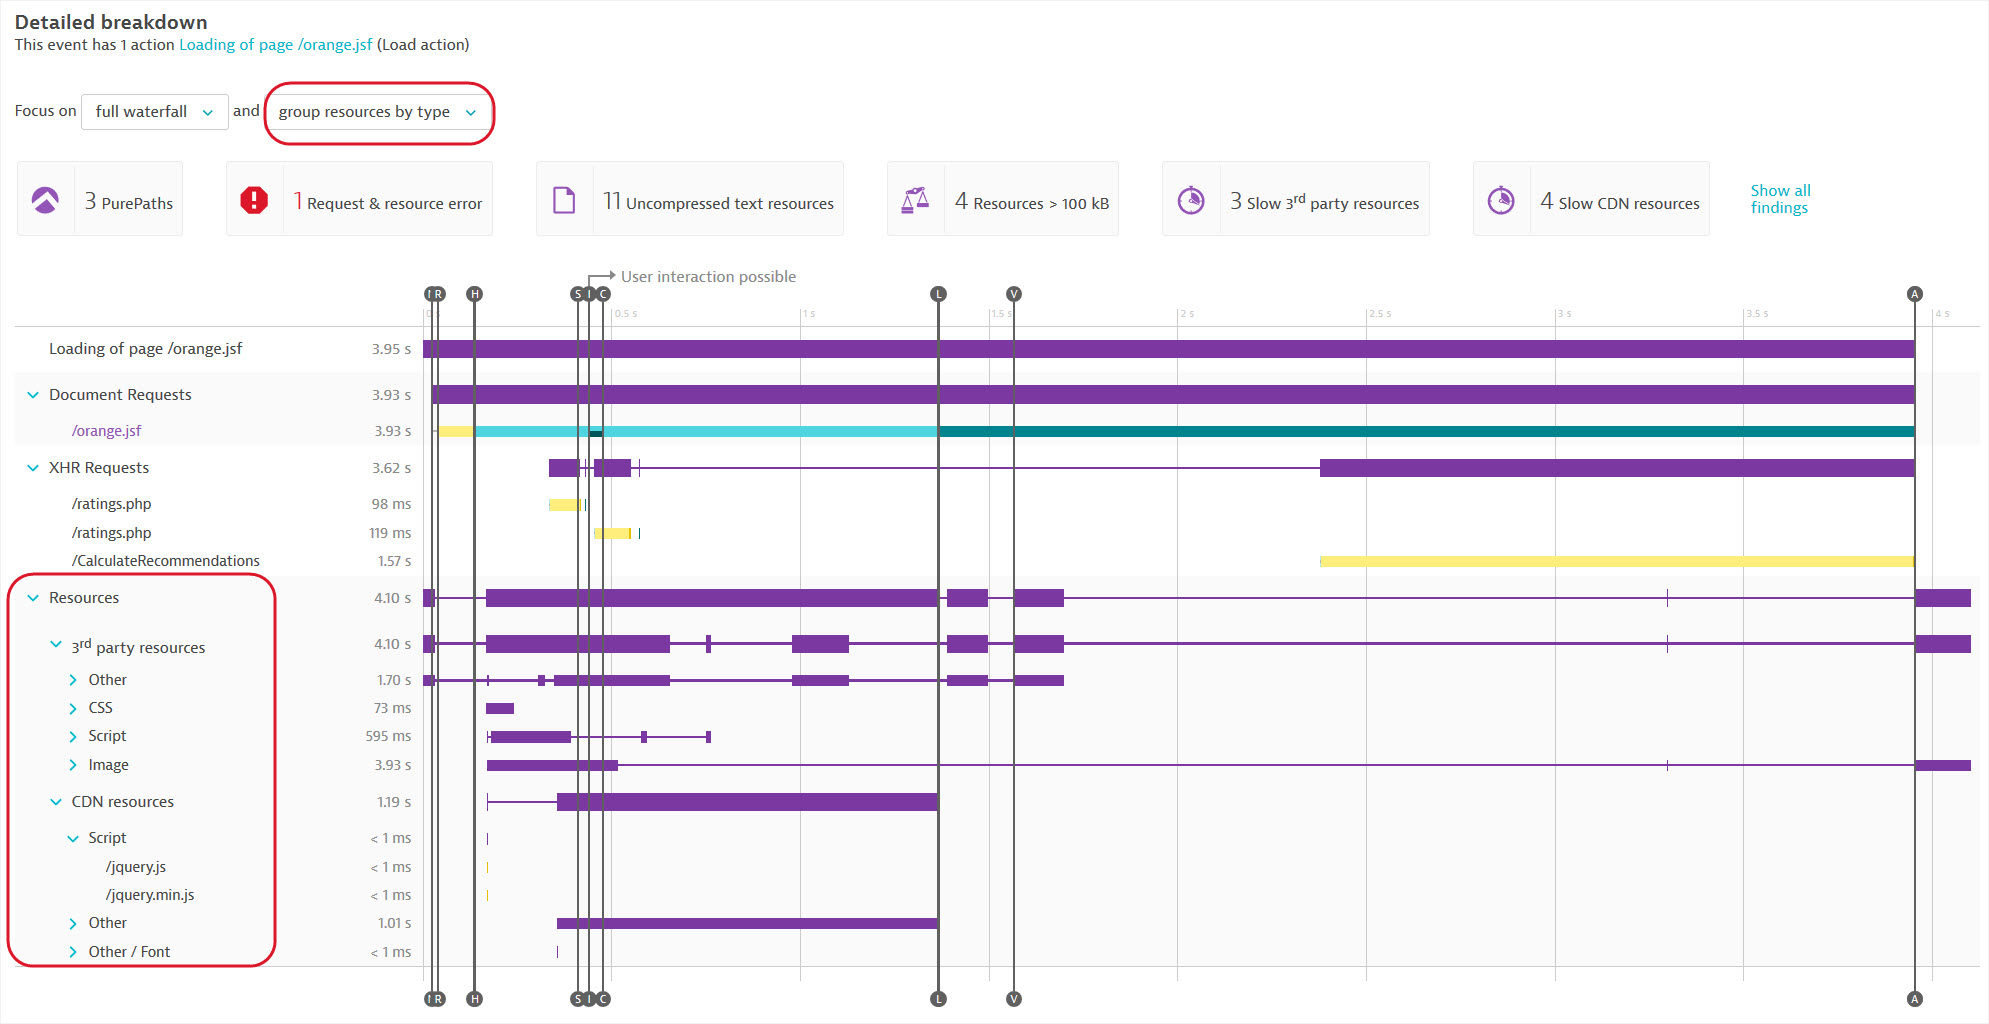
Note that the group-level timings represent the end-to-end timings for loading the resources of a given type/domain; these timings are not additive, in that individual resource times do not add up to group-level timings, as resources can be loaded concurrently.
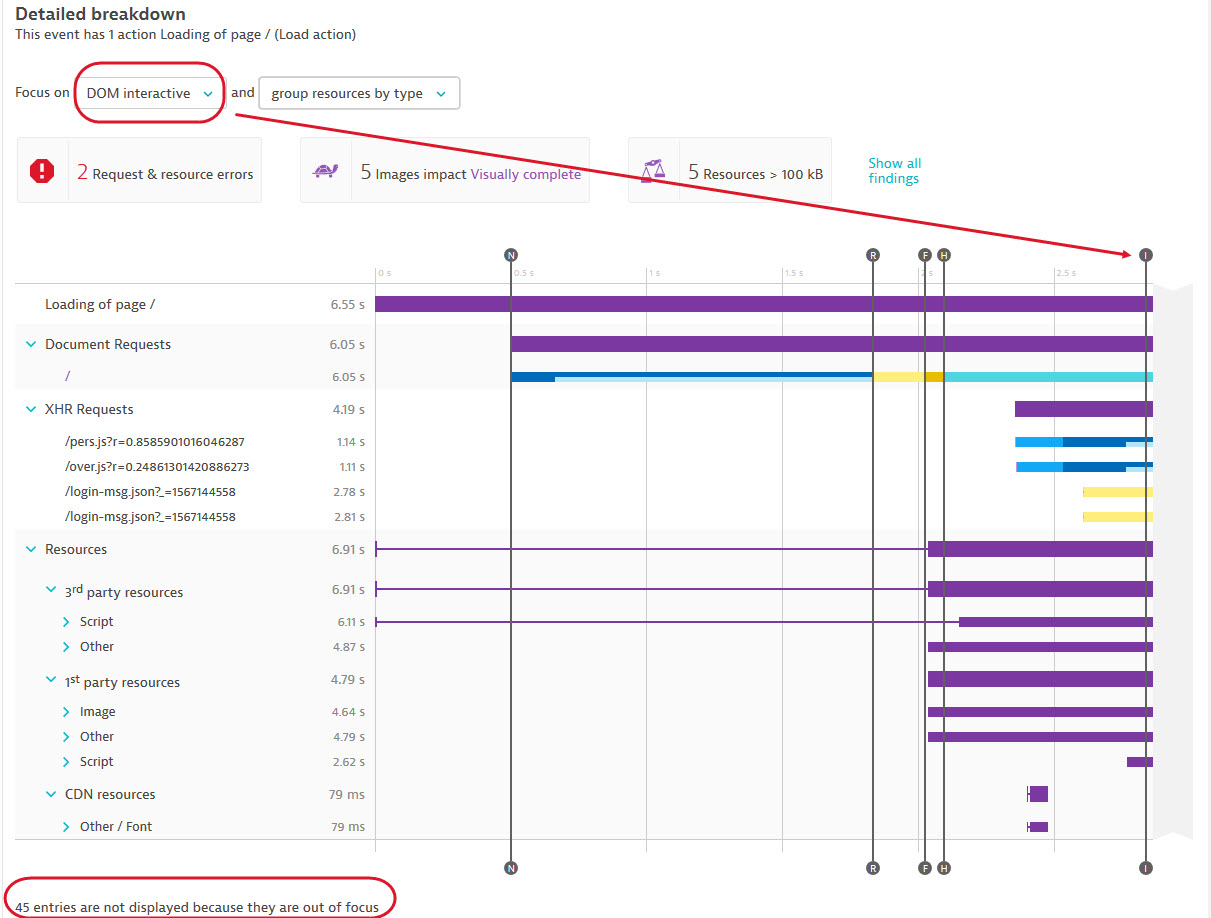
Filters allow you to focus on resources that most impact your user experience. You can view the full waterfall, or Focus on just those resources up until significant browser events such as DOM interactive or Visually complete.
The legend at the bottom of the waterfall lists the following with detailed descriptions below:
- W3C page-level metrics
- JavaScript errors
- Resource timing components
Select any of these to exclude/include them from the waterfall graph. The images below show the browser events and resource timing components available for load actions and XHR actions, respectively.

Note that the Speed Index metric is not available for XHR actions. Speed index is only applicable for load actions as the whole page is used as a reference for calculating the index.
