Prediction-based anomaly detection
Anomaly detection is an effective means of identifying unusual or unexpected events and measurements within a web application environment. As the term “unexpected” can also be read as “statistically improbable,” it should be clear why anomaly detection depends heavily on deep knowledge of a system's baseline performance and behavior for its insights and load forecasts. This is why DESK monitors entire technology stacks end-to-end within web-scale environments. DESK monitors the baseline performance and behavior of applications, services, infrastructure components, and more. DESK captures metrics related to availability, error rates, response times, service load, user traffic, and resource dependencies across millions of entities.
Because there are differing assumptions involved in evaluating load anomalies than there are in evaluating performance anomalies, DESK relies on a wide spectrum of measures and methodologies to identify anomalous events that affect customer experience and therefore require your attention. While multidimensional baselining is used to automatically detect anomalies in the response times and error rates of applications and services (response times should never rise to critical levels, even during high-load situations), a prediction-based methodology approach is used to detect abnormalities in application traffic and service load. This is because traffic and load are entirely dependent on daily, seasonal, and business-cycle related patterns that are driven by an application's business model, related marketing efforts, and sociological factors. Examples of such cycles include weekends/workweeks, workday/evening hours, and holiday-driven customer activity. Black Friday is a great example of an extraordinary seasonal event that occurs on an annual cycle.
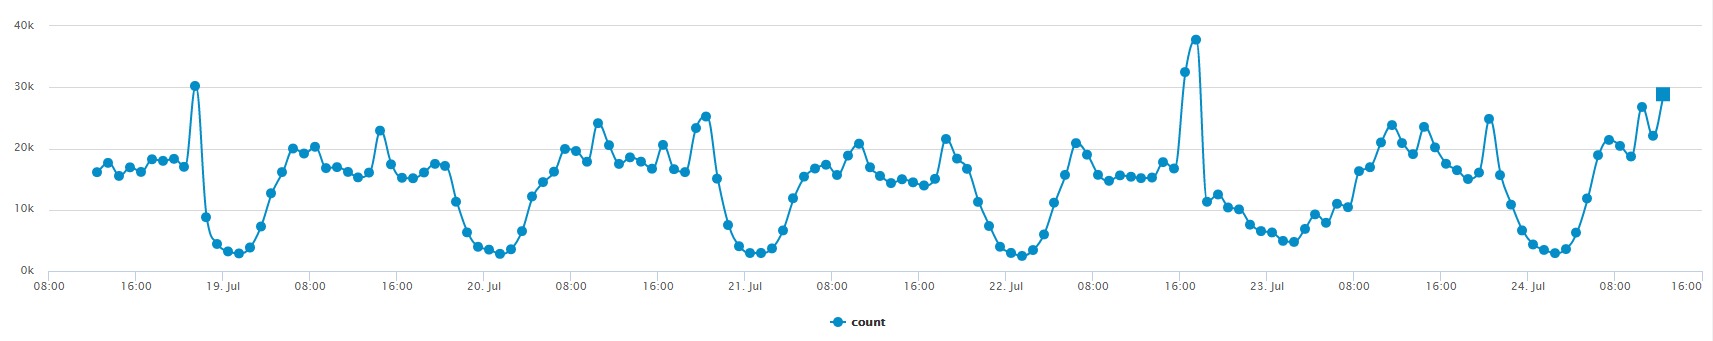
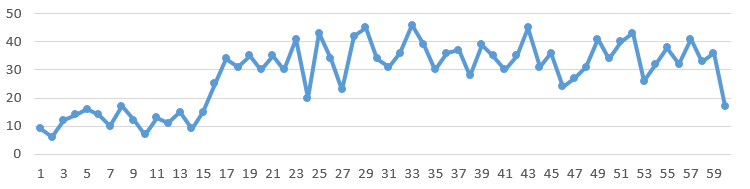
The example below shows typical application traffic patterns for one week. Notice the daily pattern. While traffic peaks between 8:00 AM and 8:00 PM daily, traffic is much lower at night.
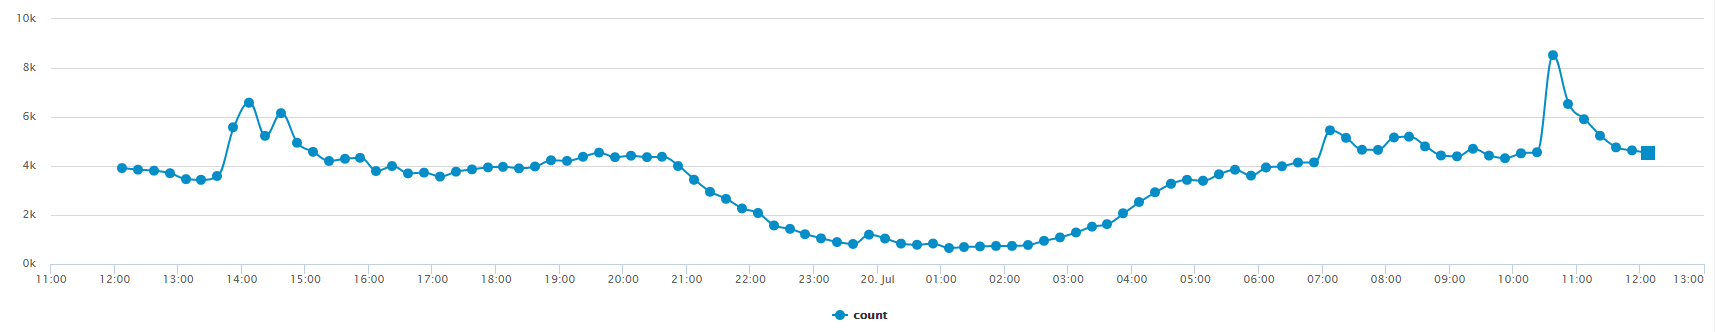
Taking a closer look into the details of the daily traffic levels, we can see that traffic begins to slowly decrease around 9:00 PM and begins increasing again around 3:00 AM.
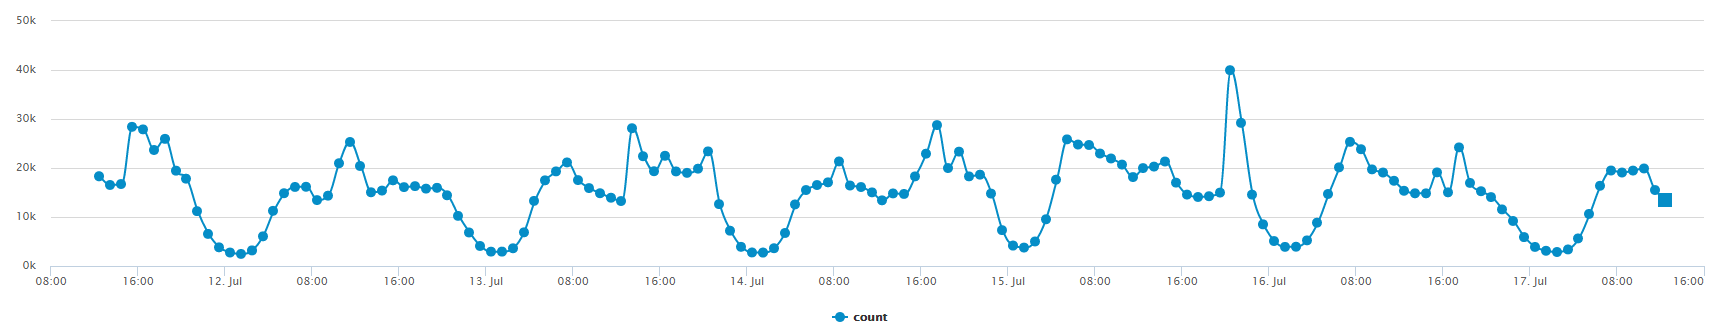
While we can see that this application's traffic time series follows a regular daily pattern, it's worth investigating whether or not there are other identifiable patterns in this application's traffic. By comparing this week's traffic with last week's traffic (see chart below) we can see that there are also weekly traffic patterns here to consider.
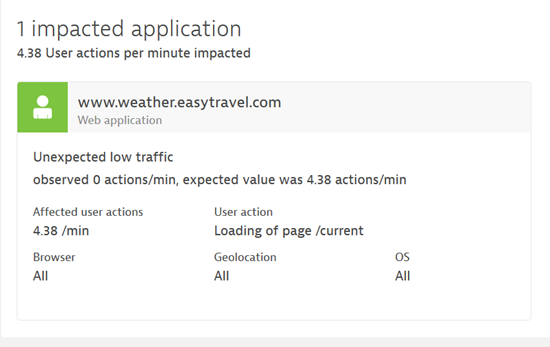
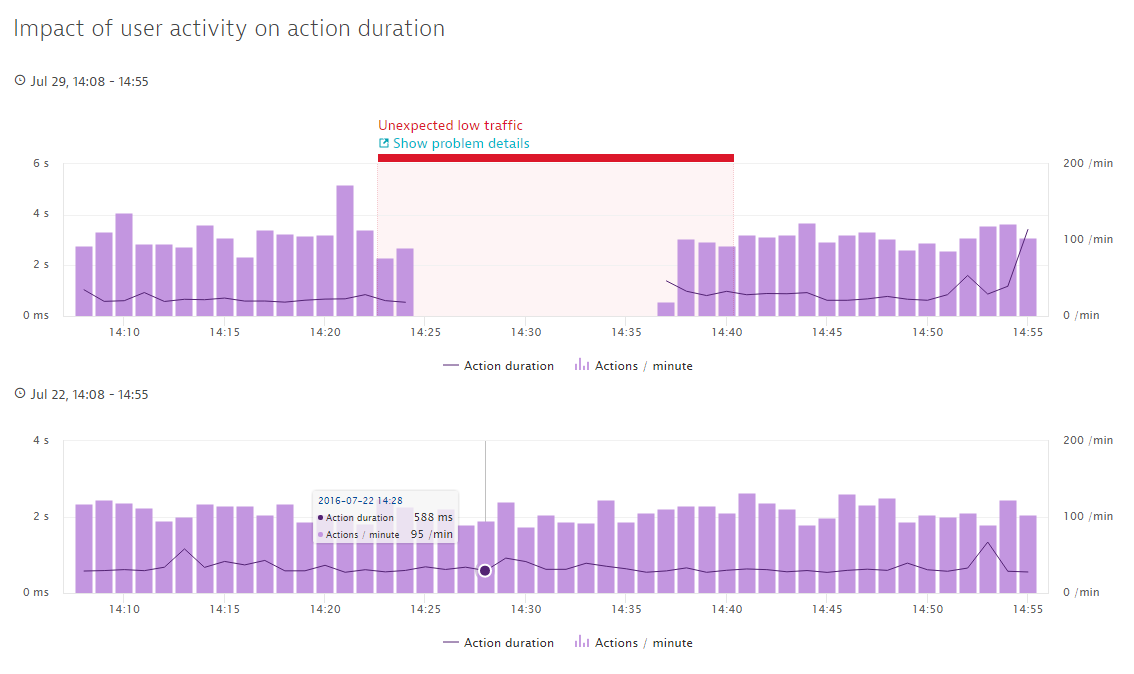
DESK anomaly detection within application traffic is based on the assumption that most businesses follow cyclical patterns that recur with daily and weekly frequency. DESK therefore automatically learns all such application traffic patterns. After a week of learning an application's baseline traffic patterns, DESK sends out alerts when anomalies are detected within these patterns. Following the initial learning phase, DESK can also predict the following week's traffic. Actual application traffic measured the following week is then compared with the predicted traffic levels. If DESK detects a statistically relevant deviation between actual and predicted traffic, it generates either an Unexpected low traffic or an Unexpected high traffic problem for tracking purposes and alerts you (see example below). The context of such anomalous traffic events is automatically detected along with details of other environment events that share the same root cause.
Below is an example of a typical Unexpected low traffic problem alert that was raised because actual incoming traffic differed substantially from predicted incoming traffic levels. This problem was raised because 0 actions/min of traffic were monitored, instead of the predicted 177 actions/min traffic level. Note that this problem provides possible insight into the cause of this problem. It says “Potential application outage, traffic dropped to zero!”.
The chart below shows why the Unexpected low traffic problem alert was raised. The previous week’s traffic was significantly higher at the same point in time than it is during the following week.
Application load prediction and microservices provisioning
Within modern microservices infrastructures, cluster provisioning and scaling can react within minutes to changes in application requirements. DESK full-stack monitoring provides accurate, near real-time application monitoring to quickly identify changes to typical application load. Using DESK monitoring to predict application load in order to trigger cluster-provisioning changes is a logical step towards intelligent cluster management. Instead of provisioning a cluster for peak application load scenarios, DESK enables the option of quickly reacting to changing load levels and scaling within minutes.
DESK further simplifies the implementation of intelligent, prediction-based cluster provisioning algorithms by allowing you to access application-load forecasts via the DESK timeseries API. With DESK application-load prediction, you can implement intelligent cluster provisioning plugins within platforms such as Mesosphere or OpenShift in a matter of hours.
The DESK timeseries API fetches numerous metrics from monitored systems via a practical HTTP REST interface. Not only does the timeseries API enable you to fetch data points that were monitored in the past, it also enables you to fetch predicted future values for each metric.
The traditional DESK API call for fetching the number of User actions/min for the last hour is shown below:
https://<YourEnvironmentID>.live.desk.com/api/v1/timeseries/?relativeTime=hour&Api-Token=<YourAPIKey>&aggregationType=COUNT&entity=<YourApplicationID>×eriesId=com.desk.builtin:app.useractionsperminute
This call returns an array of data points reflecting the number of user actions/min that were monitored within the last hour (shown at 1-minute resolution).
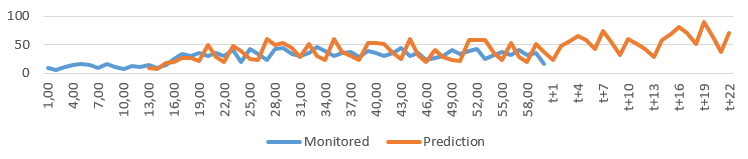
By simply adding the parameter predict=true to this API request, you can instruct DESK to predict what this timeseries
will look like during the next hour. The prediction that DESK calculates is based on the actual learned values that were monitored over the past weeks,
depending on the prediction method used. The default forecast for application load uses daily and weekly seasonal patterns. It predicts upcoming load based on last weeks’ load on the same day at the same time.
Looking for more information about predicting traffic with the DESK Timeseries API? Read the full story in our free O’Reilly report, Anomaly Detection for Monitoring.