View the history of open/closed problems
The default DESK dashboard includes a tile dedicated to problems. By default, the Problems dashboard tile as well as the Problems feed (select Problems from the navigation menu) provide a rolling 72-hour history of open/closed problems in your environment. 72 hours is used as the default timeframe because this gives DevOps teams adequate time to analyze detected problems, even when they occur on weekends. As always, quick response to detected problems is considered best practice. However, there are instances when custom timeframe analysis of detected problems can be valuable.
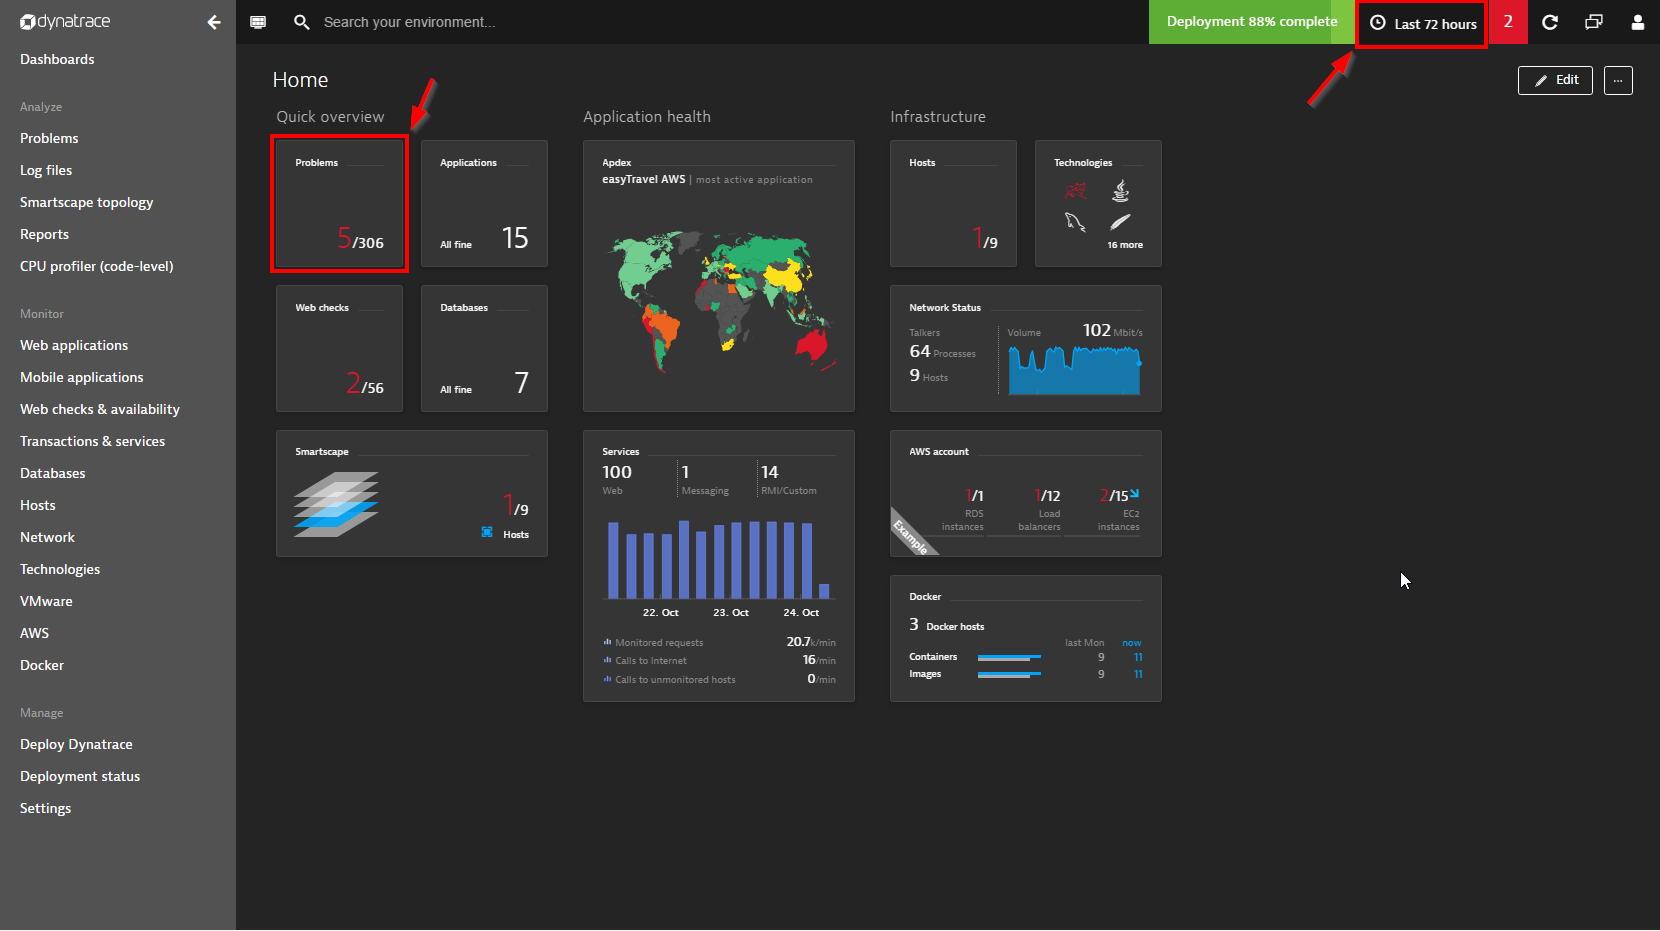
Timeframe selector for problems history
Using the timeframe selector in the DESK menu bar, it's possible to select a custom period of time for problem history analysis, both within your Problems feed and on your Problems dashboard tile. As you can see in the example below, the Problems tile includes the number of open problems against the total number of closed problems detected within the Last 72 hours. In this example, 306 problems were detected and resolved during the selected timeframe while 5 problems remain open. By clicking the timeframe selector in the menu bar, it's easy to select an alternative timeframe for analysis. Also, note the alerts indicator in the menu bar. In this example, the alerts indicator shows that 2 problem alerts were sent out during the selected timeframe. Alert levels vary based on your watch settings for different problem categories (applications, services, or infrastructure).
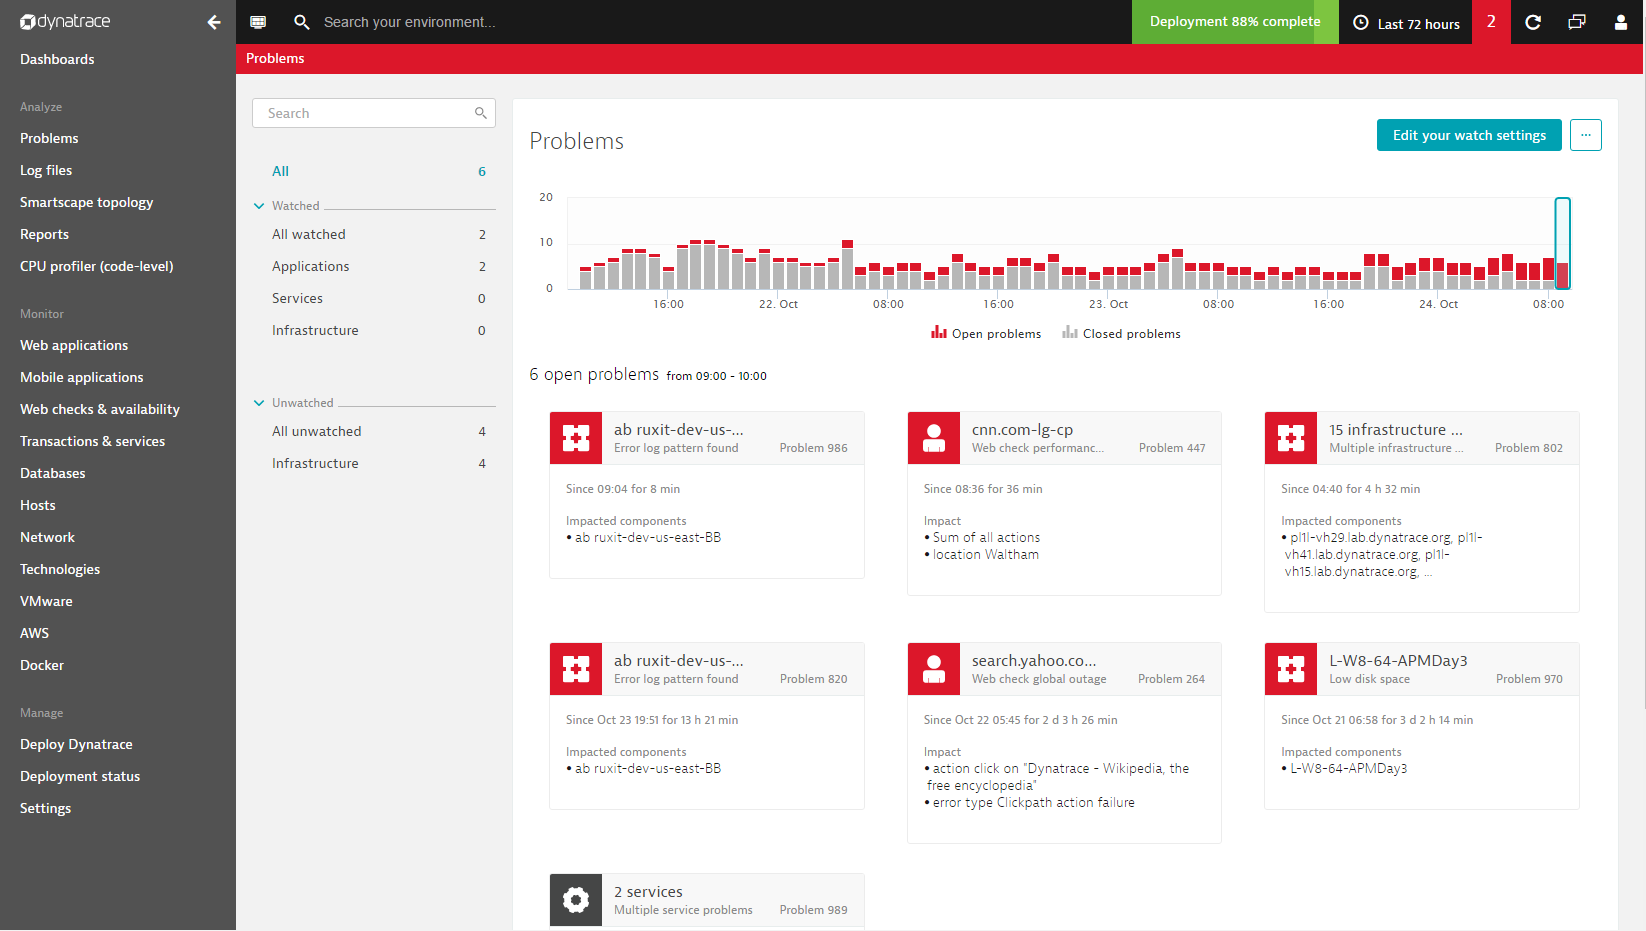
Timeframe selector for Problems feed
Select Problems from the navigation menu to access your Problems feed (or click the Problems tile on your dashboard). The open/closed problems timeline chart reflects your selection in the timeframe selector (see example below). In this example, you can see that there are 6 open problems.
Because it's often not feasible to display all problems that were detected during timeframes longer than 72 hours, the Problems feed displays open/closed problems only for specific time intervals within the selected timeframe. In the example below, the feed shows only those open/closed problems that were detected between 09:00 – 10:00 am. You can select any time interval within the selected timeframe to drill down into the problem metrics for that time period. This approach only applies to timeframes of 72 hours or longer.
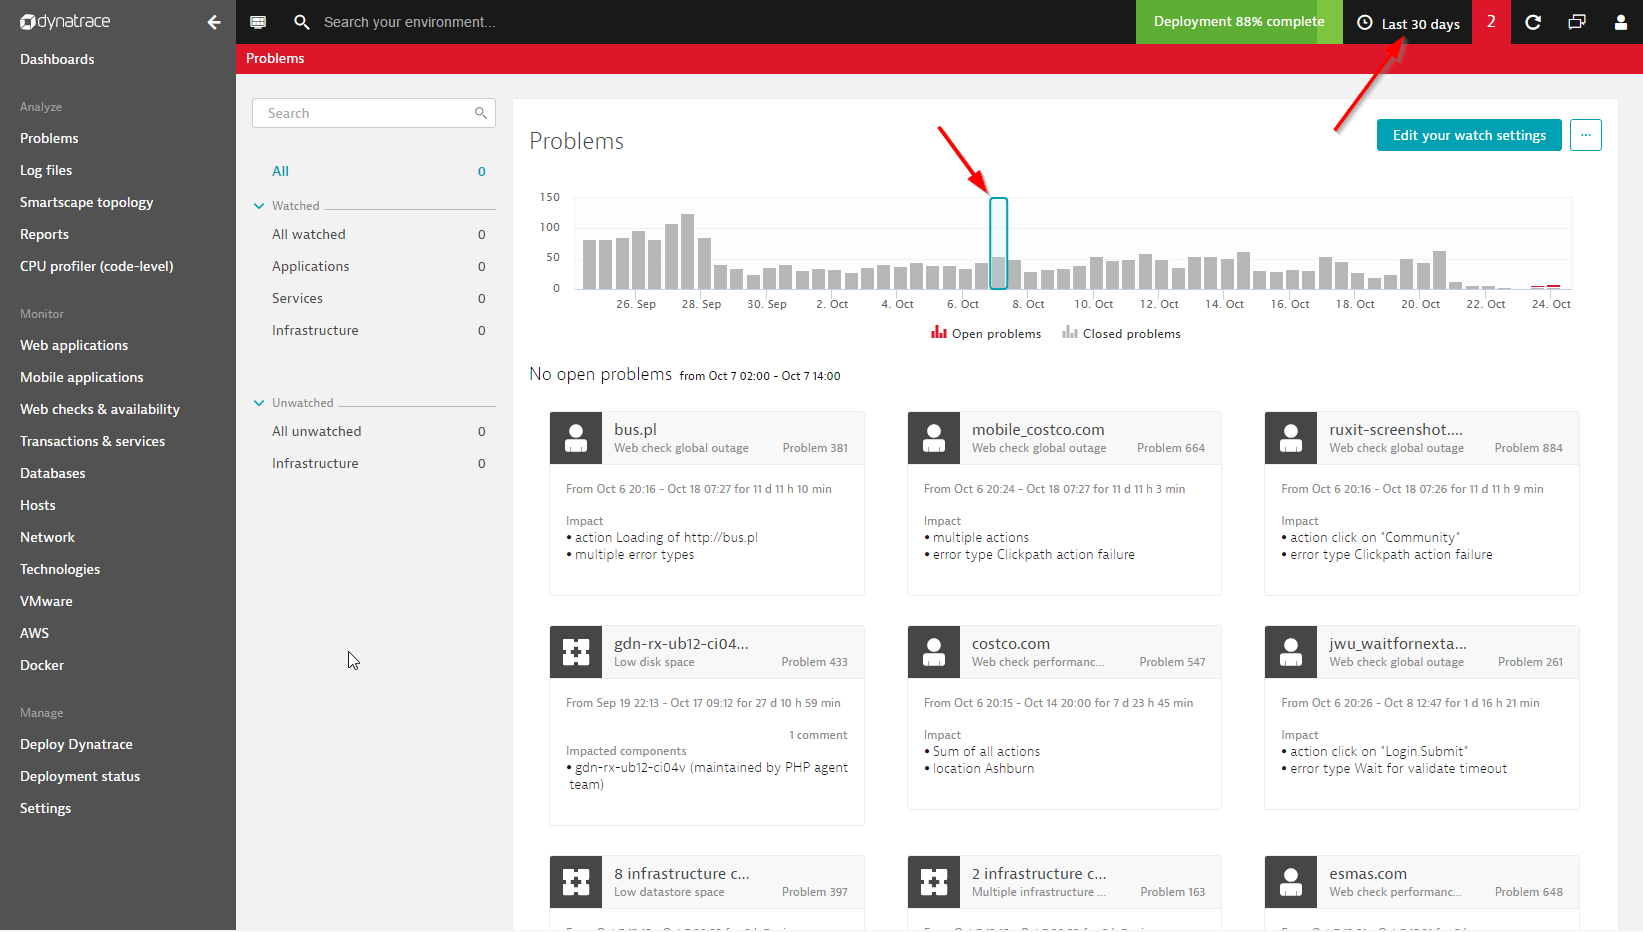
By changing the timeframe selector setting to the Last 30 days, you can view problem-detection statistics for the past month. Here again, you can select individual time intervals for deeper analysis (Oct 7, 02:00 to 14:00 in the example below).
Limitations to transaction storage
Complete transaction storage is limited to 14 days. Therefore, you must perform all detailed problem analysis and triage within 14 days of problem detection. For details on how the available granularity of timeseries data diminishes over time, see Data retention periods for timeseries metrics.