Why don't I see my applications or monitoring data?
To confirm that your application's web front-end process is monitored, go to Settings > Monitoring overview > Processes and search for the process. All monitored processes are listed on this page.
If you don't see any of your applications or Real User Monitoring data in DESK, the first thing you need to do is confirm that there is traffic in your web front-end processes (web server, Java, Node.js, etc). To do this, interact with one of your applications' pages to generate some traffic.
Once you're certain that your web front-end processes have traffic on them, check the following to determine the cause of the problem:
- Confirm that the RUM JavaScript tag has been correctly injected into your application's HTML.
- Confirm that the RUM JavaScript tag has downloaded correctly.
- Confirm that RUM monitoring data is being sent to DESK.
See the expandable sections below for details on confirming these points.
In rare circumstances, the DESK RUM JavaScript tag that's injected into each application page can have an adverse impact on application functionality. For this reason, following installation of OneAgent, confirm that your application's pages still render properly. If some of your application's pages appear to be corrupted, disable monitoring and contact a DESK ONE product specialist by clicking the chat button in the upper-right corner of the DESK menu bar.
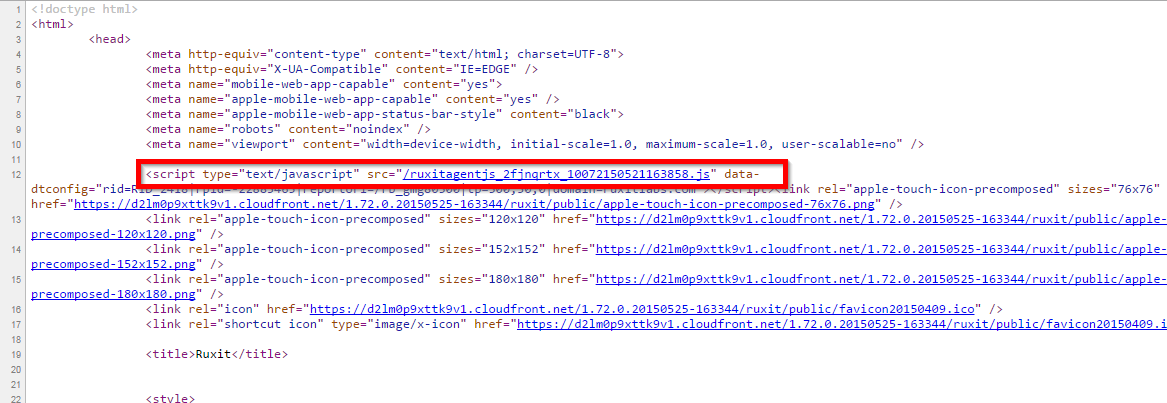
The first thing to do in verifying that Real User Monitoring has been set up correctly is to search for the DESK RUM JavaScript tag in your application's HTML.
Load one of your pages, inspect its source in the web browser and check that the <HEAD> element contains a reference to the DESK JavaScript. If you are not able to locate the DESK JavaScript, make sure that your HTML is a valid formed HTML with both opening and closing tags for <HTML> and <HEAD>. For more details on whether your HTML fulfills the requirements for auto injection, visit Real User Monitoring JavaScript injection.
For standard OneAgent installations (automatic tag injection)
Search for a script that contains the string ruxitagentjs in its file name.
<!-- Example - Auto injection of JavaScript tag -->
<script type="text/javascript" src="/ruxitagentjs_[...]_[...].js" data-dtconfig="[...]"></script>
For agentless monitoring (no OneAgent, no automatic injection)
Search for a script that's loaded from js-cdn.desk.com (or your own CDN or domain in DESK Managed; CDN is recommended) and ends with the string _bs.js.
<!-- Example - Agentless monitoring JavaScript tag -->
<script type="text/javascript" src="https://js-cdn.desk.com/jstag/[...]/[...]/[...]_bs.js"></script>
Note: In the example above, [...] indicates a variable URL element, such as an application ID or a configuration parameter.
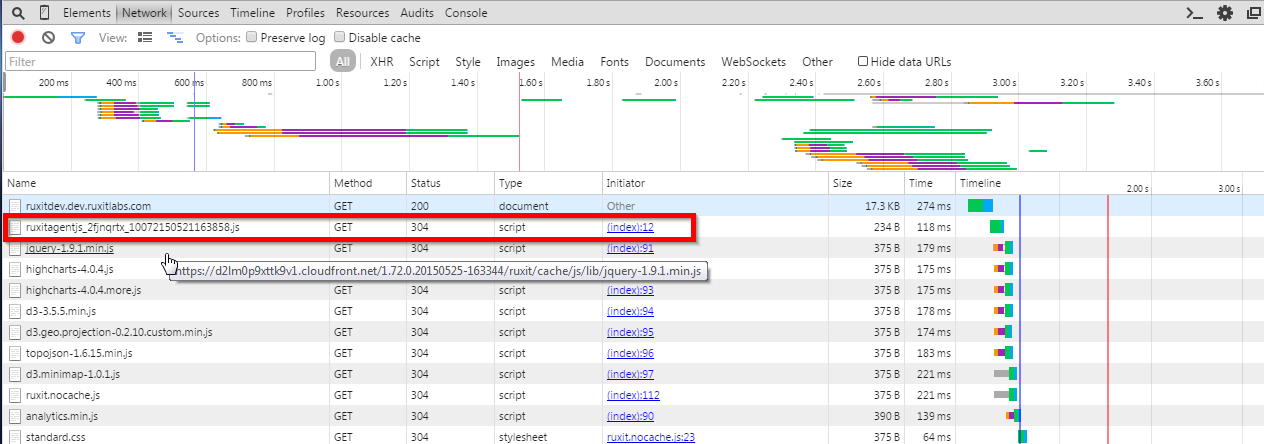
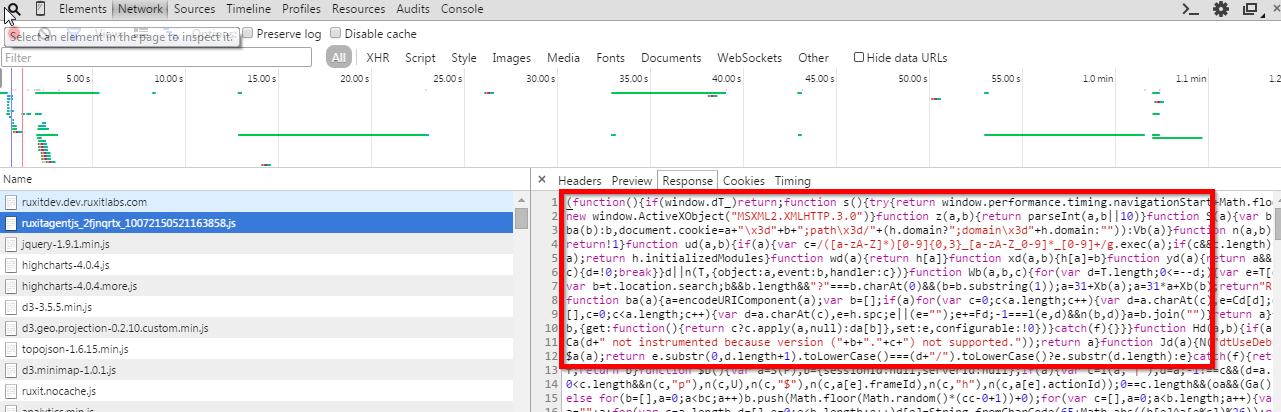
The DESK JavaScript tag for your application is downloaded along with all other web page resources. You can confirm that the download was successful using the development tools available in your browser (for example DevTools in Chrome) or with a tool like Fiddler or Firebug.
To begin, load your application's page in a browser, then open your preferred development tool and go to the Network or Net section. There you'll see the list of network operations and their statuses (you may need to reload the page to clear the view). Look for the following:
- Responses that contain JavaScript code.
- Responses must have status
200 "OK"or304 "not modified". The script file may come from cache. - The existence of the JavaScript object
dT_.
To do this, go to your browser developer console and type dT_ and press [Enter]. As a result, an object should be returned.
See examples below for Google Chrome that show server responses containing the correct script content:
There are a few reasons why a JavaScript tag may not be downloadable:
-
For agentless monitoring
- The tag isn't correct.
- Content Security Policy rules prevent loading of the tag.
- The RUM JavaScript host (
https://js-cdn.desk.com) isn't reachable for client browsers due to firewall rules or proxy server configuration. Connections to and fromhttps://js-cdn.desk.commust be allowed.
-
For automatic injection on web servers
- Rules on firewalls, load balancers, or proxies aren't configured to allow DESK JavaScript download.
-
For automatic injection on Java application servers
- Root application doesn't exist. The JavaScript tag is usually loaded from the web server root path (
.../ruxitagentjs_...) - Your Java application server serves static content in a way that doesn't use the servlet stack. In such cases the JavaScript tag can't be downloaded.
- Root application doesn't exist. The JavaScript tag is usually loaded from the web server root path (
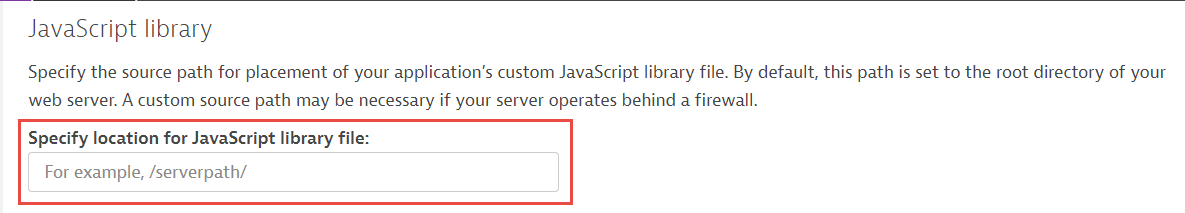
To resolve a JavaScript download issue caused by a missing root application:
- Select Applications from the navigation menu.
- Select the application you want to configure.
- Click the Browse [...] button and select Edit.
- Click the Advanced setup tab and scroll down to the JavaScript library section.
- Specify the source path for placement of your application's JavaScript library file in the Specify location for JavaScript library file field. This path needs to point to a location where the JavaScript tag is accessible (for example, a valid servlet path). See example below:
The JavaScript tag reports back data via XHR or CORS post requests. You can view these requests among network operations using browser development tools.
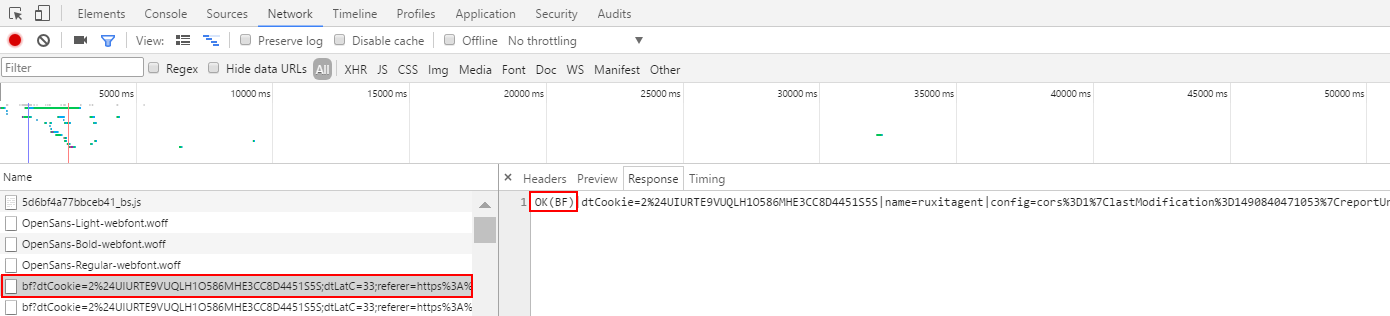
For agentless monitoring
CORS requests to the DESK infrastructure should be visible. Look for the following:
- URL pattern:
http(s)://[...].live.desk.com/bf - Responses must have status
200 "OK"and response content must start with"OK". See example below:
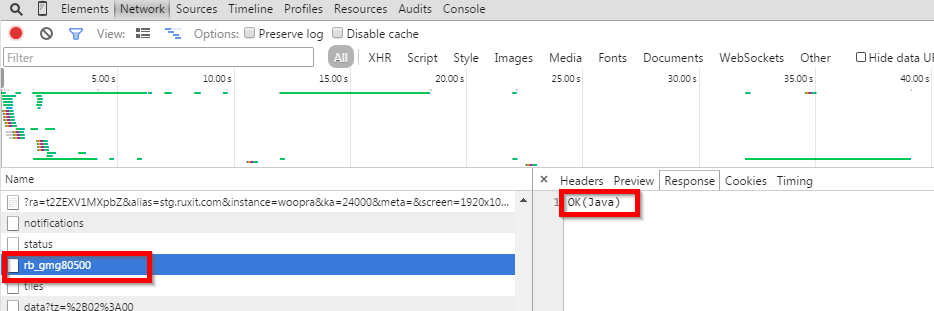
For automatic injection
XHR requests back to the server-side should be visible. Look for the following:
- URL is relative to the current page location and begins with
rb_ - Responses must have status
200 "OK"and response content must start with**OK**. See example below:
Monitor CORS requests
Web requests can only be linked to user actions when cookies are available. In the case of CORS requests, cookies aren't sent by default. Therefore, correlation between user actions and CORS web requests can only be achieved using the withCredentials property of the XMLHttpRequest object.
Restrictions
Due to access-control-restrictions, it's not possible to capture OPTIONS requests like those sent as CORS preflight requests. Capturing those requests requires that a DESK cookie be sent to the receiver of the request, which isn't allowed. This can result in PurePaths that have the correct timing values, but lack timings related to how long it takes from when an OPTIONS request takes place and when the corresponding CORS request fires. See MDN for more information about CORS preflight requests.
Possible reasons for failure
The reasons for this are similar to the reasons why the JavaScript tag may not be downloaded:
- Rules on firewalls, load balancers, or proxies may need to be adapted.
- Content security policy settings may need to be adapted.
- Java application server setup may need to be adapted.
- For agentless monitoring, your browser may not support CORS requests. Data can be reported only via browsers that support CORS.
CORS-related troubleshooting
If user action data is missing from your monitored web application, you can perform the following checks in Google Chrome with Chrome DevTools open, and then use Chrome DevTools to verify that certain data exist that indicate user action data is captured properly. You can open Chrome DevTools quickly in Chrome by pressing F12.
-
Make sure the user action triggers network traffic. Perform the action you would like to see and inspect the action's network traffic in Chrome DevTools. To do this, click the Network tab and look in the Type column. If there are no
xhrorfetchtype requests, this is not an action and you won’t be able to see it. Images and CSS information don't count asxhrorfetch, and appear in DevTools as shown below. If you see noXHRorfetchrequests, use the JavaScript API to manually monitor this action. -
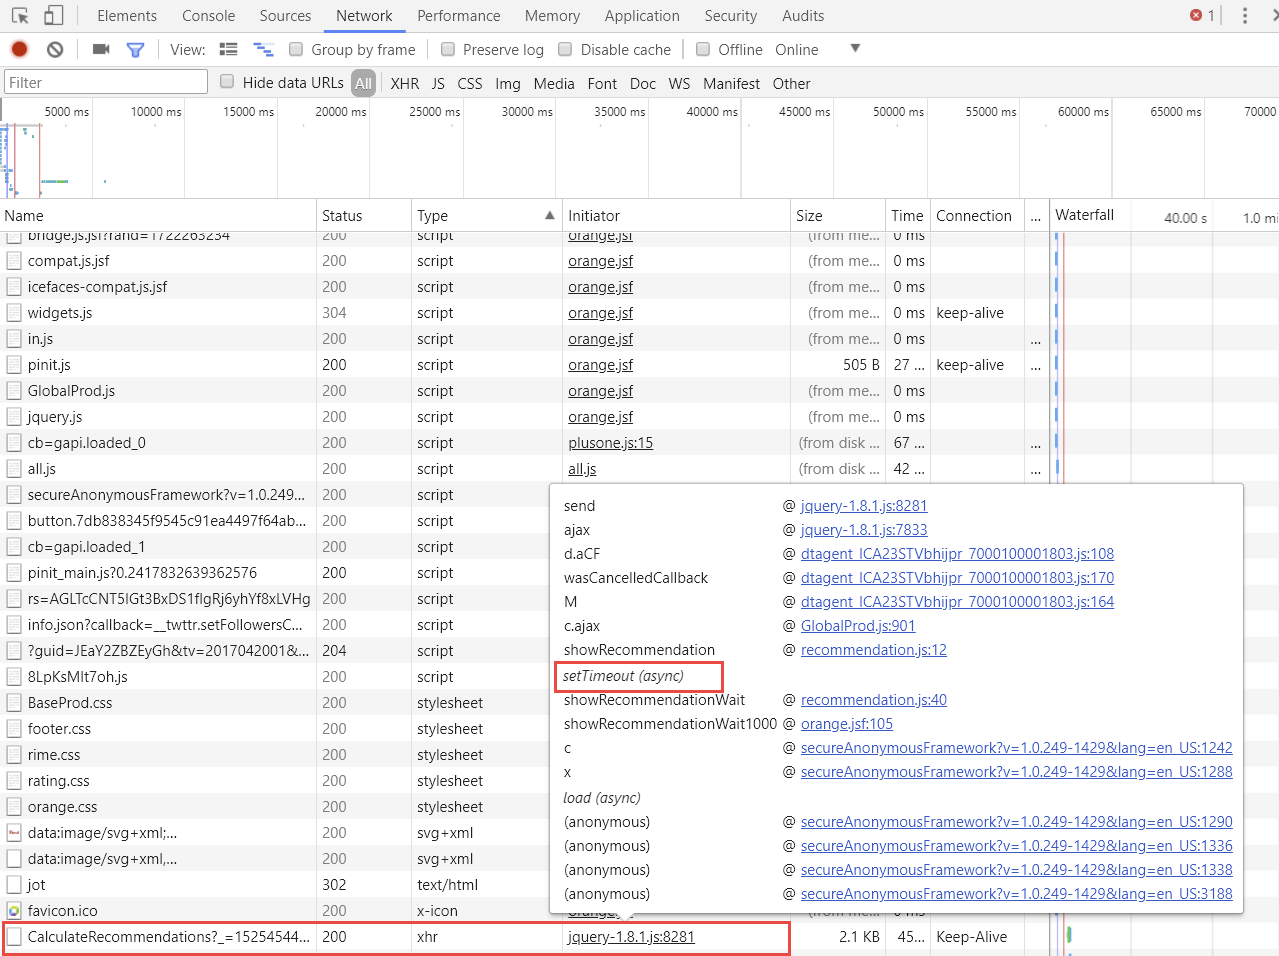
Make sure the action uses
setTimeout(async). Perform the action you would like to see, using Chrome DevTools to make sure there is anXHRrequest. If anXHRrequest exists, hover over the Initiator column in that row and confirm that there is a line that readssetTimeout(async). -
Make sure the correct modules are activated. Perform the action and use Chrome DevTools to check if the type is
fetchorxhrand enable the correct module (fetch or a more specialized module for fetch, BasicXHR, or a more specialized module for XHR actions).
The following images shows a typical xhr request in Chrome DevTools, with a specialized initiator module and setTimeout(async) in the initiator data.
If there appears to be a missing link between a user action in your application and the web request from the server, check the following:
- Verify web requests are captured: Make sure that the server handling the web requests is instrumented with OneAgent.
- Verify that there isn't a domain issue with cookies: Check the domain where requests are sent and the domain used for setting the cookie—ensure that they're the same.
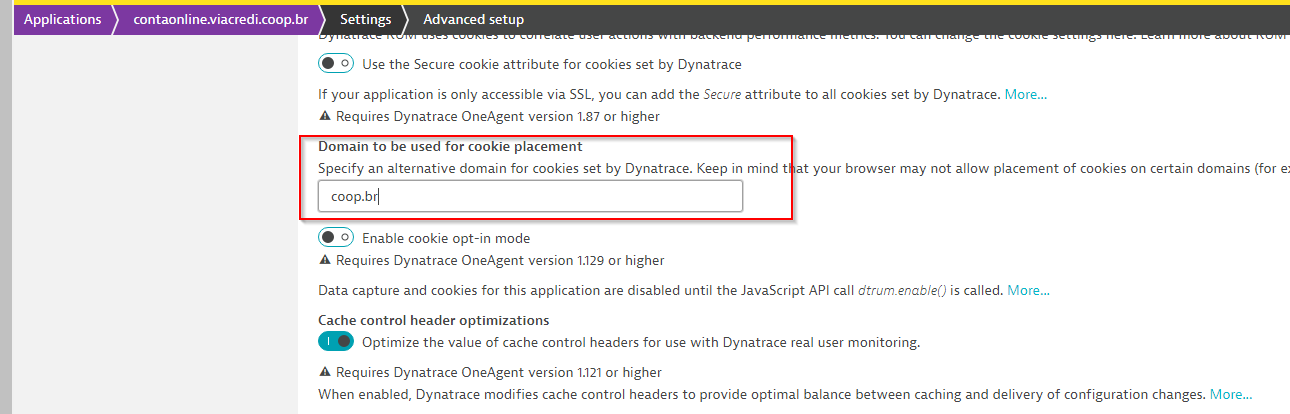
To set a common cookie domain
- Select Applications and select the desired application from the list.
- Click Edit on the menu bar.
- In Application settings, click Advanced setup, then click the Cookie and header settings link at the top of the page.
- In the Domain to be used for cookie placement field under Cookie and header settings, enter the common domain.
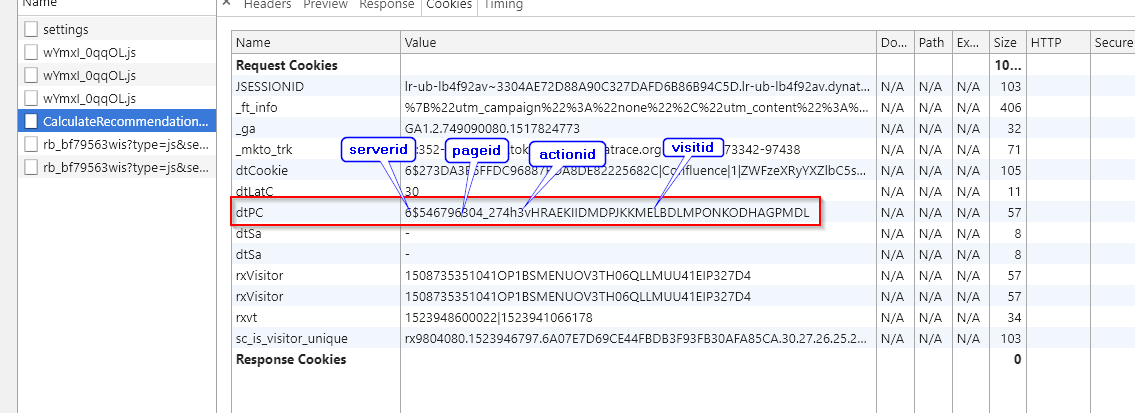
When an action is active with a user input and XHR, the JavaScript tag sets the dtPC request cookie value. This value contains pageId and actionId, and may also contain serverid and visitid values in the value string. To see the value, use Chrome DevTools. To see the dtPC request cookie value, perform the desired action in your application, click the Network tab and find the request name in the Name column. Select the request name and click the Cookies tab and check the value for the dtPC request cookie, as shown in the following image. The format for the DESK dtPC request cookie values is <serverId>$<pageId>h<actionId>v<visitId>.
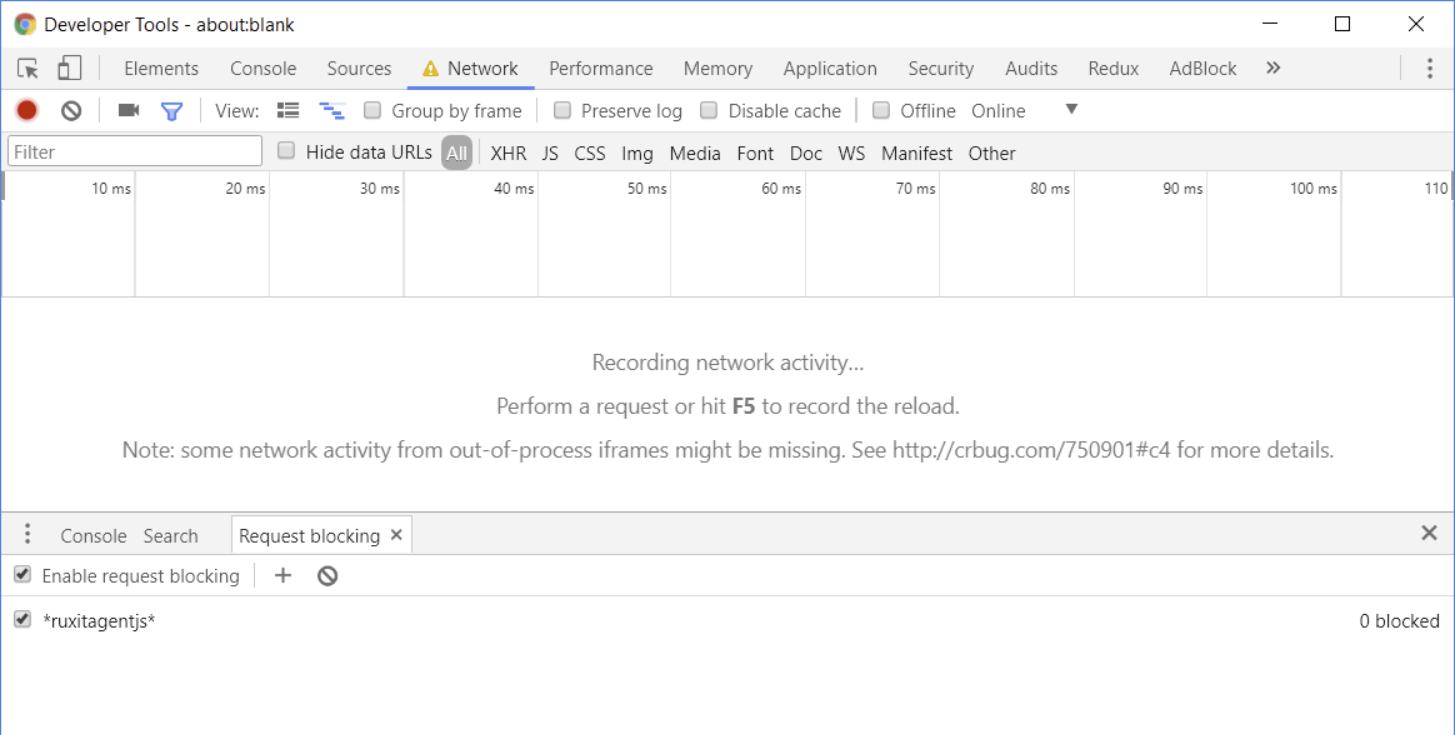
If your application isn't working under this scenario, check to see if the application works with the JavaScript tag disabled. To do this, block the request using either Fiddler or Chrome DevTools. In Chrome DevTools, click the Network tab. Then click the Browse [...] button in the upper left corner of the pane, select Request blocking, and then select the Enable request blocking option box, as shown in the following image.
If the application doesn't work with the JavaScript tag disabled, the problem is likely in the application. However, if the application still doesn't work after disabling the JavaScript tag, disable all modules, then enable modules one at a time until the application does not work. Use this information when contacting DESK Support, as it helps to narrow down the problem to a certain module.
Check the following if you have missing metadata:
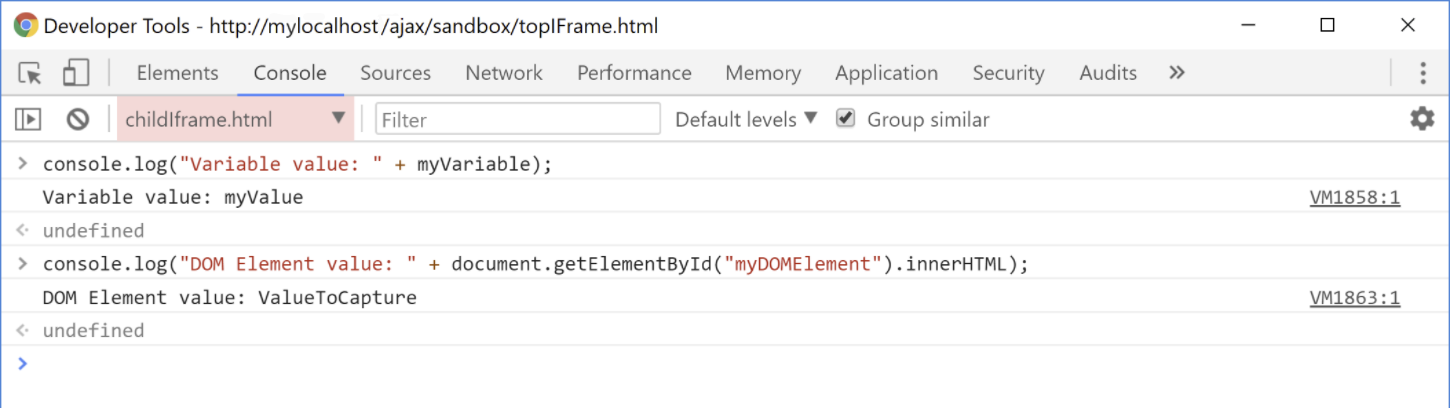
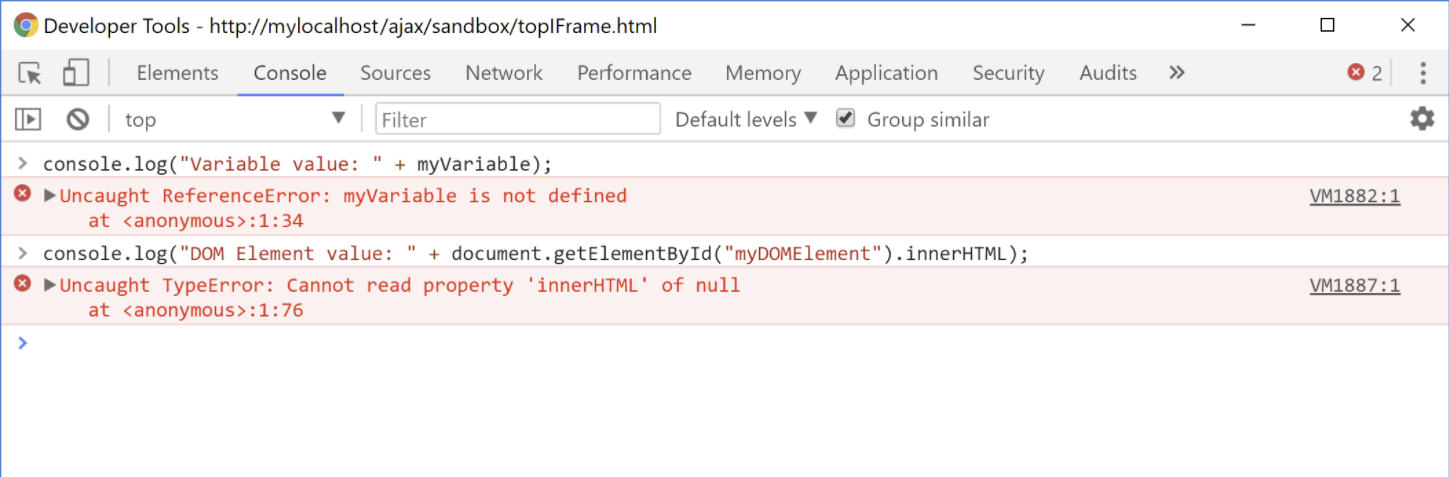
Verify the JavaScript variable or DOM element is captured in a Frame or IFrame: IFrames and Frames have their own JavaScript context, therefore it's not possible to access variables that are only available in another frame. DOM elements also must be available in a Frame/IFrame in which a JavaScript tag is injected, because IFrames can have access restrictions. You can use Chrome DevTools to verify JavaScript variable or DOM element capture. To do this, perform the desired action in the application. Then in Chrome DevTools, click the Console tab and check the log for DOM Element value and Variable value entries. Ensure those entries have valid values.
The following shows a DOM Element access in the IFrame that contains the DOM Element:
This image shows a DOM Element access in the iFrame that doesn't contain the DOM Element:
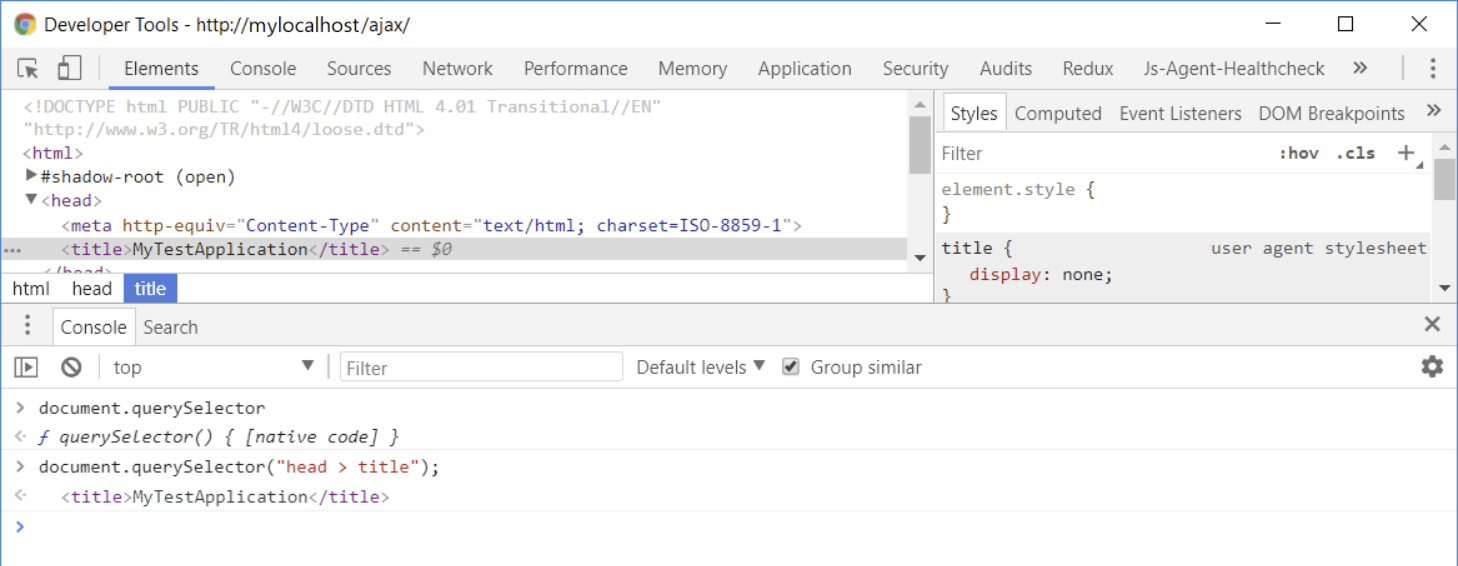
Check if the DOM selector is wrong or the querySelector isn't available: Do the following to verify that the DOM selector is correct:
-
Make sure
document.querySelectoris available by typing it into the Chrome DevTools console. If it's not available, you won't be able to capture values in this browser. This however is unlikely, as this is supported by older browser versions. -
Make sure
document.querySelector('yourselector')returns the value you want to capture. If not, then yourqueryselectoris incorrect and the JavaScript tag is not reporting data. See the W3C Selectors API page for more information aboutqueryselector.
To check the return value for document.querySelector, perform the desired action in the application. Then in Chrome DevTools, click the Elements tab, do a string search for document.querySelector, and verify the return value.
The following image shows data correctly returned from document.querySelector.
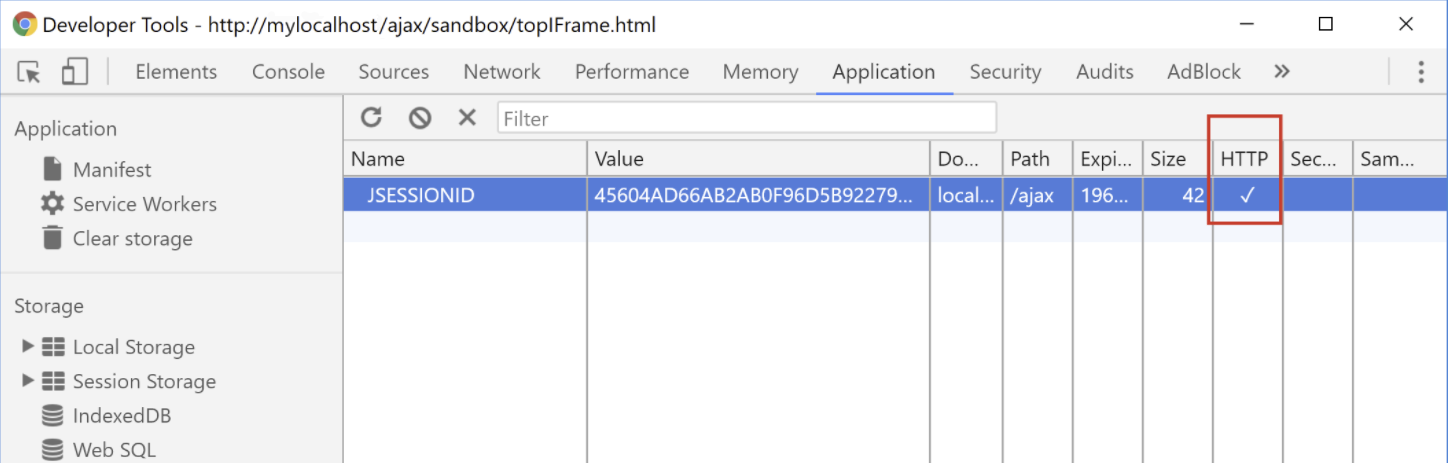
Check to see if the cookies are using HTTPOnly: If the cookies have the HttpOnly flag set, the JavaScript tag can't access its values and the value isn't reported, as shown in the following image. You can check if the HttpOnly flag is set for cookies in the Application tab of Chrome DevTools.
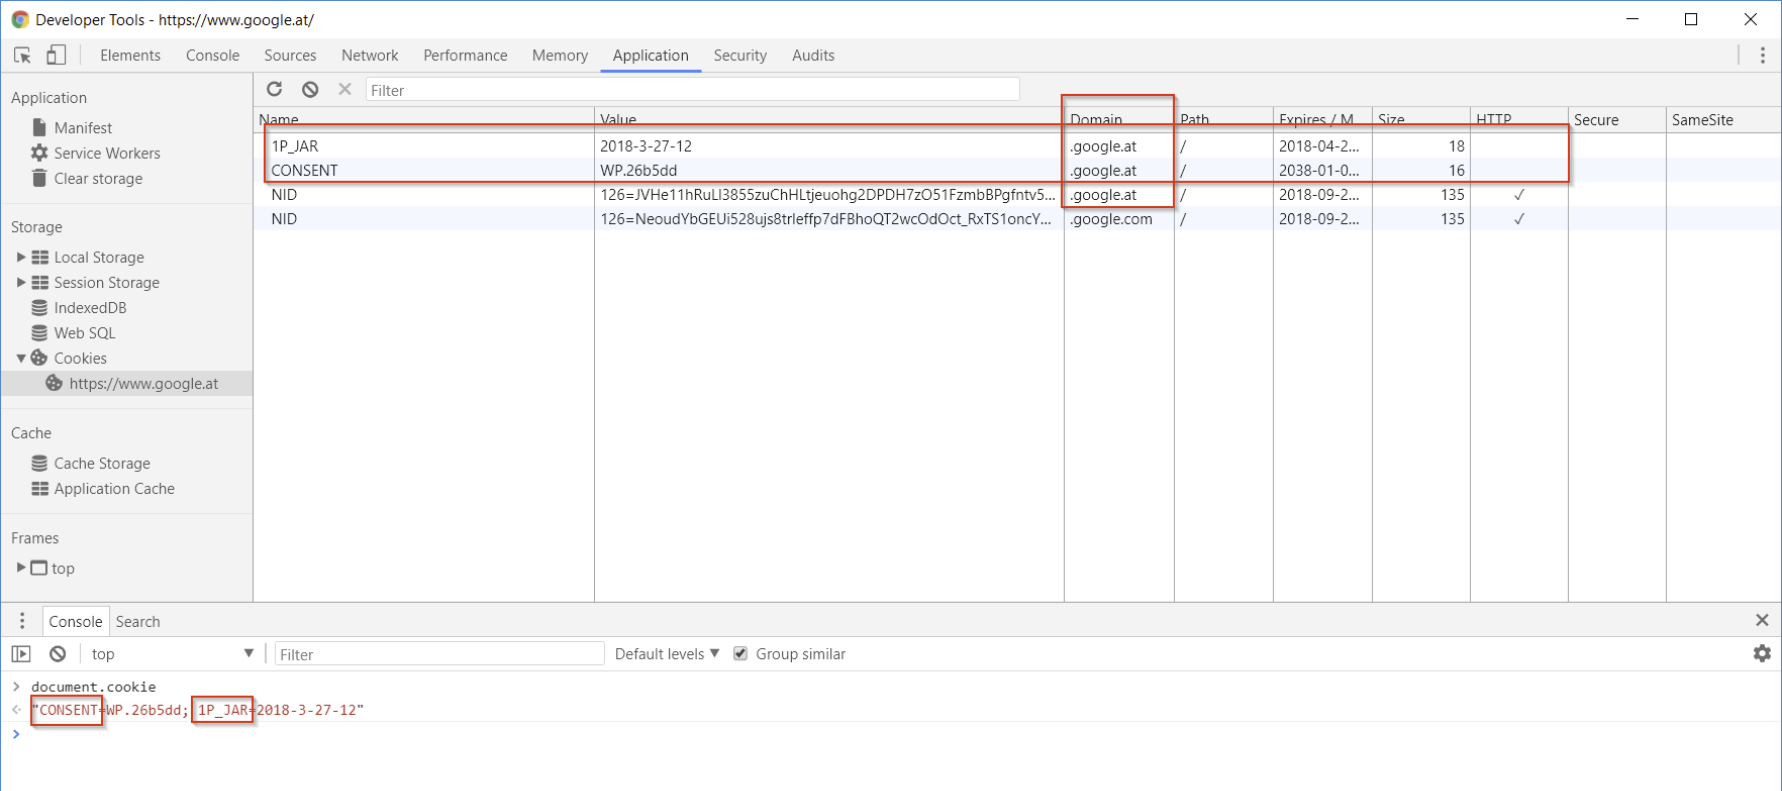
Ensure that cookies are set on the correct domain: Sometimes cookies aren't set on the correct domain, despite the fact that they appear in Chrome DevTools. This means that you can see the cookie value in Chrome DevTools, but the cookie isn't accessible from the JavaScript tag. To try this, you can search the string document.cookie in the Chrome DevTools console and check if the return string contains the cookie you want to capture.
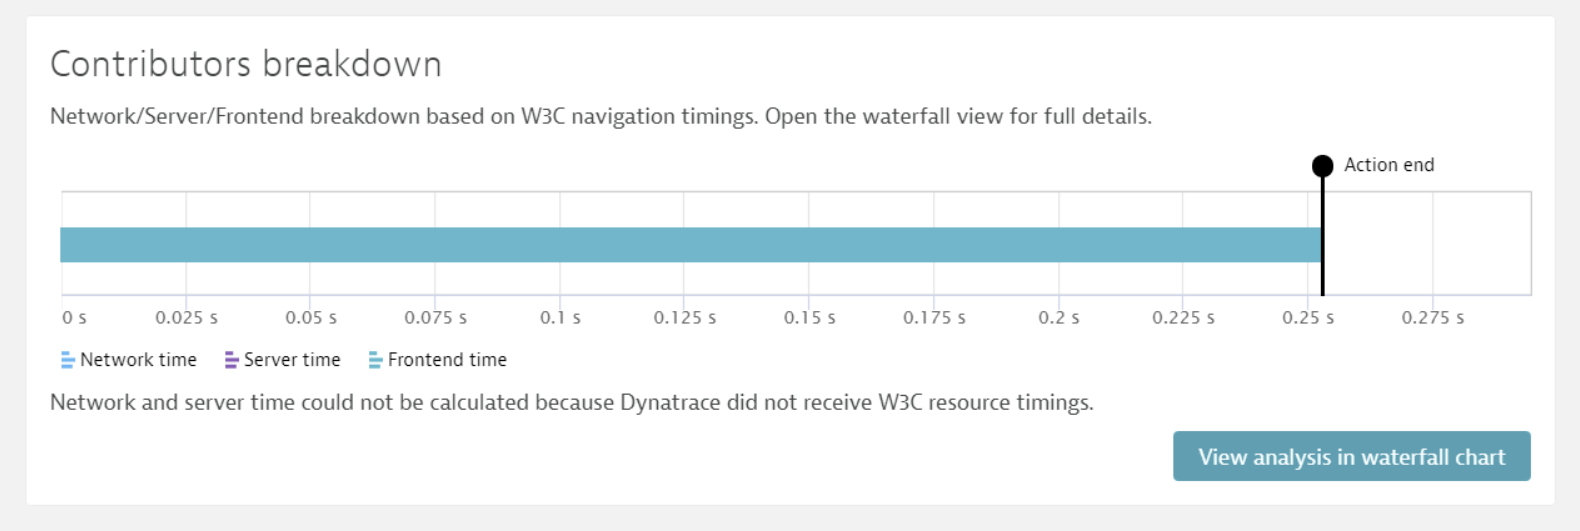
If your page is requesting resources from other domains, the Timing-Allow-Origin HTTP response header needs to be set, otherwise the browser can't supply the values and they can't be displayed in the Contributors breakdown chart. If this happens, a message appears in the chart area stating that network and server time can't be calculated because DESK didn't receive W3C resource timings, as shown below.