Work with key performance metrics
DESK offers an expanded selection of key performance metrics on which you can base your Real User Monitoring.
Choose the right performance metric for each application condition
For many traditional web applications, "User action duration" is considered the best metric available for web-performance optimization, as it focuses on the amount of time from user input to complete page load. But Single Page Applications (SPAs) based on Angular, Ember, React, and other JavaScript frameworks don't depend on loading a new page following each click. So the race to be fast "above the fold" can lead to high overall user action duration times. As a result, other metrics such as "Visually complete" and "Speed index" can more accurately focus on the actual timings that reflect when the end user can take the next action. From the end user perspective, web applications can be usable after certain elements such as a date picker or autocomplete for a search are ready to use.
Then there are some applications where the UI is not as important as the interaction with the application. For example, a Call Center application or Help Desk application where the users are experts and work with short cuts and the time to interact with the application is more important than ensuring that all images are loaded. In these cases, "JavaScript loading" is important and "DOM interactive" may be the best metric to consider.
Choosing the right key performance metric also lets you adjust to varying performance levels for different features of one web application. For example, a customer may be satisfied waiting five seconds after clicking a button to confirm a booking, but be frustrated waiting five seconds for the autocomplete box of a search field to appear.
With key performance metrics and key user actions, you can now pick the ideal performance metric and expected performance goals that best fit each separate user action. DESK key performance metrics enable you to respond to such variable conditions for each application you monitor.
Use key performance metrics to monitor application performance
Key performance metrics are activated by default, and "Visually complete" is selected as the key metric for load and XHR actions. "User action duration" is selected as the default metric for custom actions.
Once you enable key performance metrics for an application, you can select the right key performance metric for its load actions, XHR actions, and any custom actions.
To select key performance metrics for an application
- Click Applications from the navigation menu.
- Select the application you want to configure.
- Click the Browse [...] button and select Edit.
- Click General, and from the Load actions, XHR actions, and Custom actions tabs in the Select a key performance metric for this application section, select the key performance metric that best represents the user experience for each user action type.
For situations where you want to tailor the key performance metric used for different features in one web application, you can select a different key performance metric for the application's different key user actions.
- Click Applications from the navigation menu, then select the application you want to configure.
- On the application's details page, select a key user action in the Top User Actions tile, or click View full details in the Top User Actions tile and then select the desired user action from the Key user actions list.
- On the detail page for the selected key user action, click the Browse [...] button and select Edit.
- On the User Action settings page that appears, make sure Key performance metric is selected, then choose a key performance metric from the list box as shown in the following image
See key performance metrics information for your applications
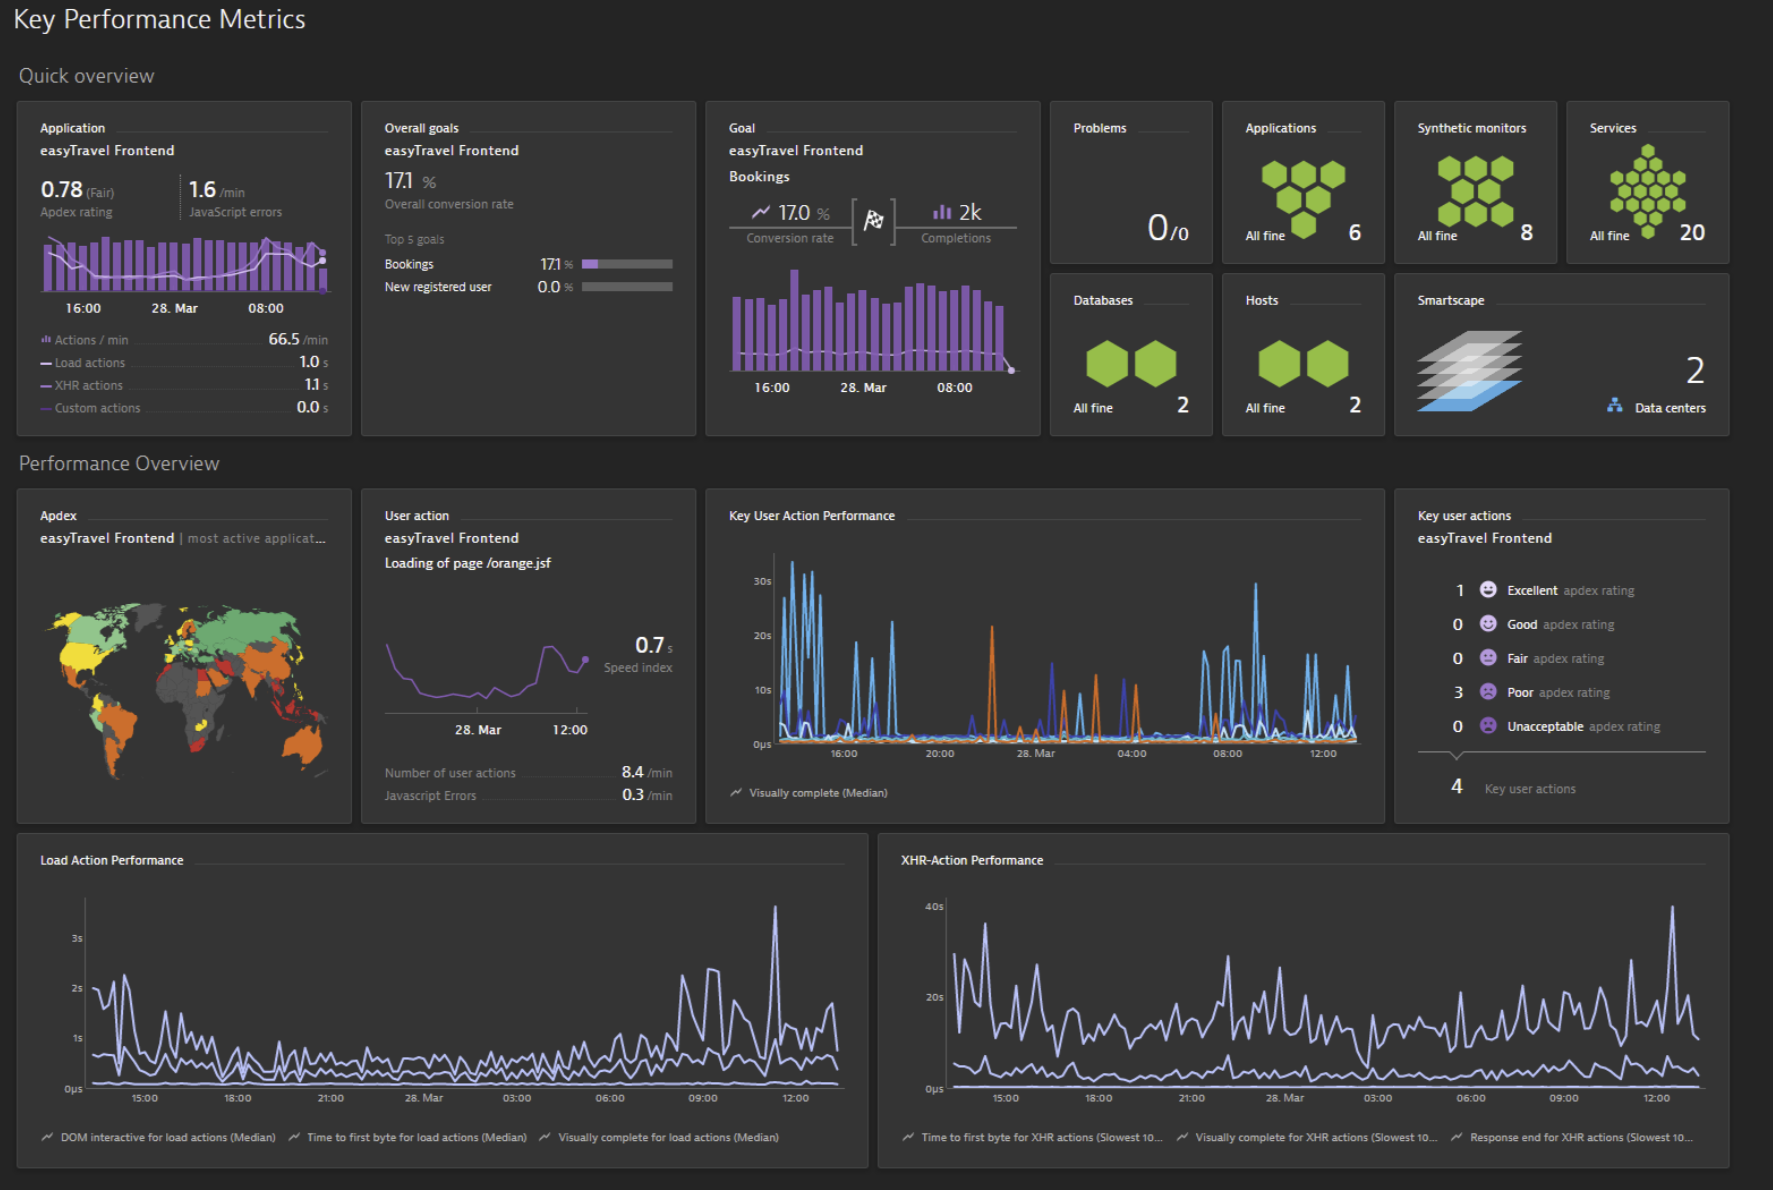
Several dashboard tiles such as the Worldmap, User Action, and Key user actions are affected based on the selected key performance metric. The metrics are also available for custom charting.
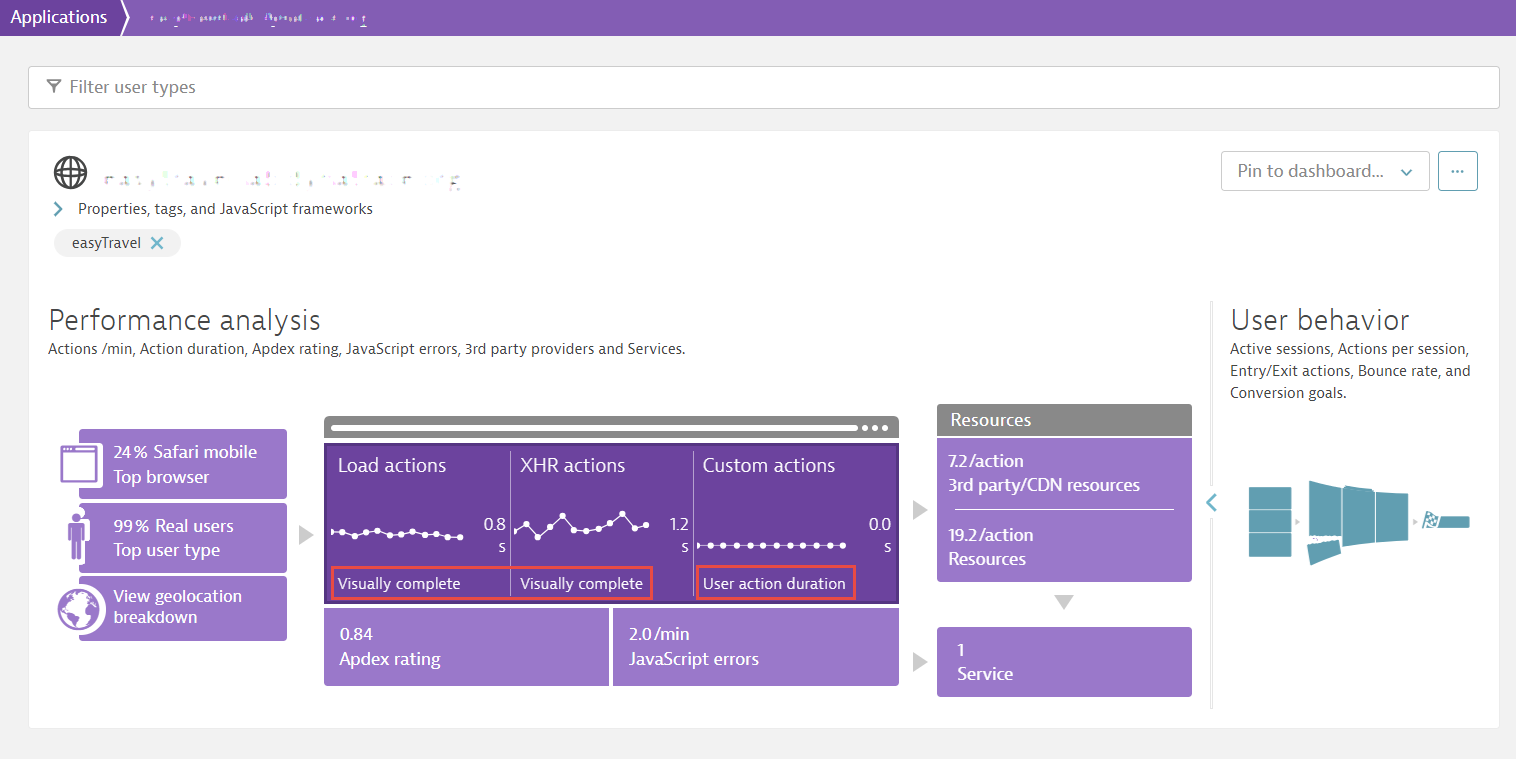
The Application overview page shows "Visually complete" by default for load actions and XHR actions. "User action duration" is used for custom actions.
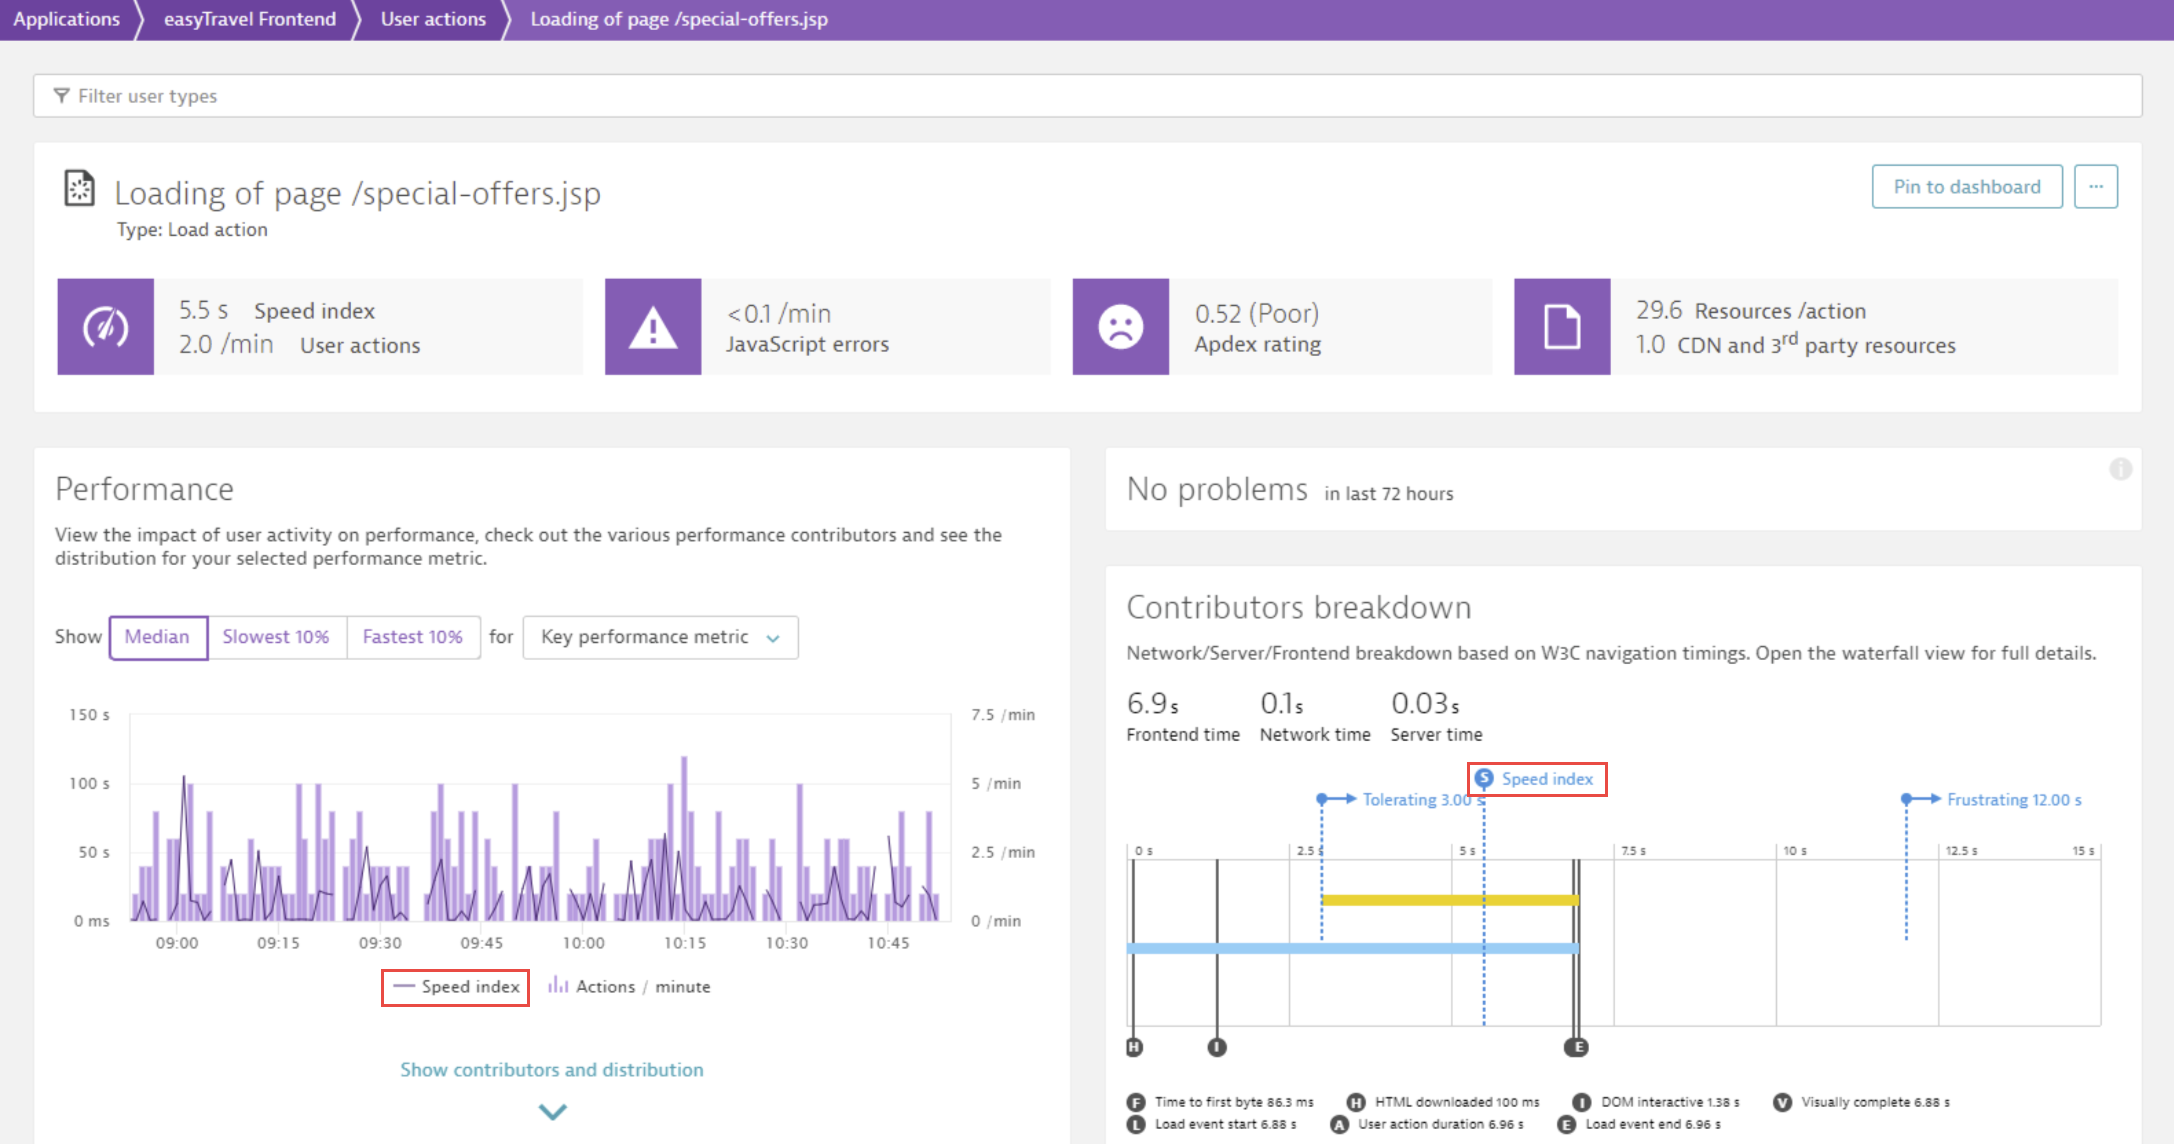
The User action page, when "Speed index" is selected as the key performance metric, reflects Speed index in all tiles and charts.