Analyze process responsiveness
Responsiveness measurements allow you to quickly assess process health by tracking how long it takes for a process to respond to requests from other processes or clients (regardless of resource consumption). DESK measures this on the TCP level, so this metric is available for any process that accepts TCP requests (for example, listening on an open port) and responds to TCP requests. Typical examples are web server processes, proxy server processes, and SQL server processes. Code-level visibility isn't required to measure process responsiveness—DESK only requires insight into inter-process communication to gather the information it needs. Plus, this metric is always measurable—no process restarts or special instrumentation required.
Use case: Using responsiveness to assess process performance
Following is a use-case example that shows that it's not enough to only monitor the resource consumption of a process because a process that consumes excessive resources won't suffer from performance degradation—it's the other processes in the system that will suffer.
Let's say, it's 8:15 AM and you receive a DESK problem alert telling you that host Prod has used 99% of available CPU.
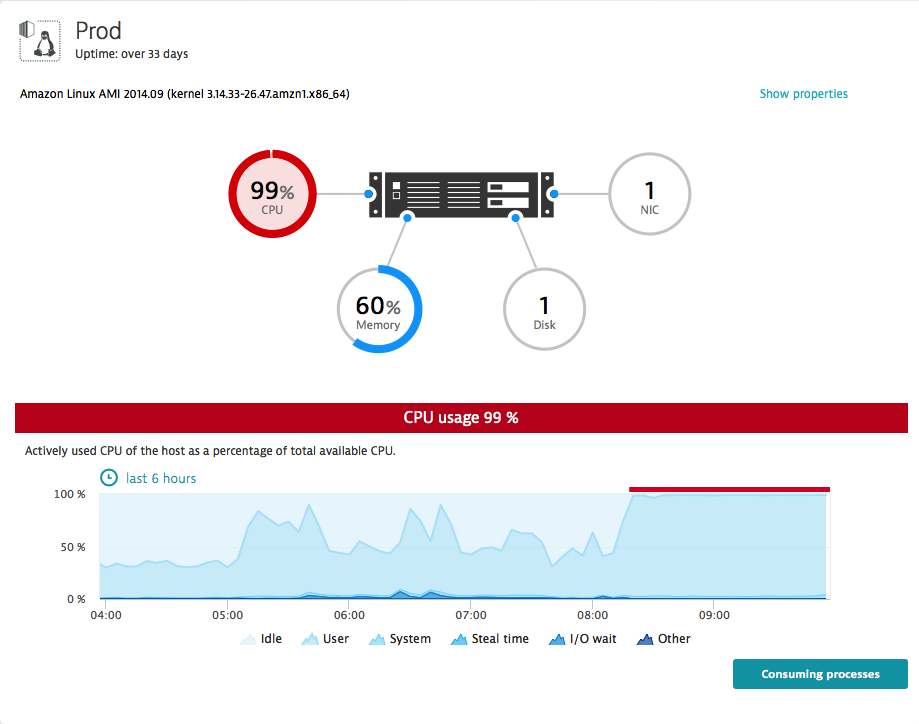
This may indicate a serious problem, but maybe not—you need to investigate to see what's going on. Click the Consuming processes button.
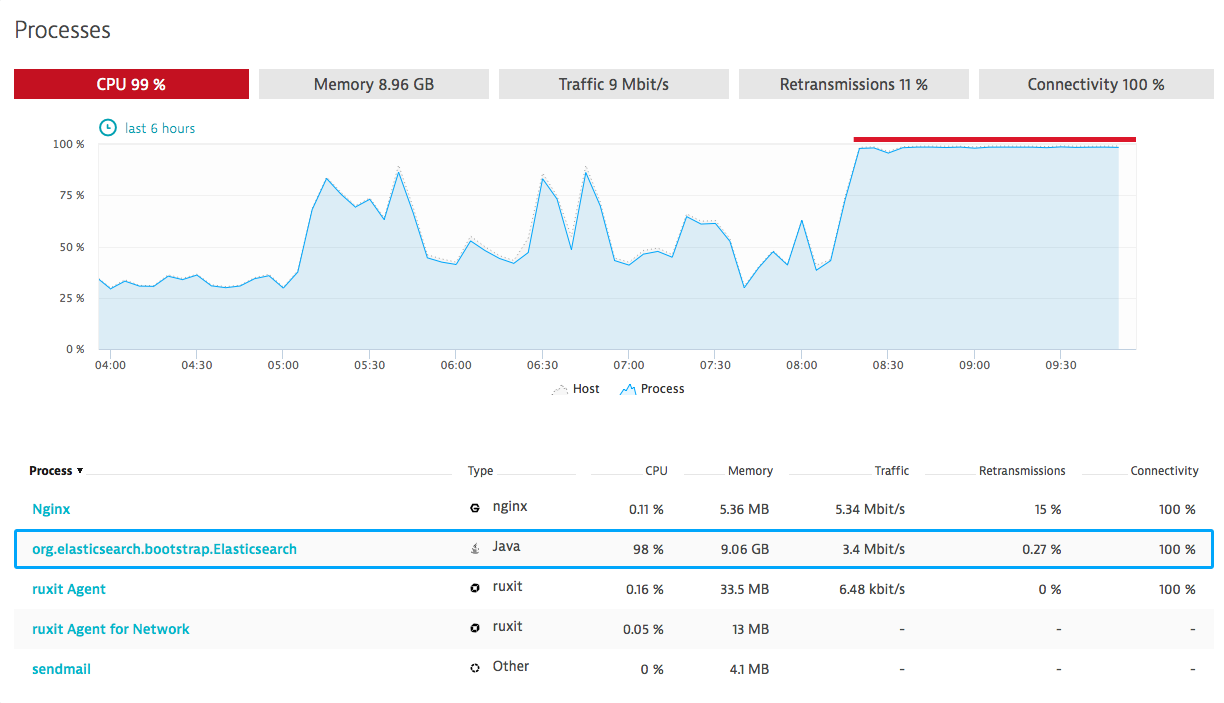
You notice that the Elasticsearch process is consuming nearly all available CPU. The running process on the host that is most critical to the success of your business, Nginx, isn't consuming too much CPU and RAM.
At first glance, this may be reassuring but you still can't be sure that NGINX is performing at its baseline level of performance. Click the NGINX process link to analyze its performance over time.
The Responsiveness confirms bad news—your NGINX process is in fact responding to TCP requests much slower than it was earlier in the day.
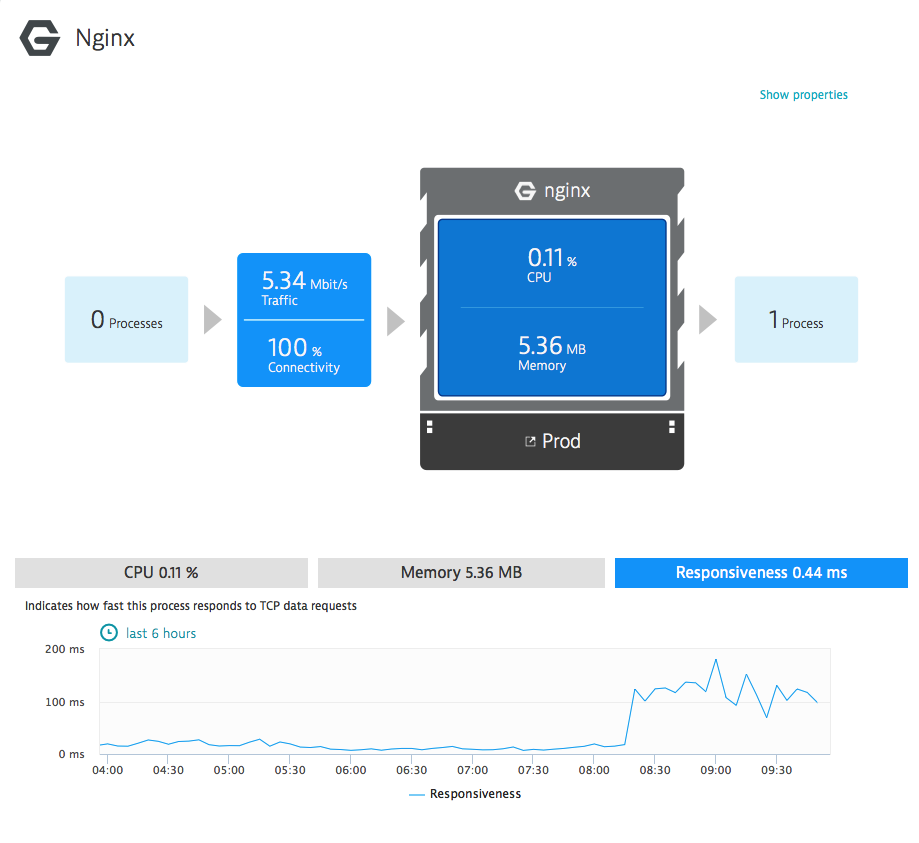 The root cause of the NGINX process slowdown is clearly a resource consumption issue with the Elasticsearch process.
NGINX is just one example of a technology for which you can analyze responsiveness. This use case is also applicable to:
- Other HTTP servers like Lighttpd and LiteSpeed
- Database servers like MySQL, CouchDB/Couchbase, and MongoDB
- Proxy or web acceleration servers like Squid, Varnish, HAproxy, and SS5
- Cache or key value stores like Memcached, Redis, and Riak
- Other server types like SMTPD, Dovecot, and LDAP
Since the responsiveness metric in DESK is based on TCP communication, it's virtually technology-agnostic. You can use this metric to gain platform-independent visibility into just about any application and technology.