How to adjust the sensitivity of problem detection
If your organization has scheduled periods of system downtime during which you want to pause DESK monitoring, see How to define a maintenance window.
Typical application and service-level anomalies reported by DESK include failure rate increases, response time degradations, and spikes or drops in application traffic. On top of this automated learning of reference values, DESK allows you to define specific thresholds that specify at what levels deviations above baseline performance are severe enough to generate problem alerts. Keep in mind that these threshold settings only adjust the levels at which DESK alerts you to detected anomalies. These settings don’t affect automated performance baselining.
There are some use cases for which parameterization of automated baselining algorithms may be beneficial:
- Setting higher thresholds for applications and services that are still in development or are in the testing stage.
- Setting lower thresholds for mission-critical services within your infrastructure (where default thresholds may be too tolerant).
Defining specific thresholds that specify at what levels deviations above baseline performance are severe enough to generate problem alerts is essentially about adjusting the sensitivity of problem detection.
The sensitivity of problem detection controls the level of statistical confidence required to raise an alert. Low sensitivity means that high confidence is required to raise an alert, while high sensitivity implies low statistical confidence for raising alerts. This means for example that to view alerts immediately, even when only few data points have breached the threshold, high sensitivity should be selected.
To configure detection sensitivity, from the navigation menu, go to Setting > Anomaly detection. If you click Applications for example, you will see that DESK distinguishes between an absolute threshold and a relative threshold for the median and the slowest 10 percent of each given metric. As shown in the example below, the median thresholds for response time degradation are set to 100 ms (absolute) and 50% (relative) above the auto-learned baseline. The threshold for the slowest 10% of the requests is set to 1,000 ms (absolute) and 100% (relative) above the auto-learned baseline.
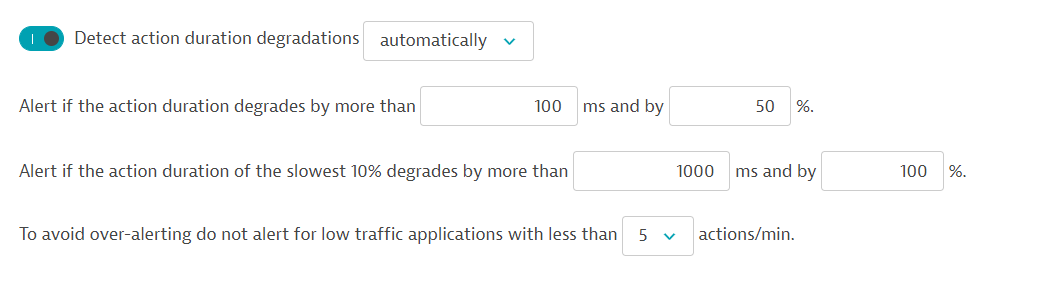
Also, as you can see in the example above, DESK anomaly detection threshold settings allow you to specify how many actions per minute should be observed before Davis (the DESK AI causation engine) sends out problem alerts related to anomalies. This setting allows you to disable alerting for low traffic applications and services—baselining and alerting on low traffic applications often leads to unnecessary alerts.
In addition to automatically detecting all your applications, services, and running processes, DESK also monitors your development and testing services—even build processes such as Jenkins. In cases where Davis isn't able to collect enough statistically relevant data for such services, automated baselining isn't the best approach to anomaly detection. For such situations where your development team knows better, DESK provides fixed thresholds. Fixed thresholds allow you to overrule Davis smart multidimensional baselining by setting hard limits on response times and error rates that are not to be exceeded. You can specify fixed thresholds for services and applications on the global level or for specific application and service instances.
Adapting the sensitivity of anomaly detection either by deviating from automated baselines or by specifying fixed thresholds is supported for:
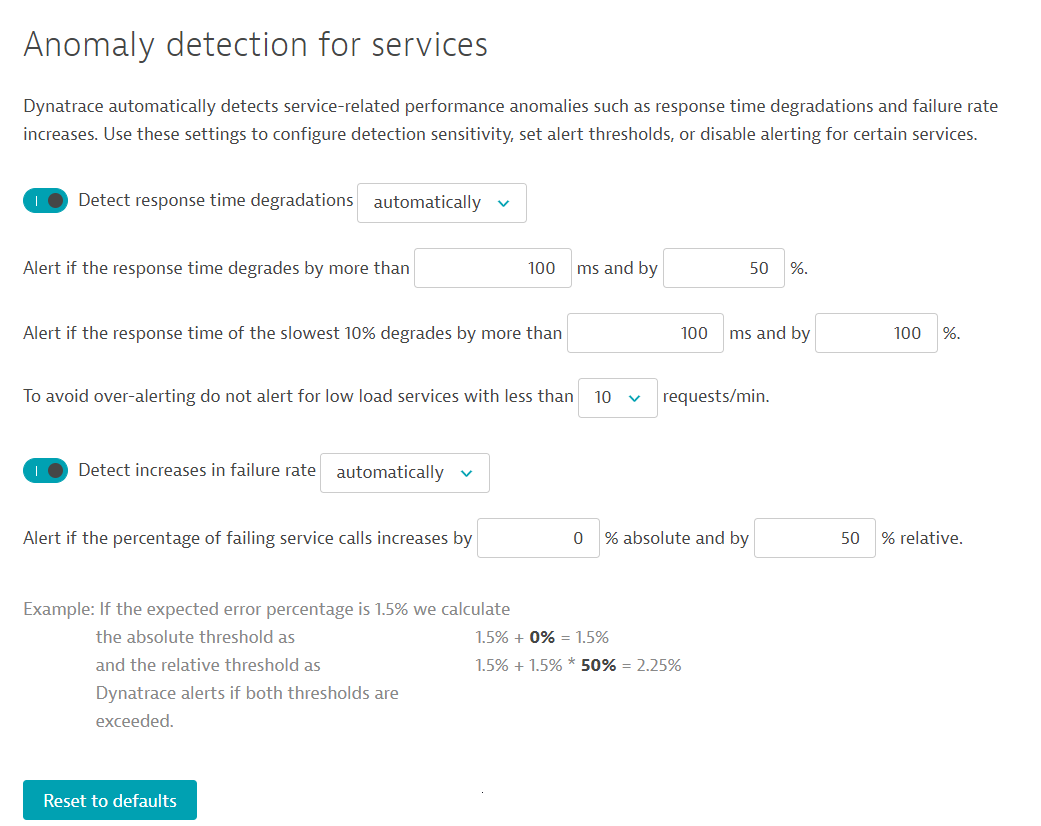
Go to Setting > Anomaly detection > Services. DESK offers anomaly detection thresholds for two types of anomalies: response time degradations and increases in failure rate:
- From the Detect response time degradations drop list, select automatically and set degradation values in the remaining fields. Violation of any criterion triggers an alert.
- To avoid over-alerting, define a requests/min rate below which a service should be considered "low load." Services with lower load rates will be excluded from evaluation.
- From the Detect increases in failure rate drop list, select automatically.
- Set the percentage of failing service calls threshold (relative % and absolute %) above which alerts should be sent out. The Example beneath this setting shows you exactly how alert thresholds are calculated based on the input values.
Reference period
Davis automatically generates performance baselines for your services based on monitored performance during a recent reference period. The default reference period is the past 7 days.
If monitoring data detected during the reference period is no longer valid (for example, if you've deployed a new version of your application that includes major changes, and you're now receiving a high number of alerts), click the Reset button to establish a new baseline. Davis will purge the previous reference period and immediately begin collecting data for a new reference period.
- From the Detect response time degradations drop list, select using fixed thresholds.
- Set the response time threshold rates in the remaining fields. Violation of any criterion triggers an alert.
- To avoid over-alerting, define a requests/min rate below which a database service should be considered "low load." Services with lower load rates will be excluded from evaluation.
- From the Sensitivity drop list, select the sensitivity of the threshold:
- Low: High statistical confidence is used, so brief violations (for example, do to a surge in load) won't trigger alerts.
- Medium: Reasonable statistical confidence is used to not alert on every single violation.
- High: No statistical confidence is used. Each violation triggers alert.
- From the Detect increases in failure rate drop list, select using fixed thresholds.
- Set the custom failure rate threshold value.
- From the Sensitivity drop list, select the sensitivity of the threshold.
Go to Setting > Anomaly detection > Database services. DESK offers anomaly detection thresholds for three types of anomalies: response time degradations, increases in failure rate, and failed database connects:
As the number of database service calls is typically much higher than the number of web service requests, and because database-service response times are on average faster than web service requests, Davis uses tighter thresholds for the detection of database-service violations.
- From the Detect response time degradations drop list, select automatically and set degradation values in the remaining fields. Violation of any criterion triggers an alert.
- To avoid over-alerting, define a requests/min rate below which a database service should be considered "low load." Services with lower load rates will be excluded from evaluation.
- From the Detect increases in failure rate drop list, select automatically.
- Set the percentage of failing service calls threshold (relative % and absolute %) above which alerts should be sent out. The Example beneath this setting shows you exactly how alert thresholds are calculated based on the input values.
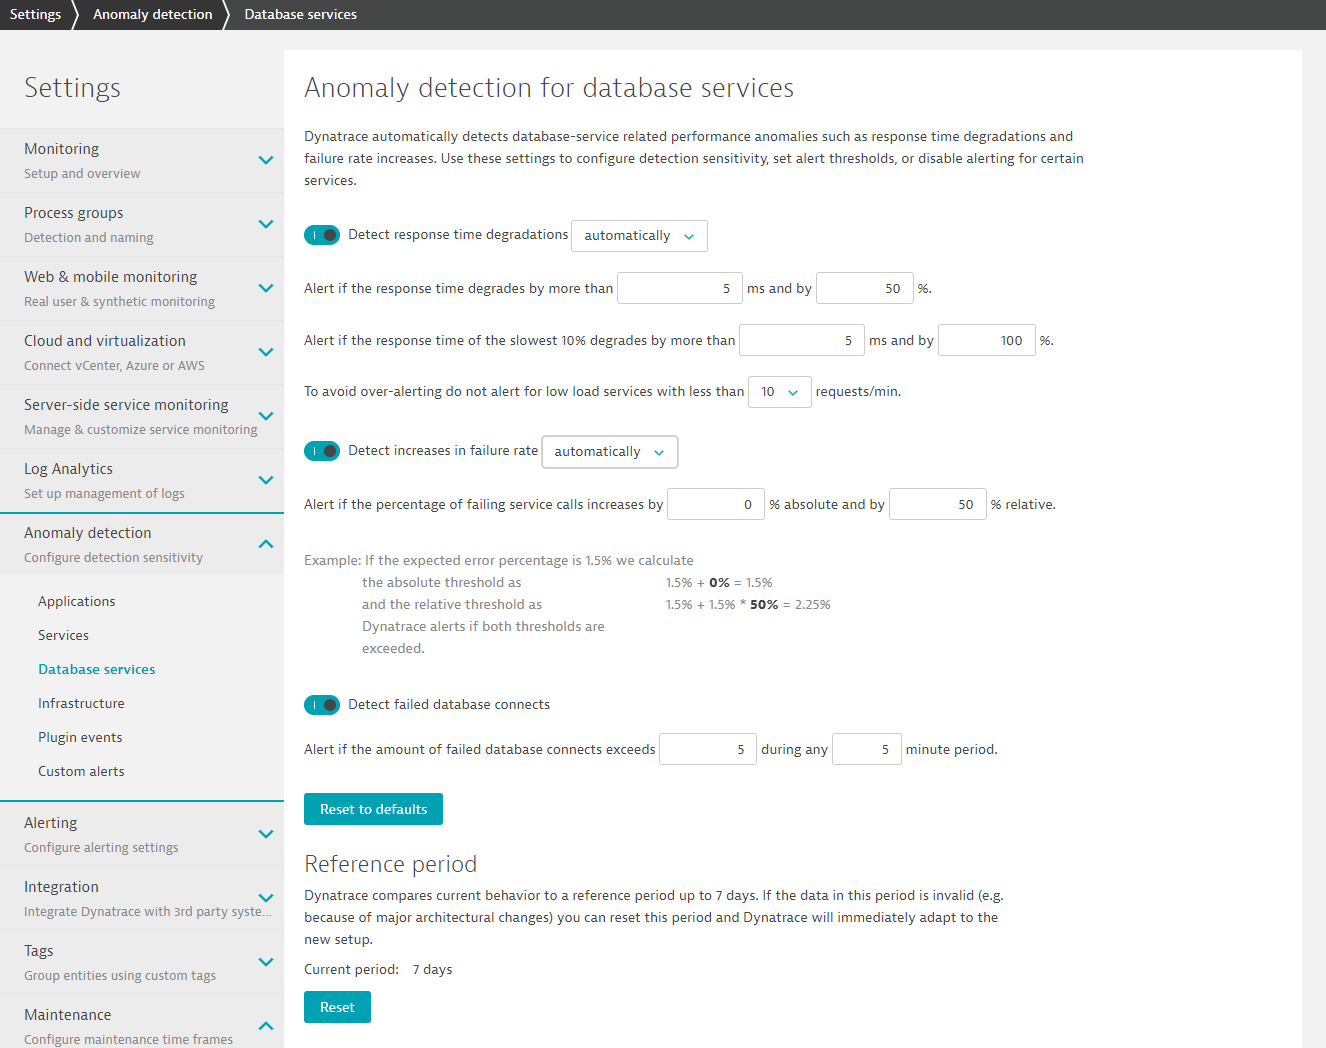
- Enable the Detect failed database connects setting to receive alerts when the rate of failed database connects exceeds a certain number of failures within a specified time period.
Reference period
Davis automatically generates performance baselines for your database services based on monitored performance during a recent reference period. The default reference period is the past 7 days.
If monitoring data detected during the reference period is no longer valid (for example, if you've deployed a new version of your application that includes major changes, and you're now receiving a high number of alerts), click the Reset button to establish a new baseline. Davis will purge the previous reference period and immediately begin collecting data for a new reference period.
- From the Detect response time degradations drop list, select using fixed thresholds.
- Set the response time threshold rates in the remaining fields. Violation of any criterion triggers an alert.
- To avoid over-alerting, define a requests/min rate below which a database service should be considered "low load." Services with lower load rates will be excluded from evaluation.
- From the Sensitivity drop list, select the sensitivity of the threshold:
- Low: High statistical confidence is used, so brief violations (for example, do to a surge in load) won't trigger alerts.
- Medium: Reasonable statistical confidence is used to not alert on every single violation.
- High: No statistical confidence is used. Each violation triggers alert.
- From the Detect increases in failure rate drop list, select using fixed thresholds.
- Set the custom failure rate threshold value.
- From the Sensitivity drop list, select the sensitivity of the threshold.
- Enable the Detect failed database connects setting to receive alerts when the rate of failed database connects exceeds a certain number of failures within a specified time period.
For the following, sensitivity can be adapted only by specifying fixed thresholds:
Davis automatically detects infrastructure-related performance anomalies such as high CPU saturation, memory outages, and low disk-space conditions across both physical and virtual infrastructure components. Go to Settings > Anomaly detection > Infrastructure to configure detection sensitivity, set alert thresholds, or disable alerting for issues within infrastructure components.
Anomaly detection can be configured for all hosts monitored by DESK regardless of their type (for example, EC2, VMware, OpenStack VMs, and physical machines). For VMware, detection settings are available for ESXi hosts, storage devices, datastores, and more. For Amazon Web Services EC2, settings are available for Relational Database Service (RDS), Elastic Load Balancing (ELB), and more.
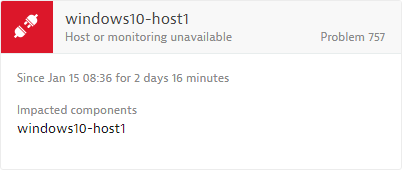
Adjust anomaly detection for host availability issues
By default, Davis generates a new availability problem whenever the connection to a running OneAgent is lost unexpectedly. There can be multiple root causes for losing a connection to a monitored host:
- The host may have gone offline unexpectedly, and so OneAgent receives no shutdown signal. This is considered a non-graceful shutdown or crash.
- Network issues may prevent DESK from receiving monitoring signals from a running host. In such cases, it’s unknown if the host is still running.
- The host may shut down gracefully, which means that the operating system sent a shutdown signal notifying OneAgent that an operator is intentionally shutting down the server.
The default host availability-alerting behavior automatically alerts on causes 1 and 2 in the list above. An opt-in setting is available for cause 3. If your DevOps team wants to open alerts for graceful host shutdowns, you can go to Settings > Anomaly detection > Infrastructure and on the Hosts tab enable Alert on graceful host shutdowns within the Detect host or monitoring connection lost problems option.
Once you’ve configured a host availability alerting strategy, the next time an affected host becomes unavailable, a Host or monitoring unavailable problem card will appear in your Problems page (see example below).
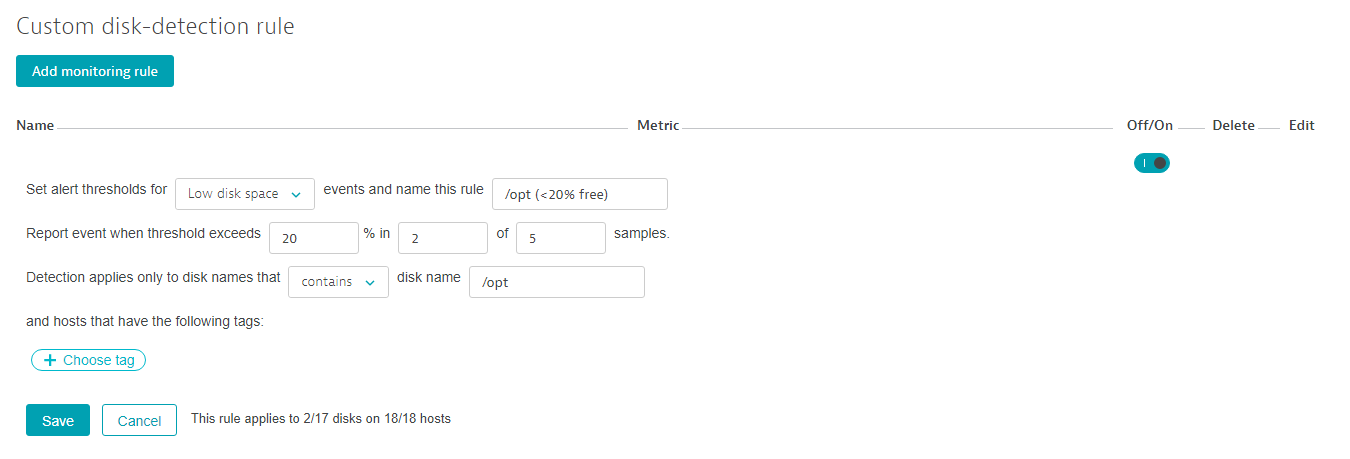
Adjust anomaly detection for a specific group of disks
Davis automatically discovers all your individual disks and detects anomalies such as low available disk size or slow disks. There are different kind of disks on a host such as a boot disk, a disk holding all the logs or a disk for storing business data. While alerting on low disk space would not make any sense for a fixed sized boot disk image, it makes perfectly sense for a disk containing critical business data.
Within the anomaly detection settings you can define rules to fine tune the disk alerting thresholds on an enterprise scale. Global disk alerting rules are based on disk name patterns and groups of tagged hosts. To define a new disk alerting rule, in the Infrastructure tab click Add monitoring rule.
Running in automatic mode, Davis detects low disk space for all monitored disks if the amount of free space is less than 3% of the overall disk capacity. Custom disk anomaly detection rules can be used to distinguish between different kind of disks within your environment.
A disk anomaly detection rule always contains a filter for disk names. Additionally, all your hosts can be grouped and filtered by tags. While you can easily select relevant disks by defining a disk name pattern, you can also define different thresholds for tagged groups of hosts.
A typical use-case here is to define strict thresholds for production machines, while you accept lower ones for development hosts. A specific rule on a group of disks automatically overrides the global threshold that is used for all other disks within your system. Below you can view an example that shows how to define your own anomaly detection rule for specific disks:
Davis sends out near real-time alerts with context-sensitive root-cause analysis details that facilitate problem resolution. There can be situations, however, when you don’t want to receive alerts related to certain known problems. For example, you may not want to be alerted each time your free disk space drops below 30%, or when a certain service method throws a recurring error that has no impact on customer experience.
While one solution to unnecessary alerting might be to adjust your anomaly-detection thresholds downward so that, for example, low disk space issues no longer trigger alerts, there is a better way of customizing alerting that doesn’t compromise DESK anomaly-detection AI. More specifically, you can define custom alerts for specific metric-threshold breaches, along with rules for the number of breach violations that must occur before an alert is sent out. Meaningful names can even be defined for custom alerts that are sent out through all your organization’s problem-notification channels.
Create a custom alert
To define a custom alert
- Go to Settings > Anomaly detection > Custom alerts.
- Click the Create custom alert button.
- Type an alert name.
- Define the alerting scope type.
- Select the metric that the alert is to be based on, along with an appropriate aggregation type.
- Define custom alert values that are appropriate for the selected metric and the unique conditions of your environment. The example of
Low disk warning alertconfiguration below will trigger an alert if the minimum metric threshold of23 GBsis breached for longer than3minutes during any5minute sliding timeframe.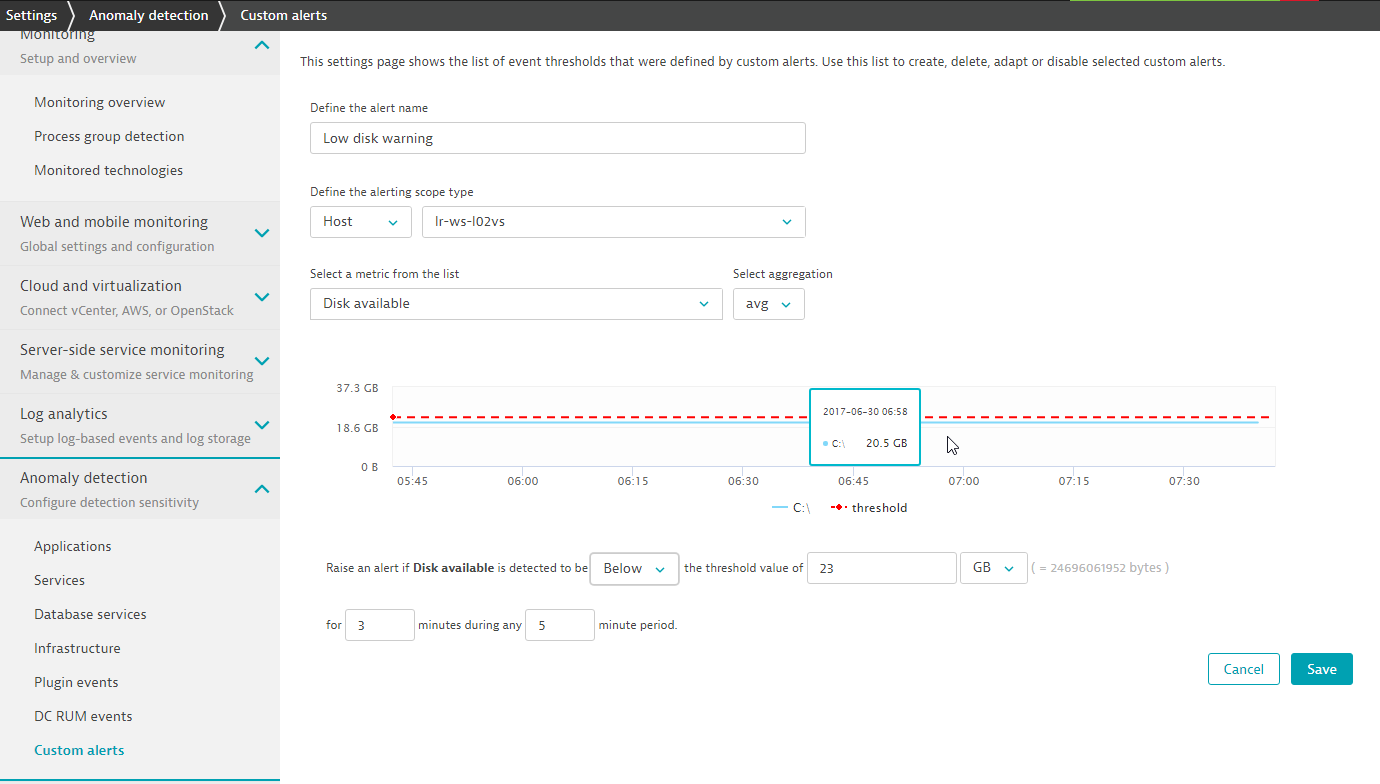
Working with custom alerts
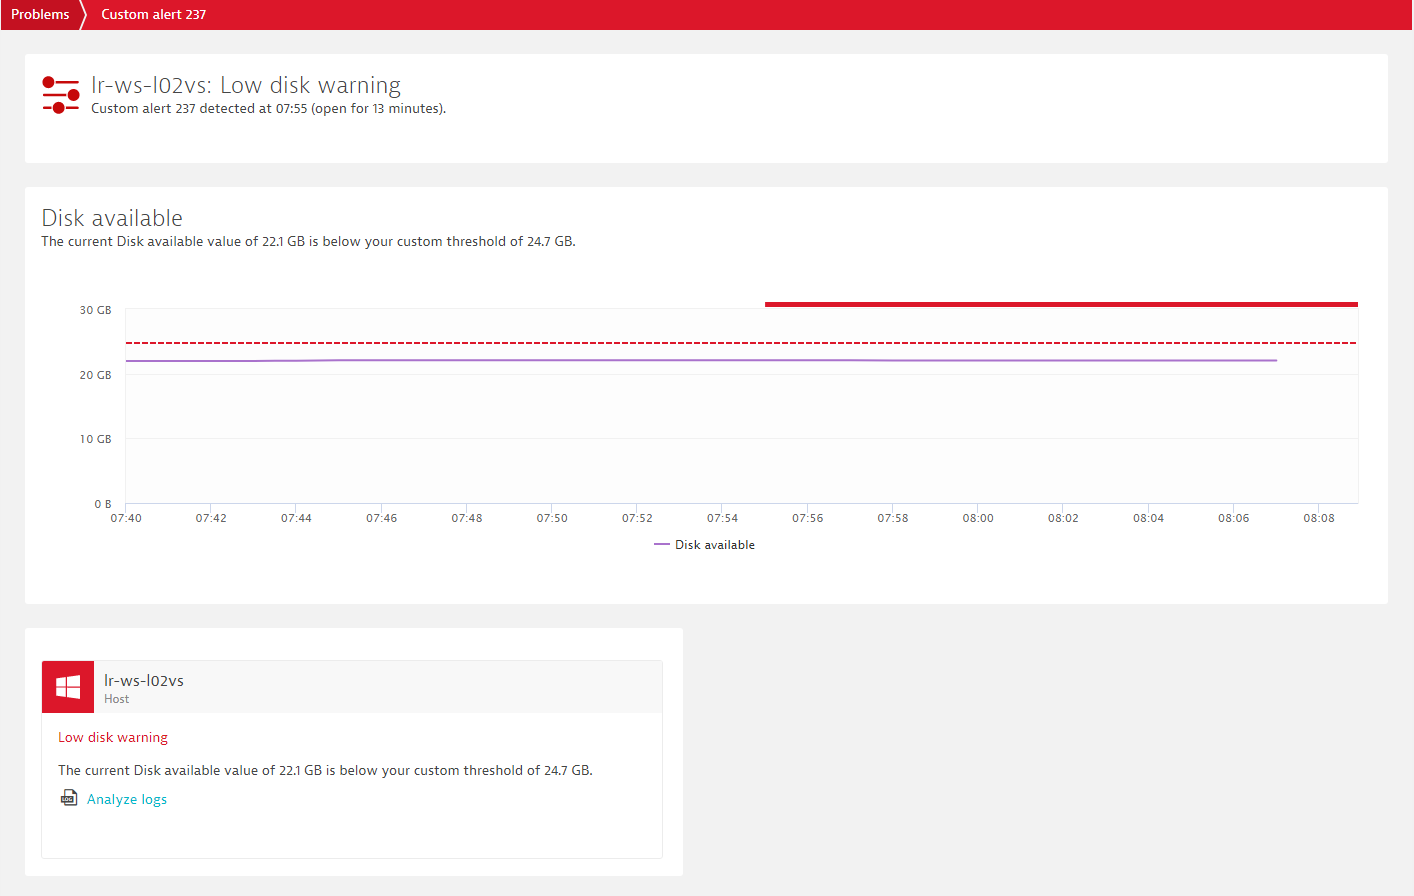
If Davis detects that one of your configured custom alert thresholds has been violated, a new custom alert will be generated and an alert will be sent out. You can access these custom alerts on your Problems page at any time.
As with standard problem, custom alerts show the component that violated the threshold and the duration of the breach. As you can see below, custom alerts can be identified by their distinct icon.
![]()
If you click the custom alert, you will access the problem’s overview page. Here you’ll see a chart that details the affected metric, specifics of the threshold breach, and a heat field that indicates the duration of the event (see example below).
Limitations
While events generated by custom alerts are listed on the Problems page alongside all other problems that have been detected via Davis, custom alerts are not factored into the DESK problem causation process. This means that custom alerts are never identified as the root cause of problems. So, when it comes to custom alerts, “what you set is what you get”.
Configure thresholds for individual entities
As an alternative to defining thresholds globally across your entire environment, you can disable global settings and instead fine tune threshold settings for individual applications and services using the application- and service-specific settings pages. See examples below.