Top database statements
The Top database statements view enables you to understand the overall database activity rather than just the activity of a single database. This view can also be used to better analyze end-to-end database activities during specific timeframes.
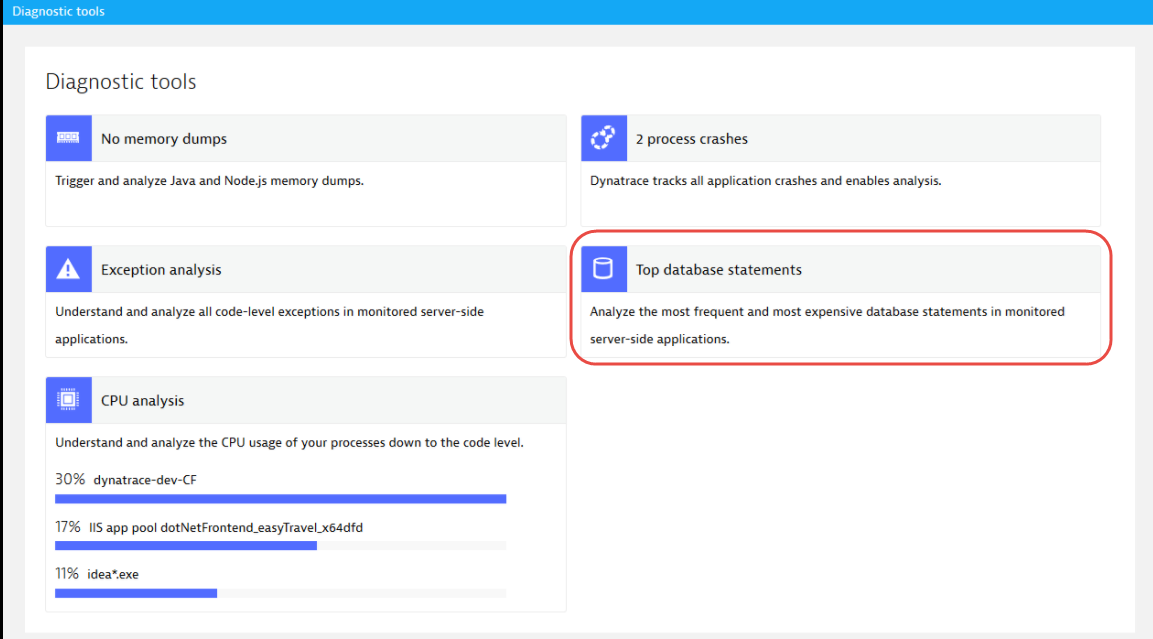
To access the Top database statements page:
- Select Diagnostic tools from the navigation menu.
- Click the Top database statements tile.
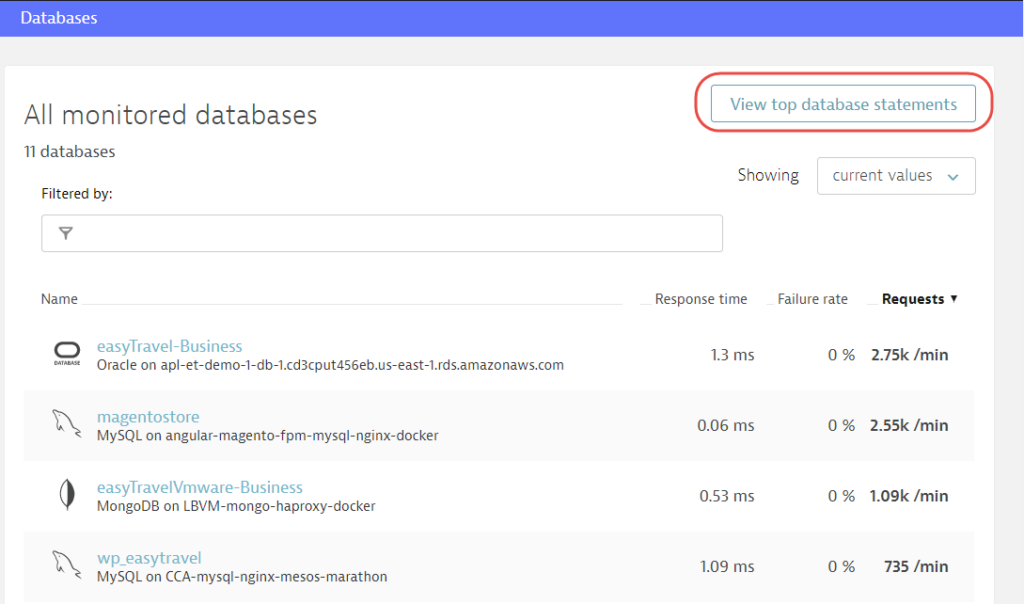
Alternatively, click View top database statements on the Databases page.
Analyze database statements
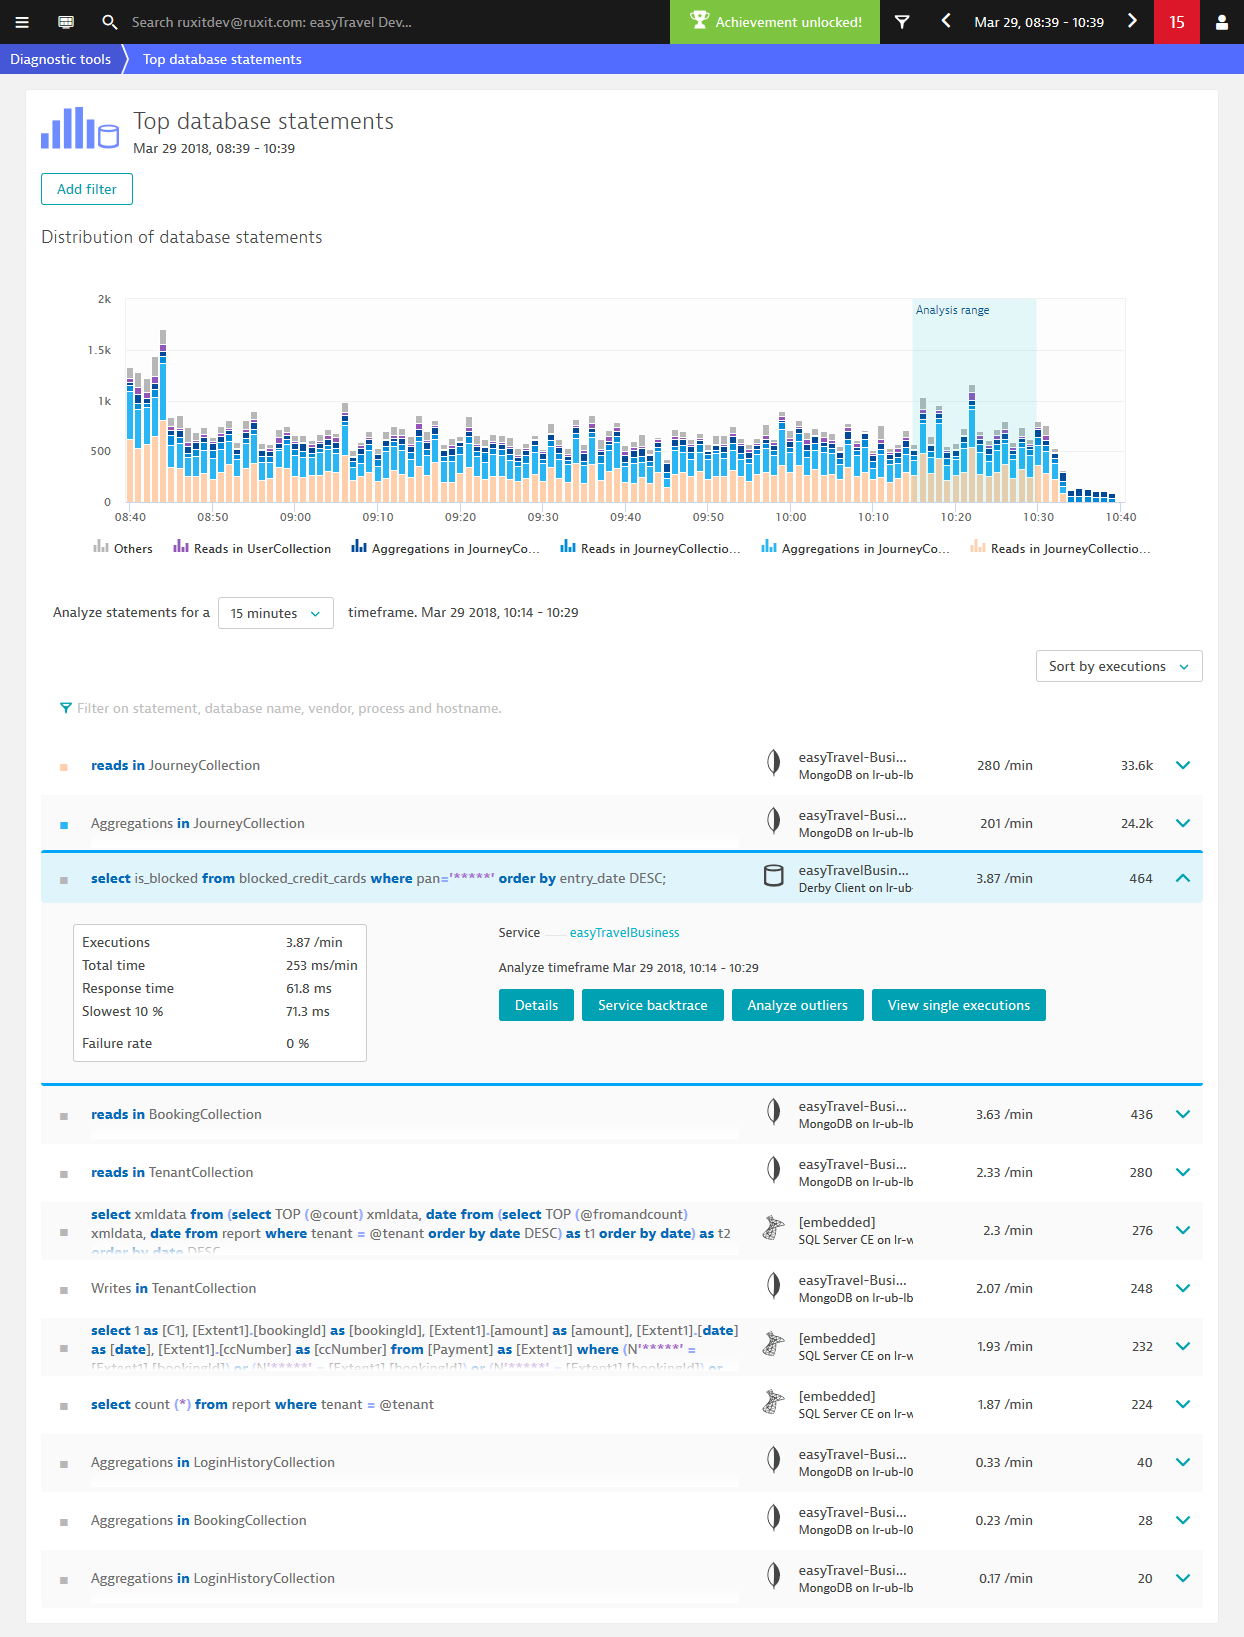
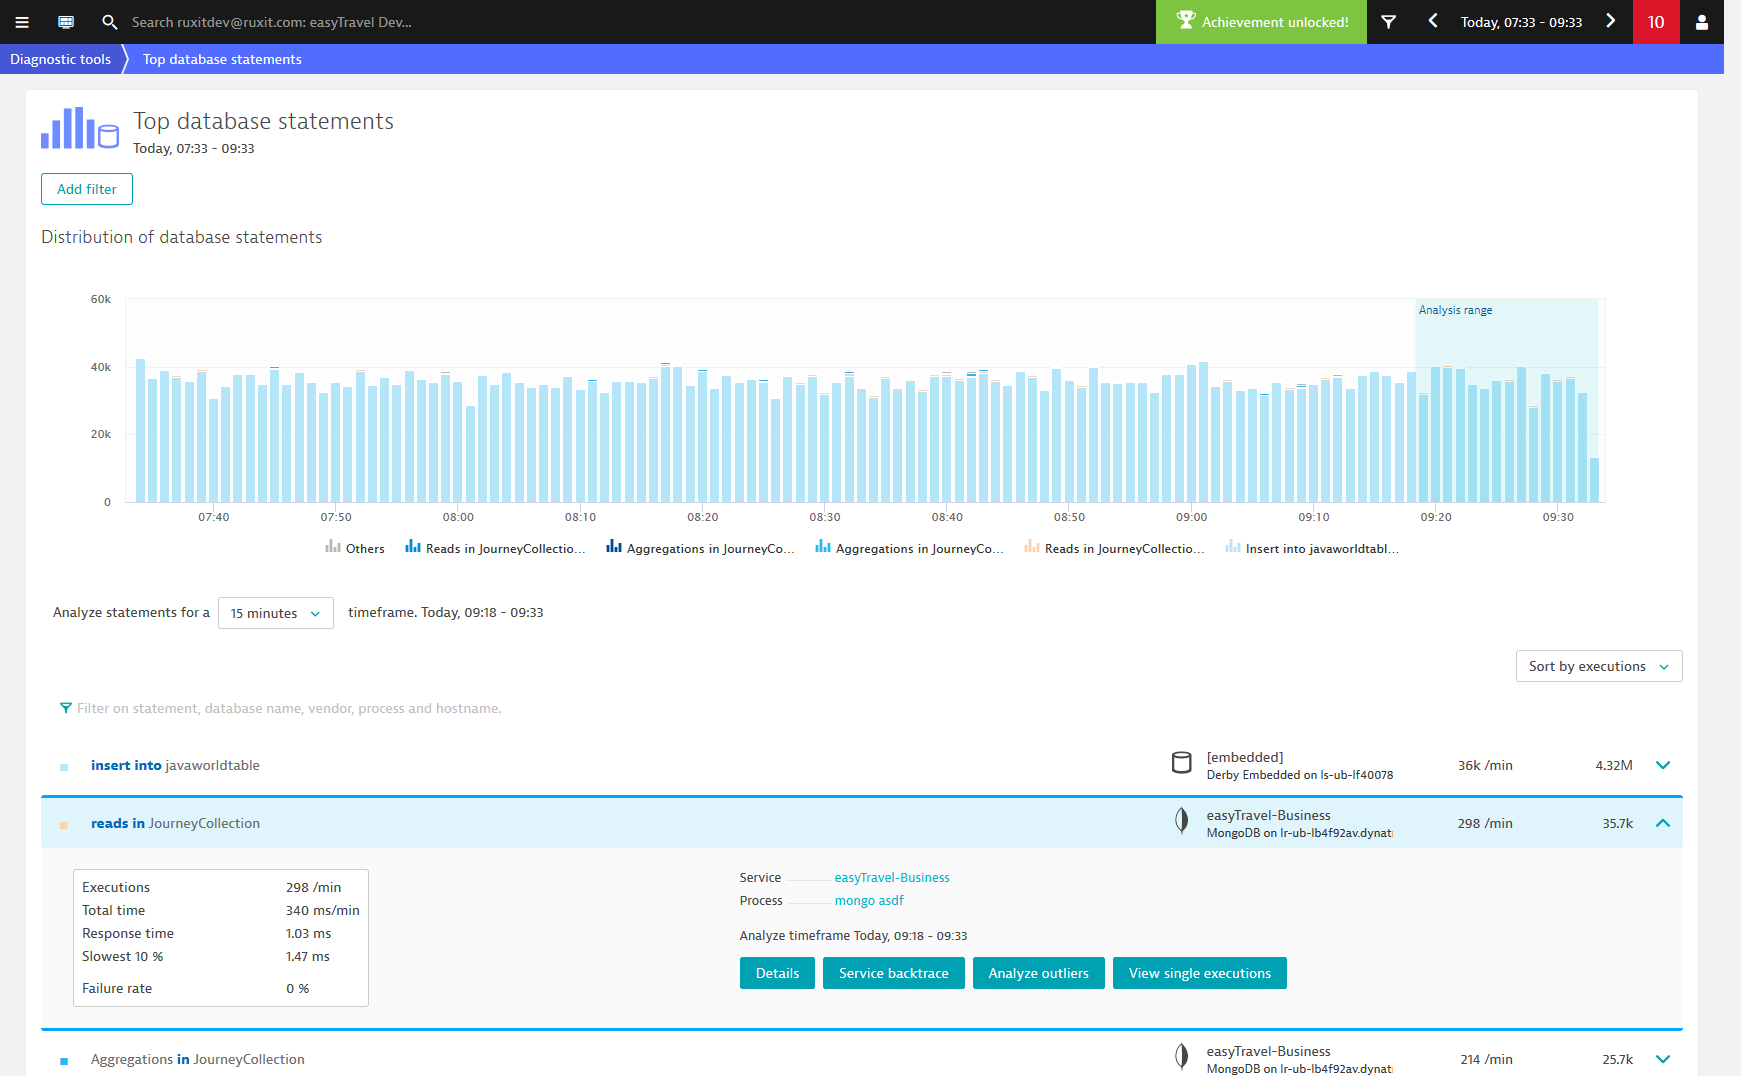
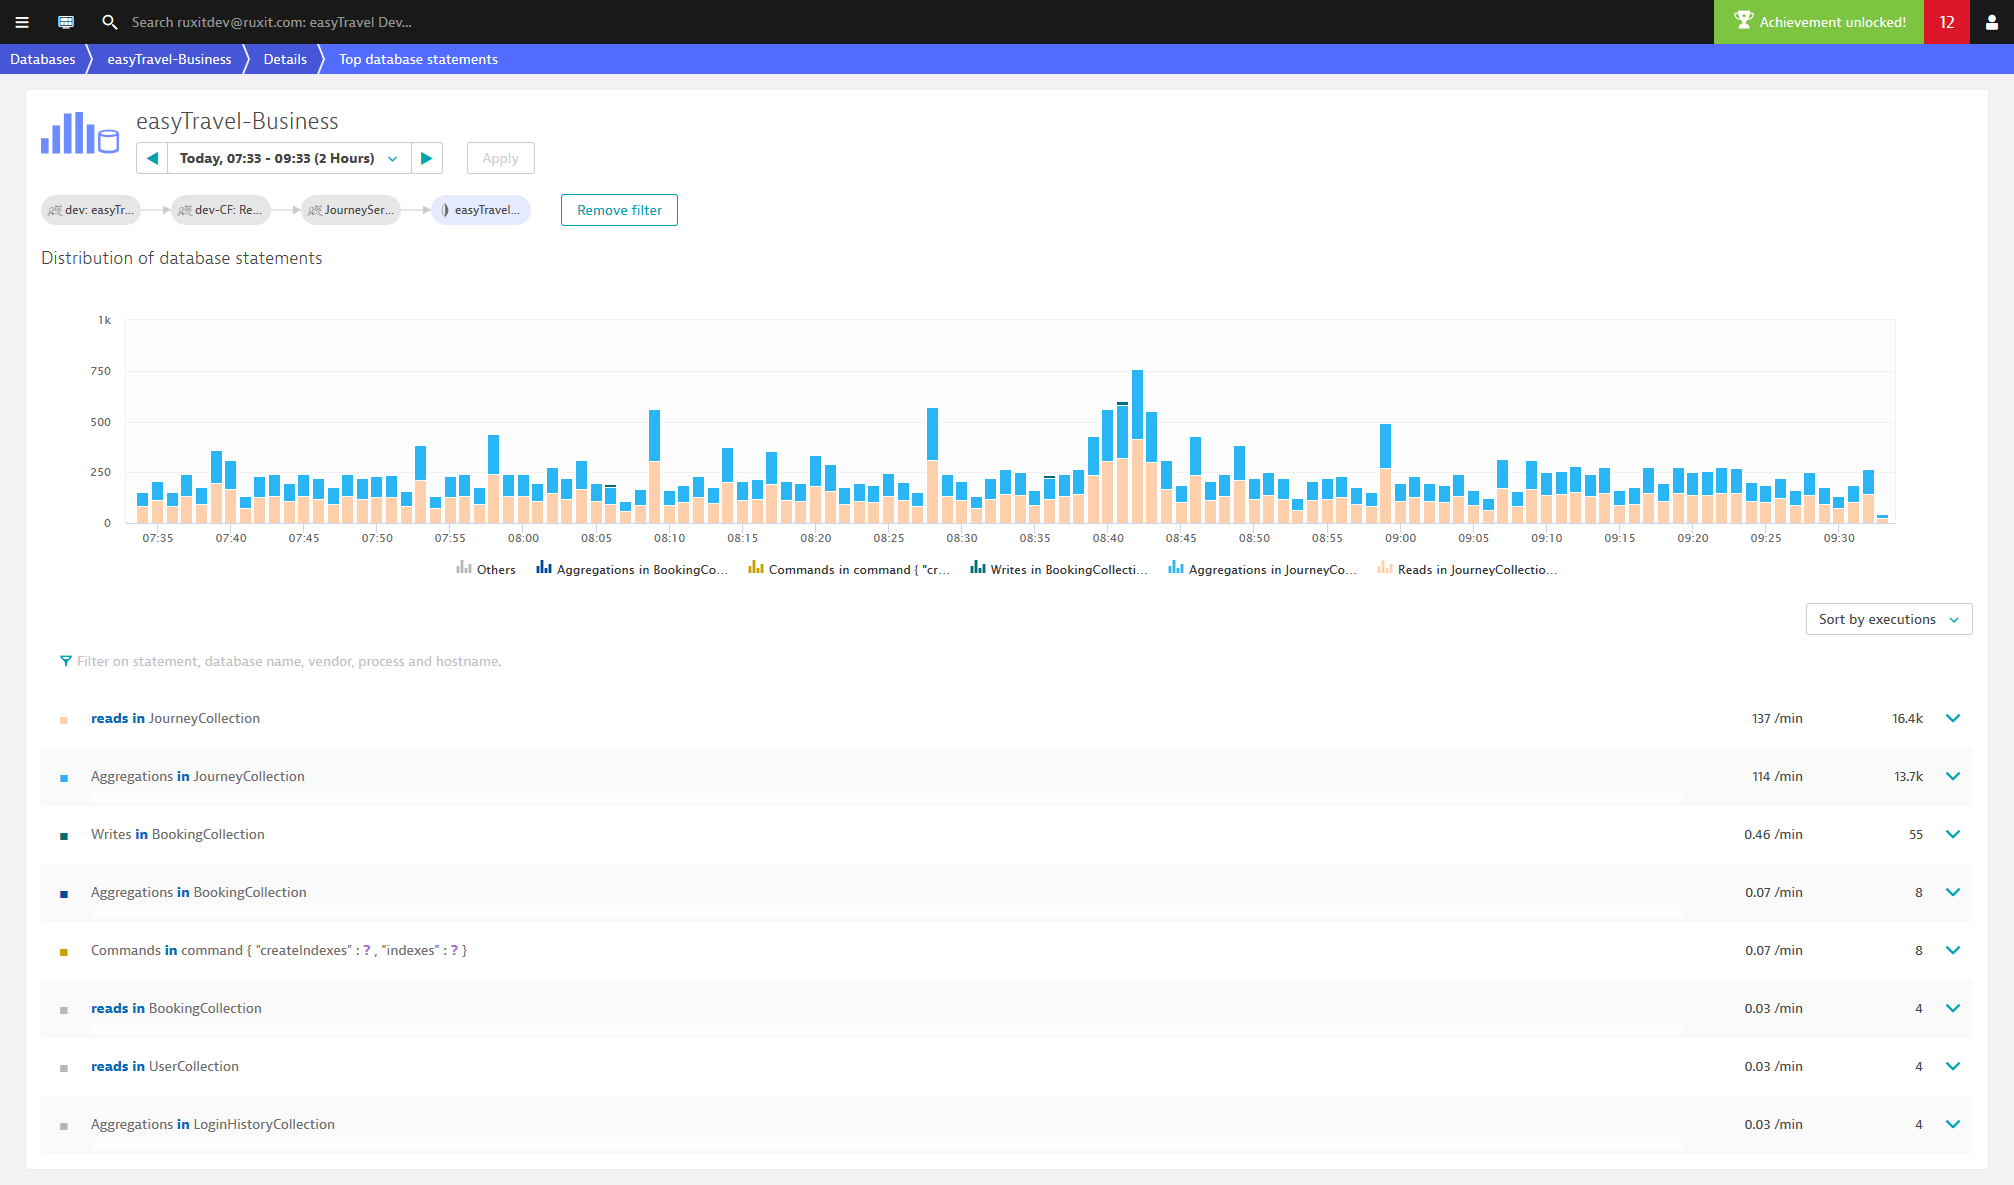
The Top database statements page displays a chart indicating the top SQL and NoSQL statements in your environment over time. The chart also highlights a few top statements based on execution count. The table following the chart lists the Top 100 database statements. You can control the order of statements, listing them based on time consumption per statement, the frequency of statement execution, or error rate.
The Top database statements list can be configured to sort based on the statements are executed more frequently or which statements are more expensive from a resource perspective.
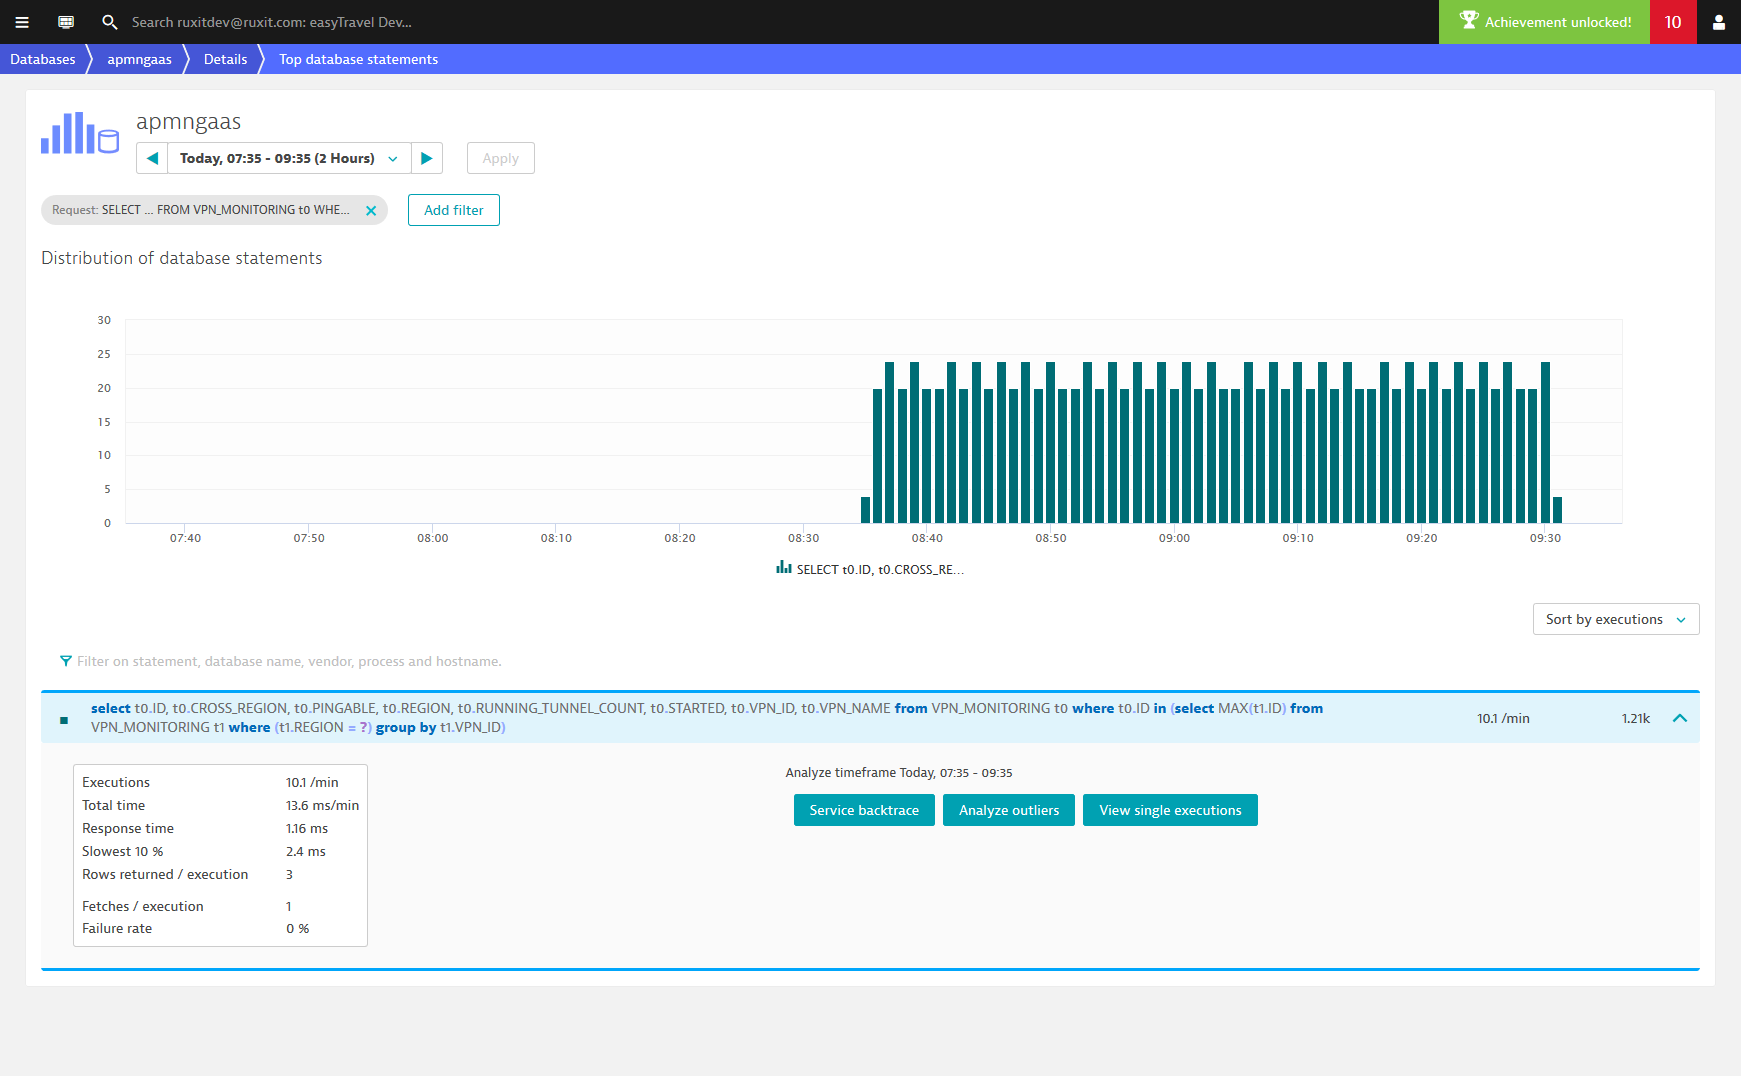
You can use the Add filter control to narrow down the list of database statements.
In the following example, the Request filter has been used.
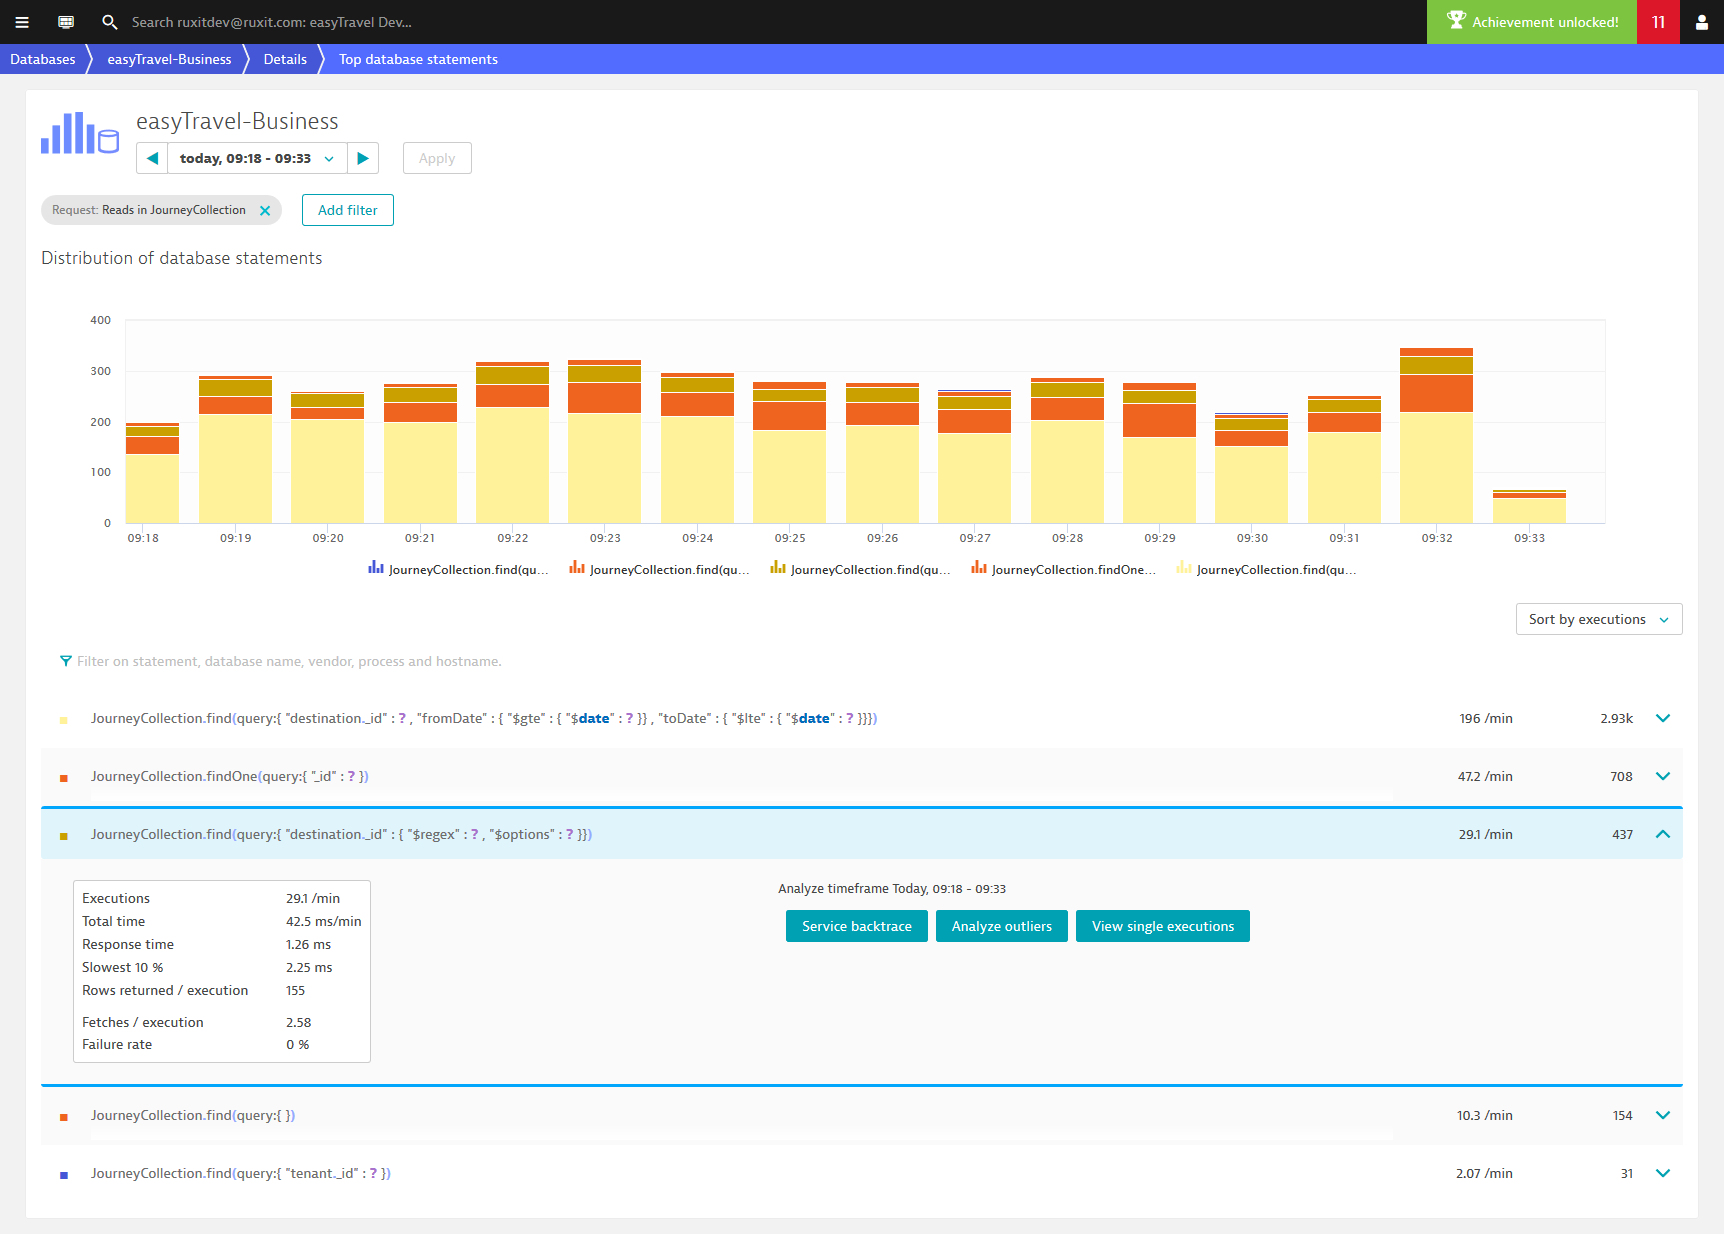
Analyze individual SQL statements
- From the navigation menu, select Diagnostic tools.
- Click the Top database statements tile.
- From the Analyze statements drop list, select an analysis timeframe.
- From the Sort by drop list, select a sorting approach.
- Optionally, click Add filter to filter the list of statements.
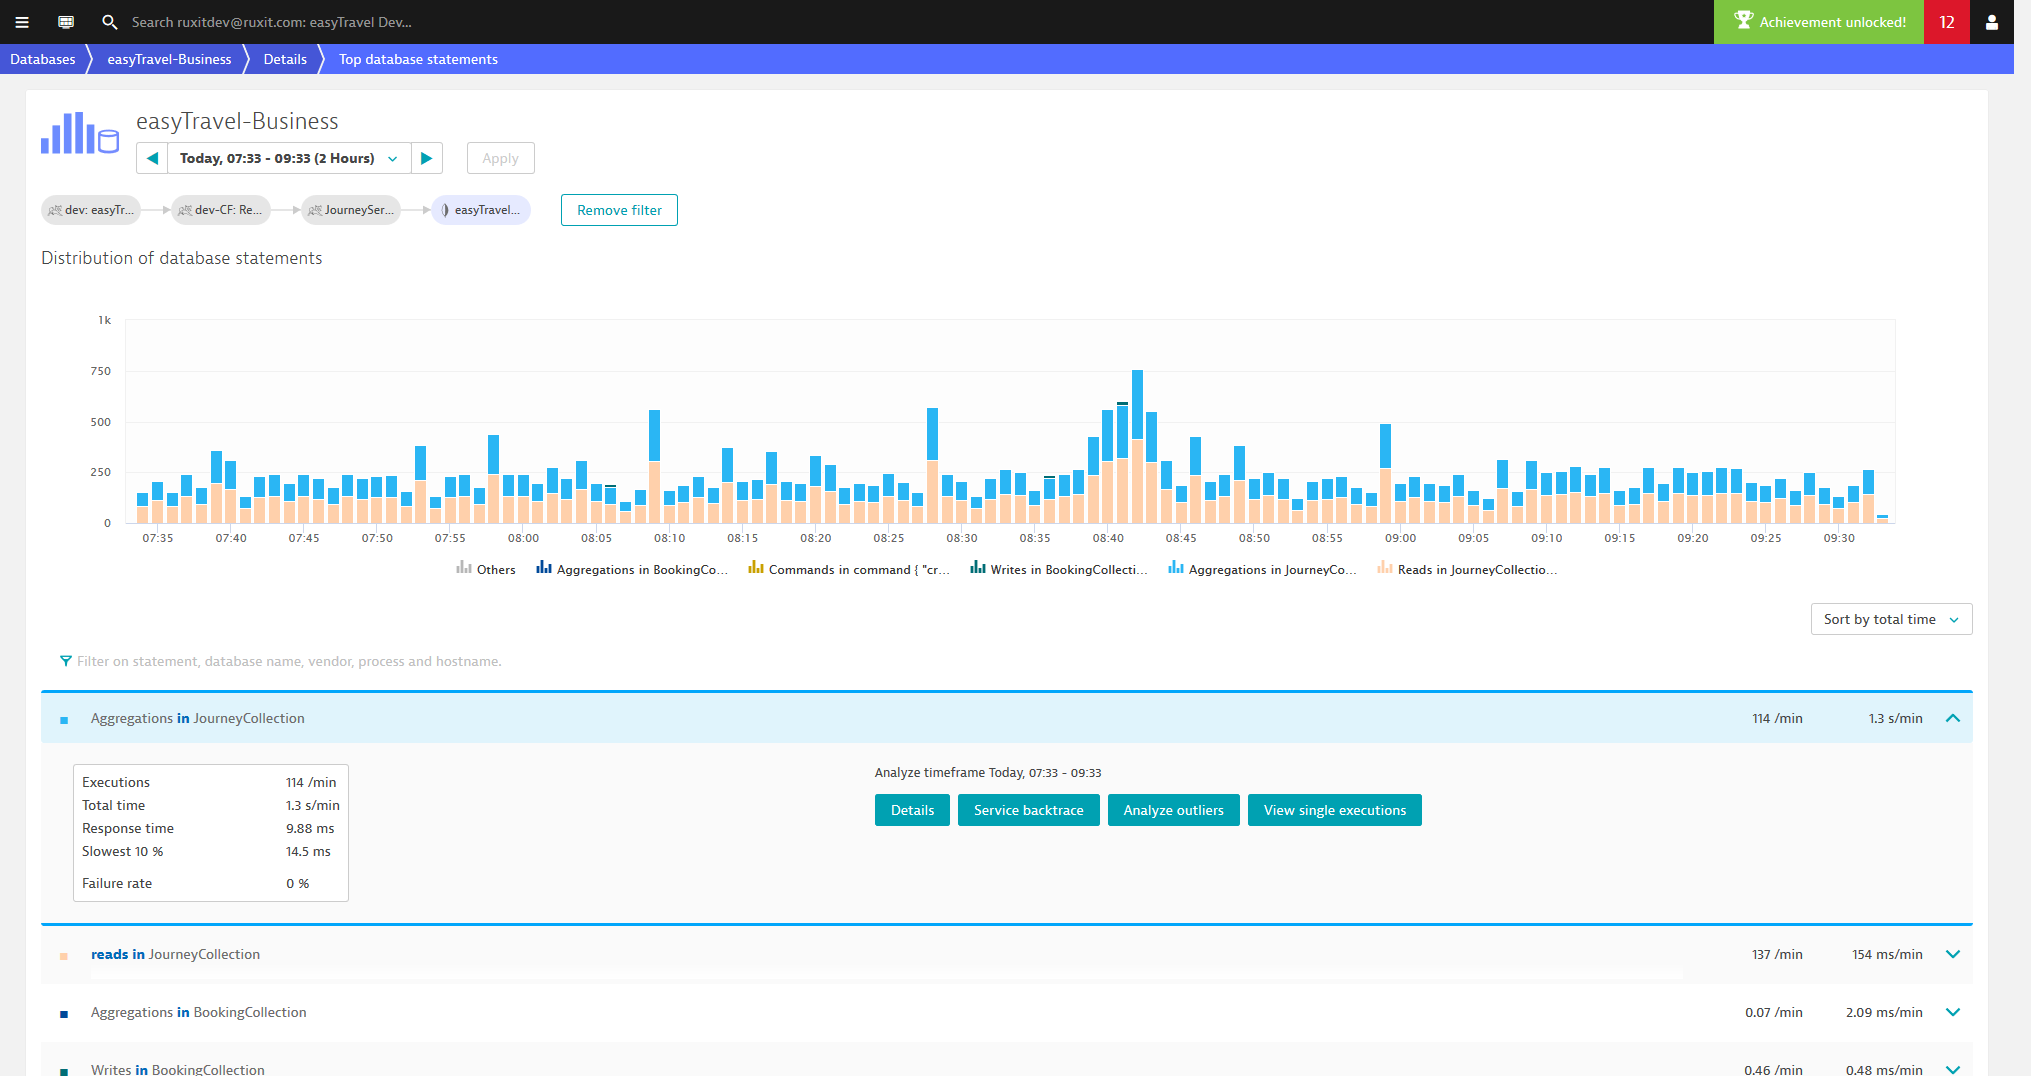
- Scroll down and select the statement that you want to analyze.
Here you'll find numerous details about the selected statement, including number of Executions, Response time, and Failure rate. You can also access several statement-specific analysis views from here, including Service backtrace and outlier analysis.
Database statement details
Click the Details button (see above) to view all permutations of the selected query. DESK aggregates the inserts, updates, and deletes on a per-table basis. It performs a similar aggregation for MongoDB on a per-collection basis (see example below).
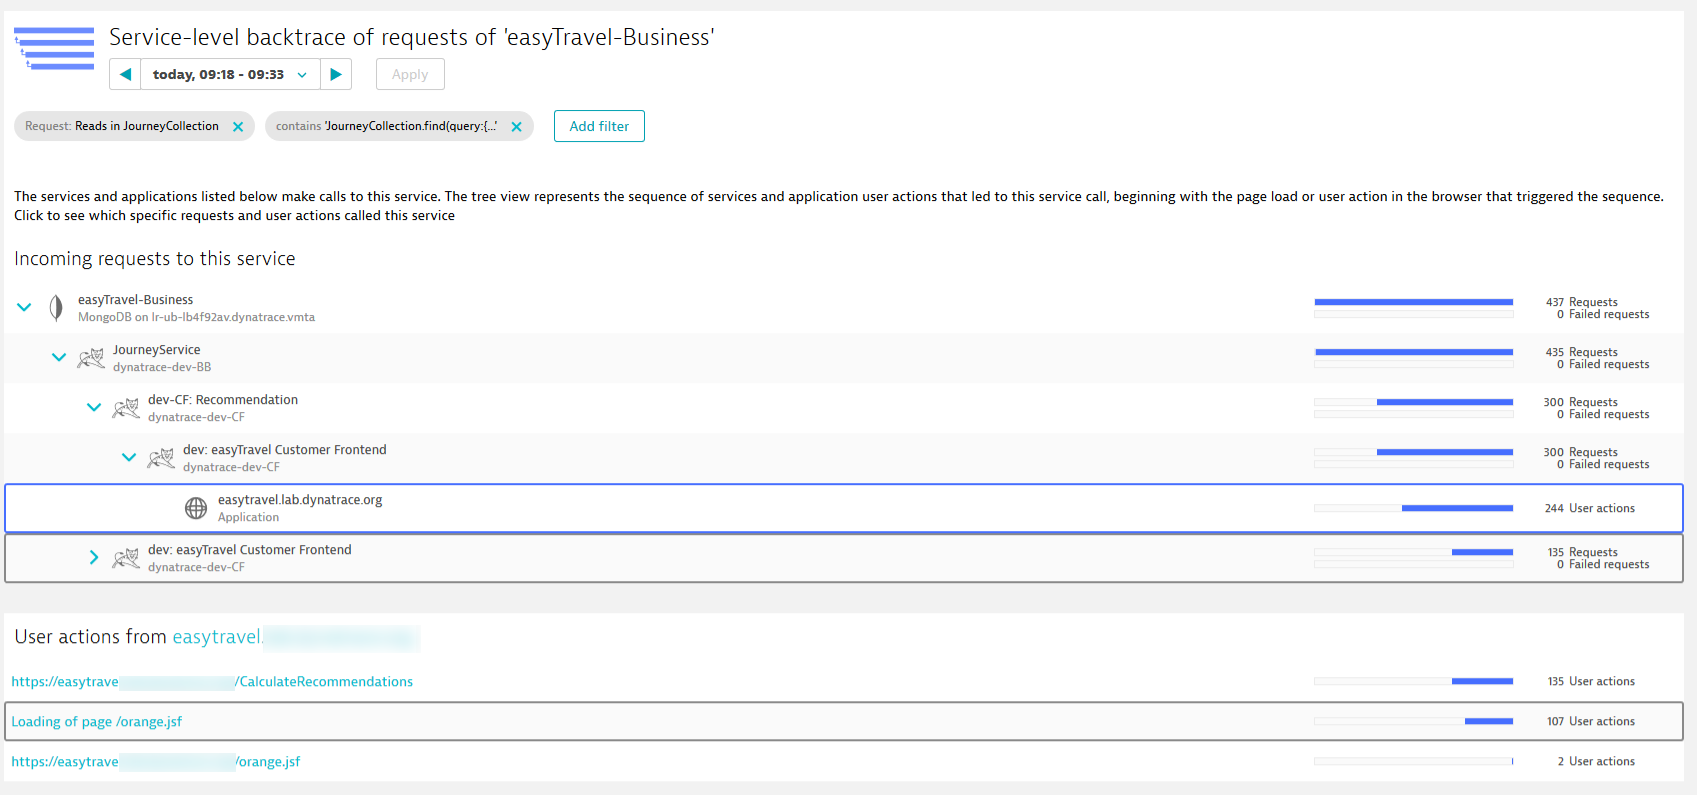
Database service backtrace
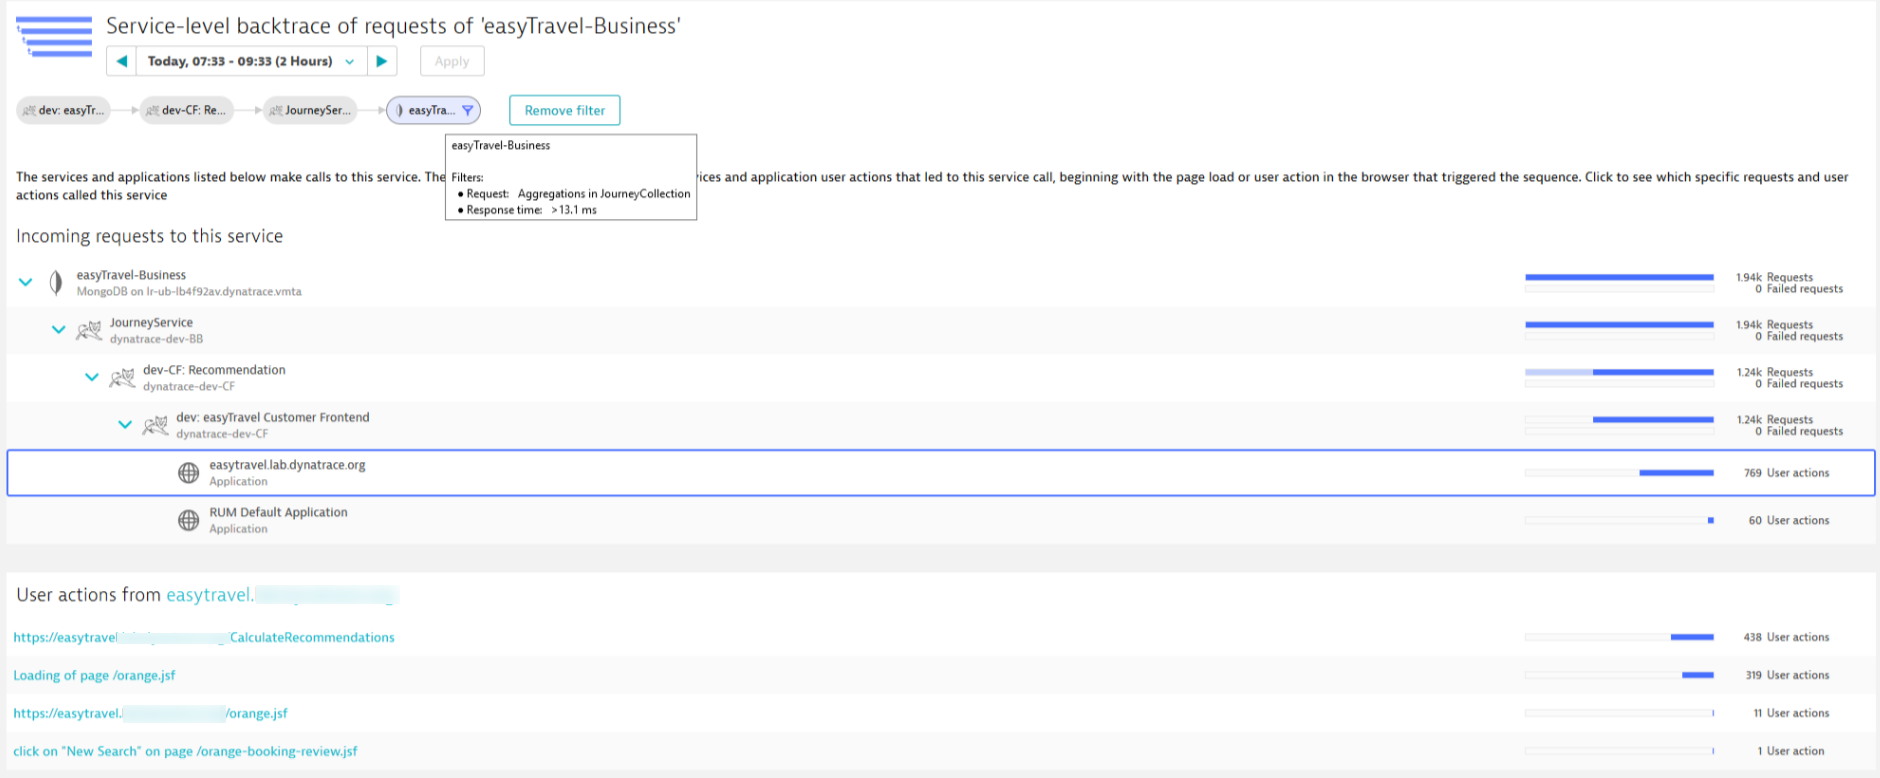
Click the Service backtrace button to access backtrace analysis for the selected statement. The Backtrace page provides details on the clicks that triggered the selected permutation of the SQL statement. Click on any of the incoming requests to view a visualization of the backtrace.
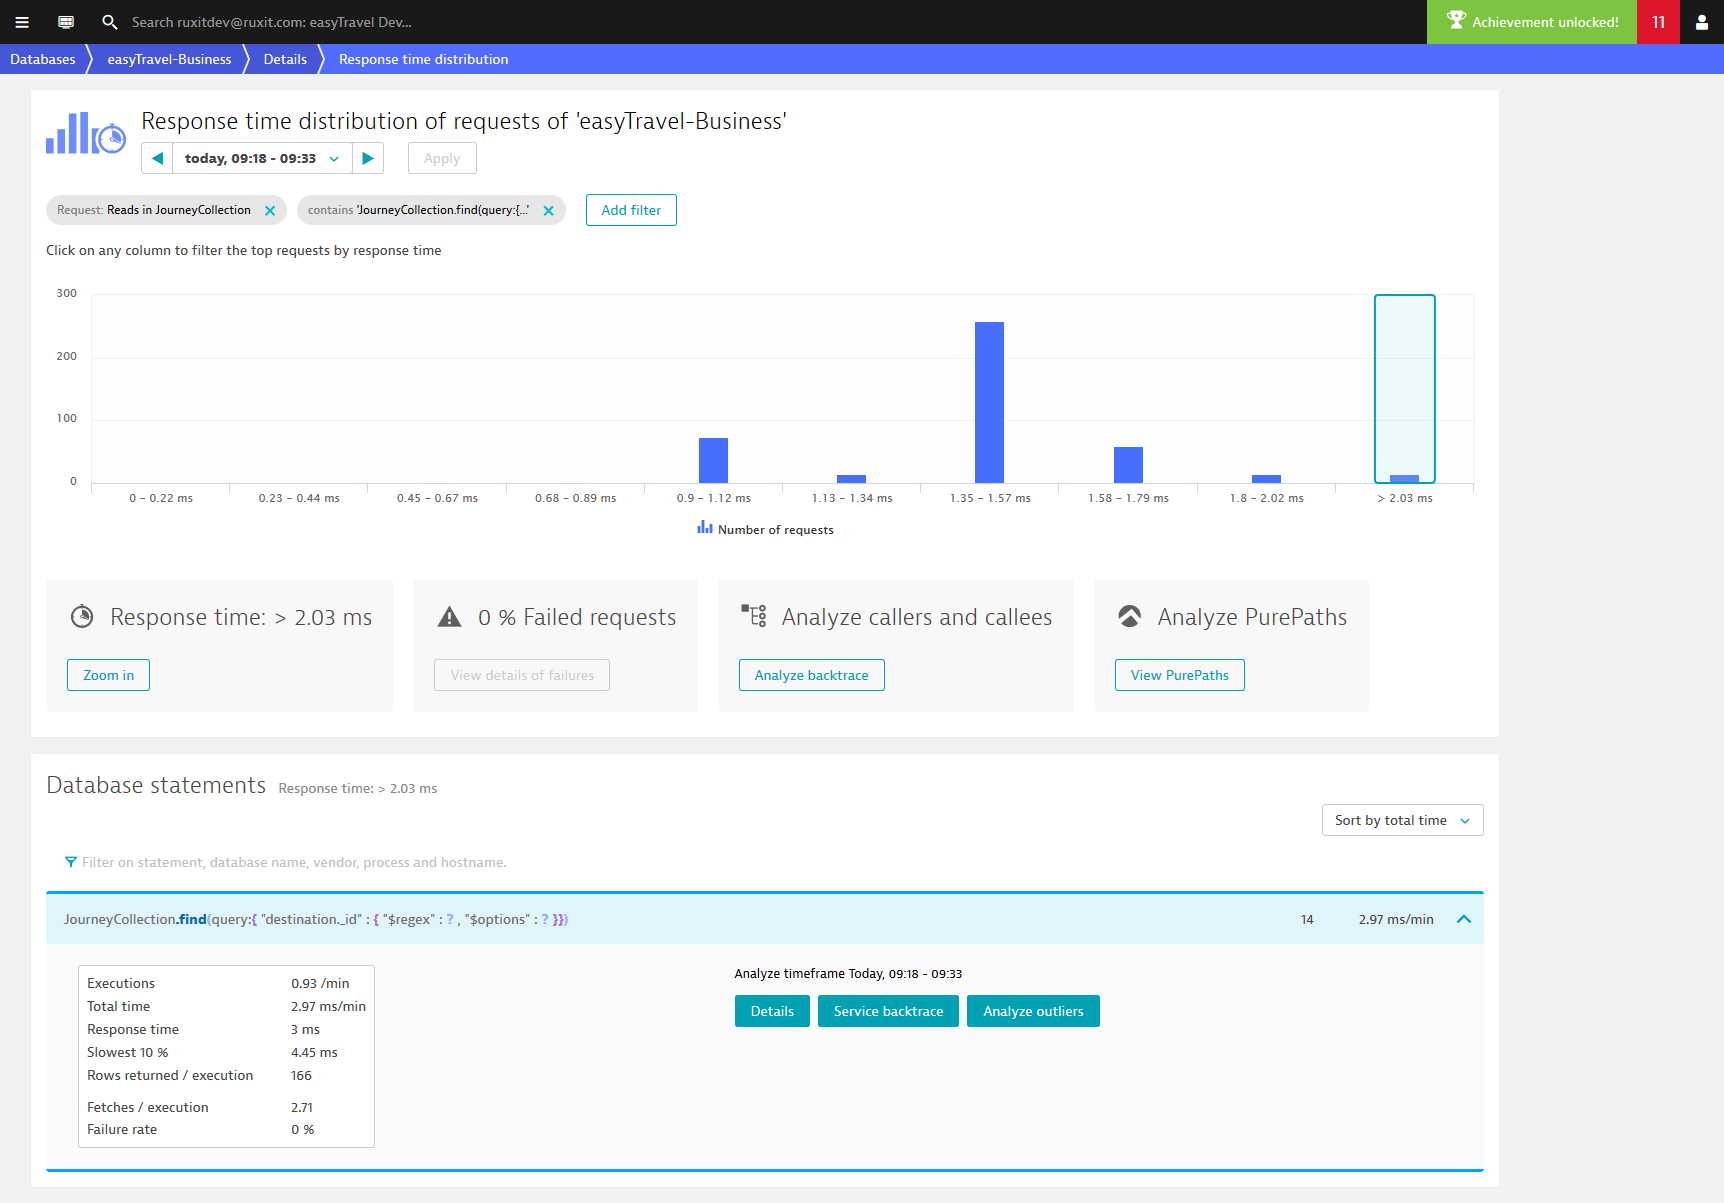
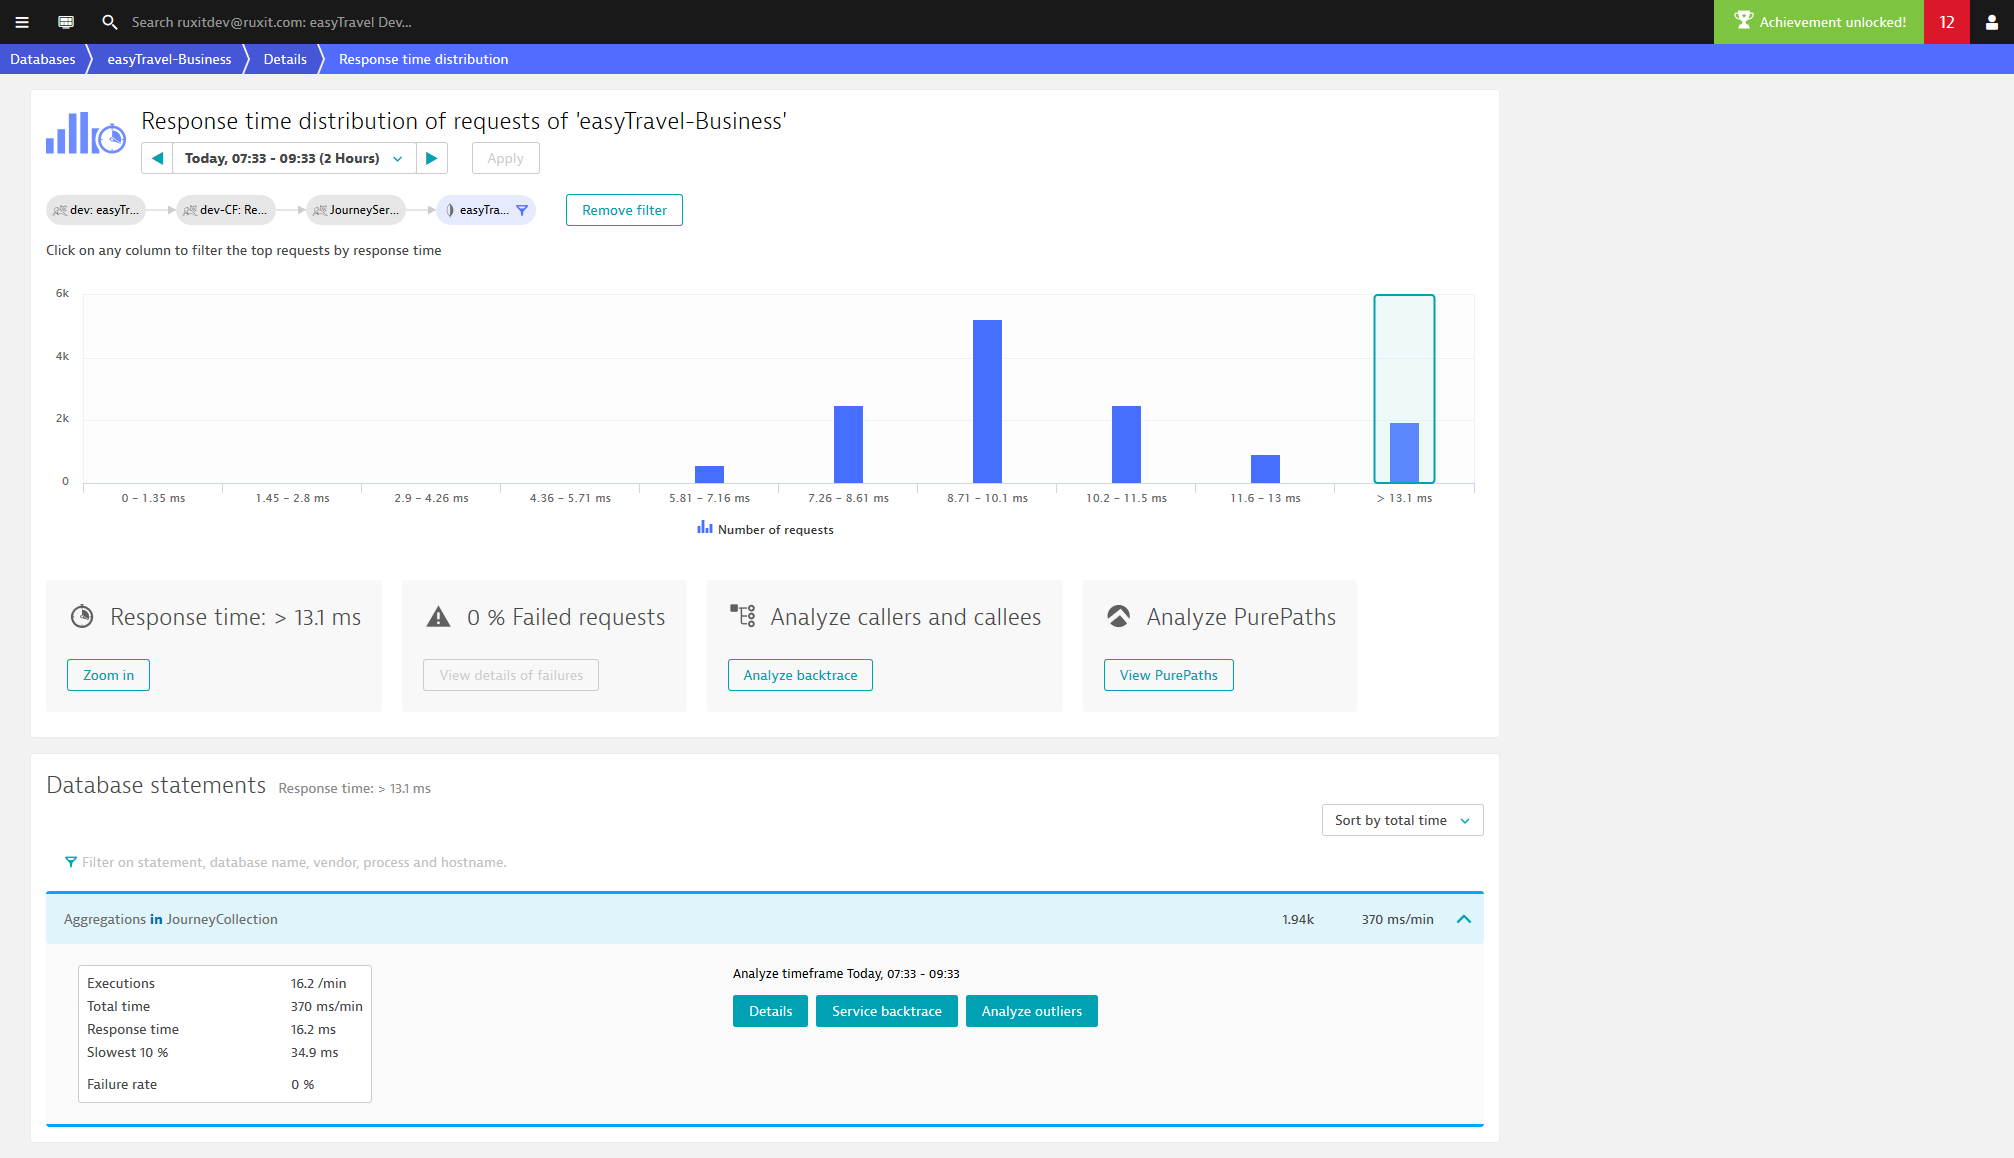
Response time distribution
To understand the response time distribution of the command, return to the Top databases statements page (as explained above) and click the Analyze Outliers button. The Response time distribution page shows the number of requests that fell within various response time ranges. Select any column in the chart to analyze the specific requests that fell within that specific response time range.
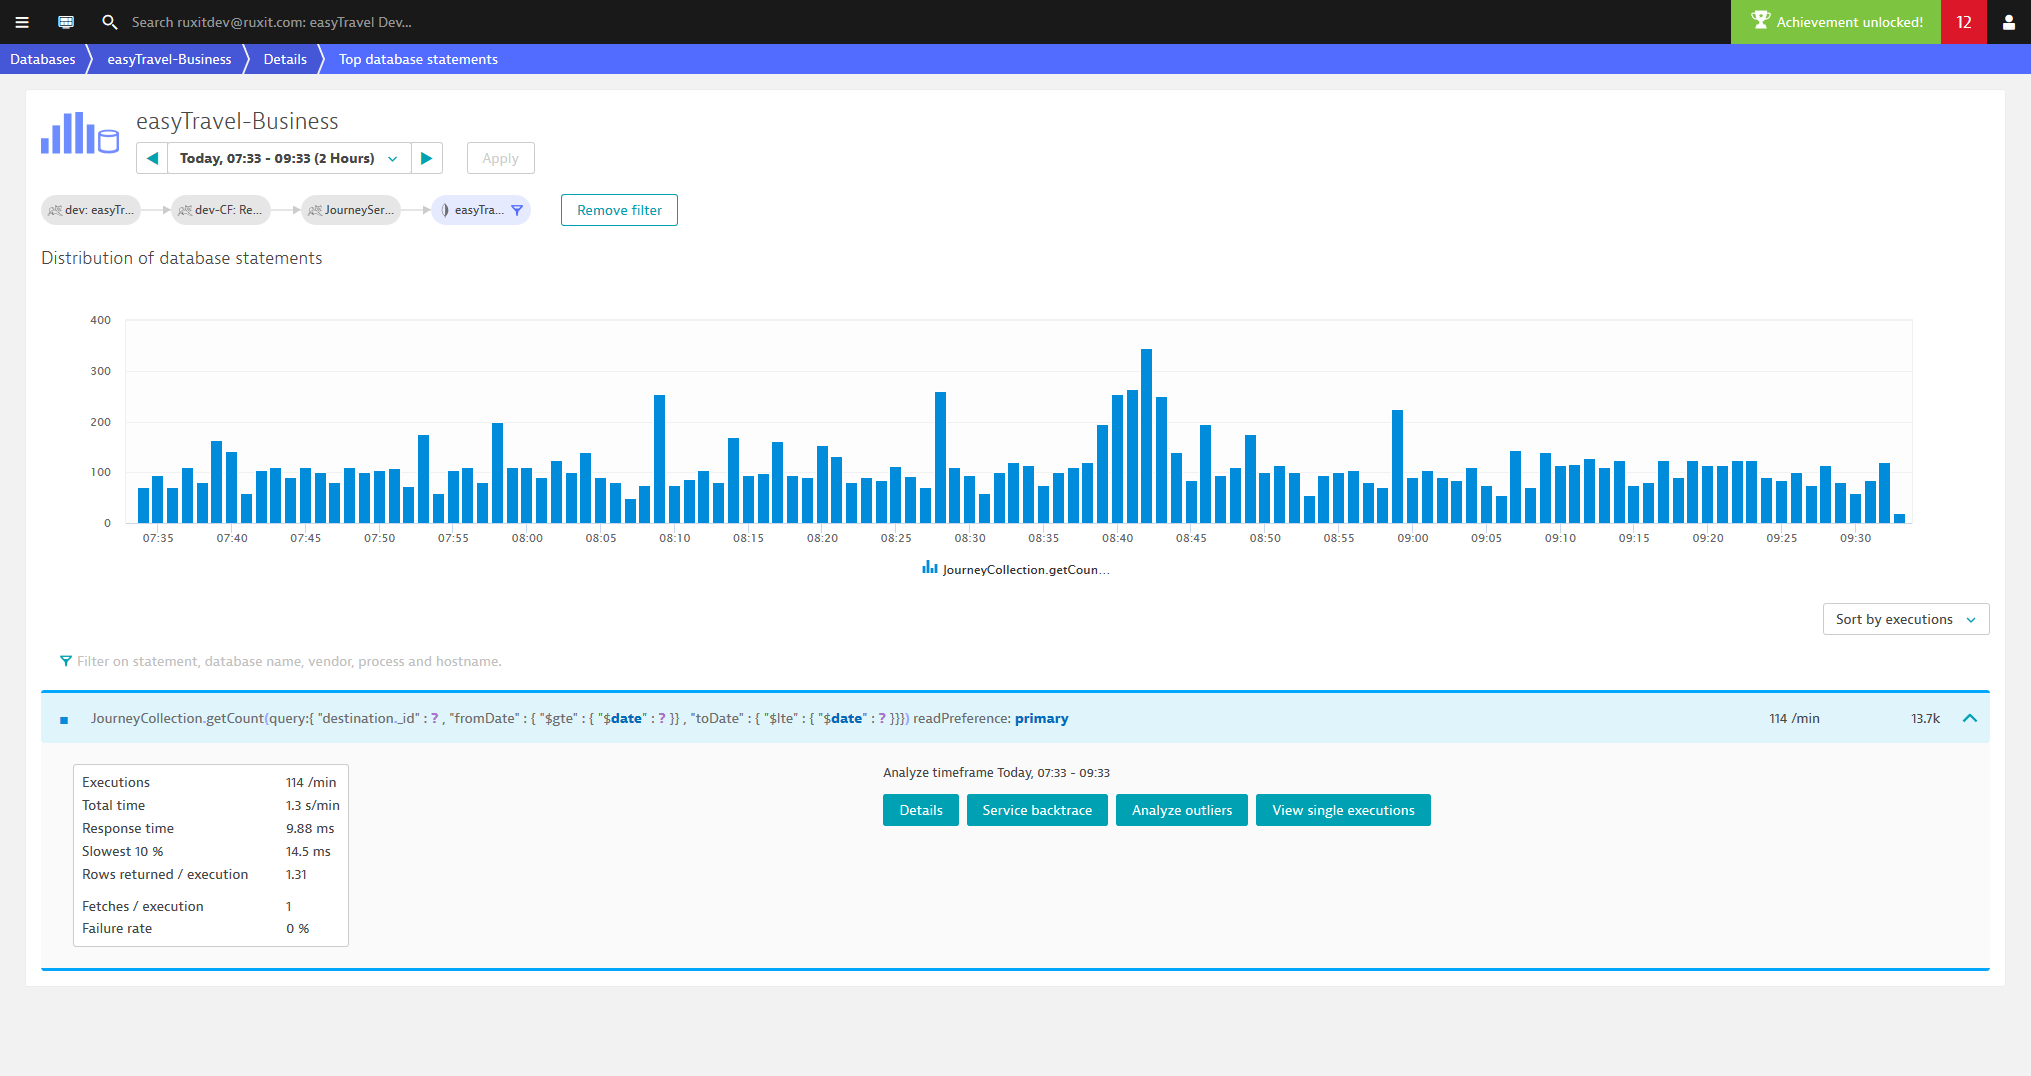
View single executions
To view the individual executions of each command, return to the Top databases statements page (as explained above) and click the View single executions button.
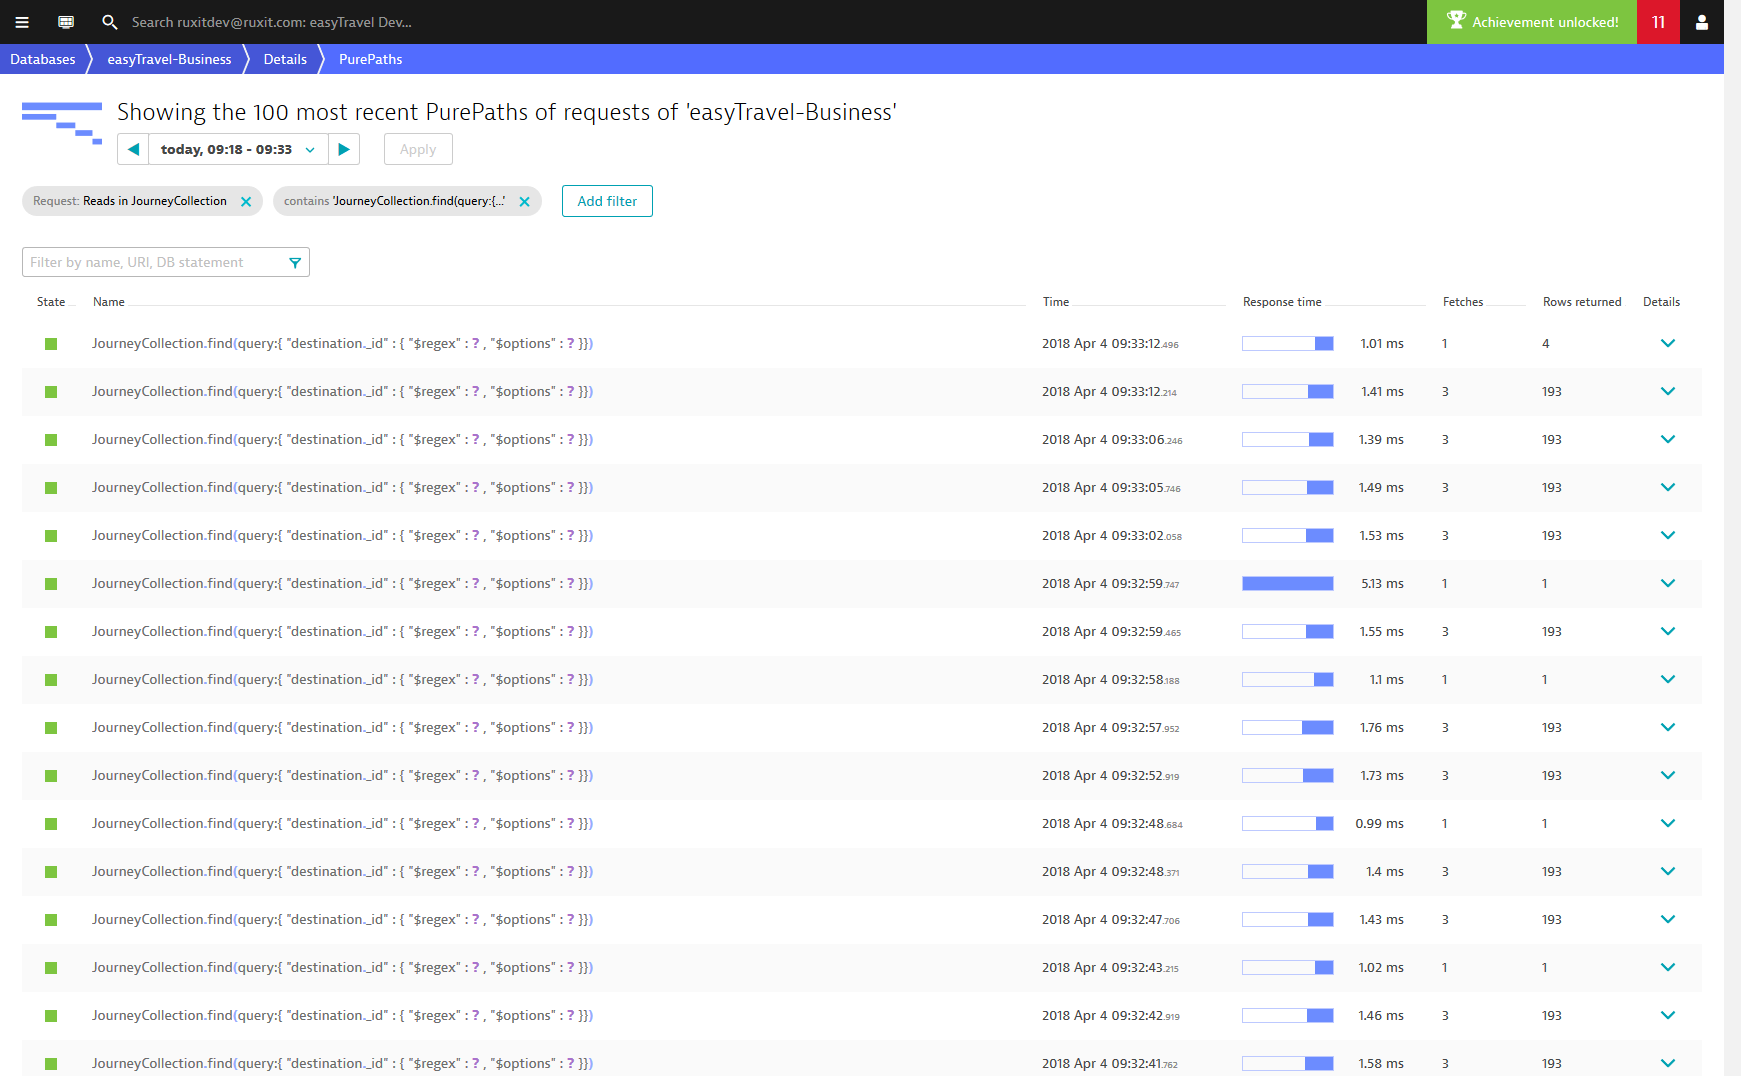
The Fetches column shows the number of database round trips per SQL execution. Because most database drivers page result sets, roundtrips are normally fetched in sets of Rows returned per fetch. Therefore, if a result set has 200 rows and you have a fetch size of 50 rows per fetch, it will take 4 fetches to get all the data. More fetches mean slower response time. However, having too large of a fetch size can also lead to poor memory usage and you typically wouldn't read an entire data set anyway.
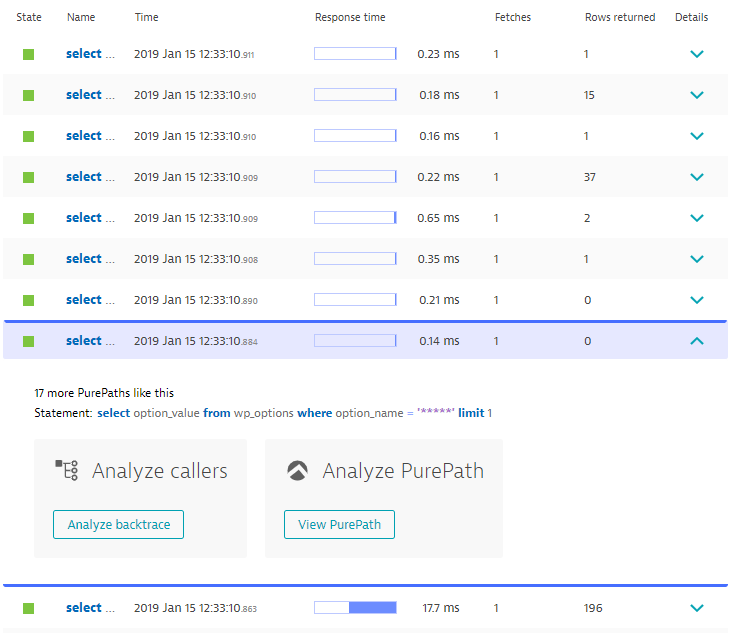
Expand any execution row in the list to access the Analyze PurePath command for that execution, as shown below.
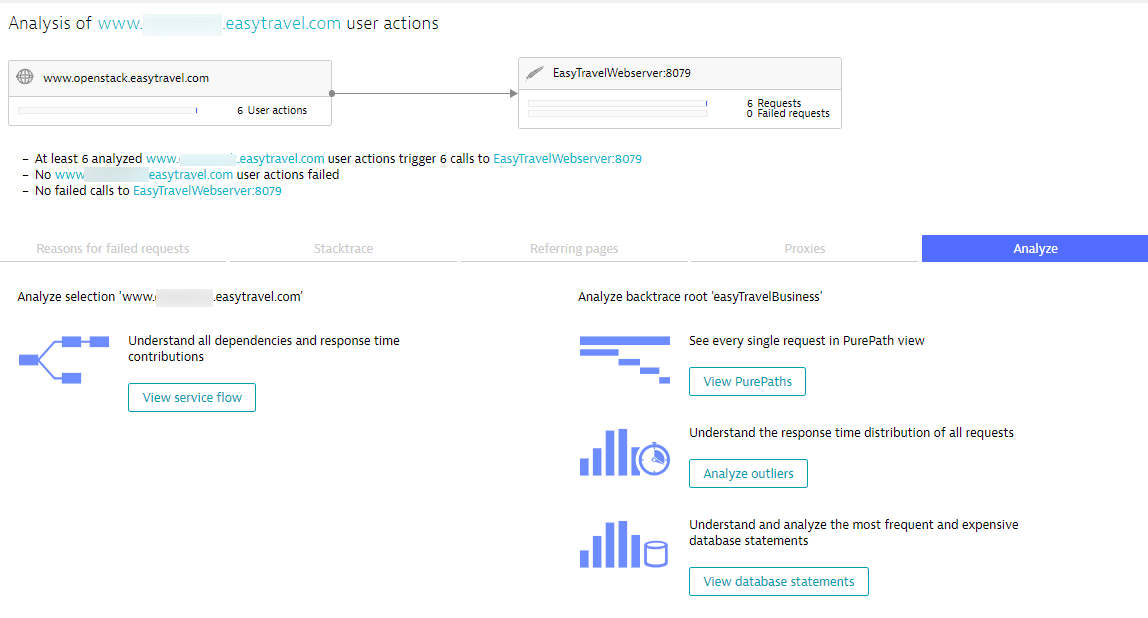
Example: Understand SQL for Service flow
While SQL analysis is available at multiple locations in the service-analysis workflow, it has been added as the primary analysis view for databases in the Service flow view. The following example indicates a service flow that has already been filtered to focus on a particular chain of calls. You can see that, whenever the Customer Frontend service calls the JourneyService, 25% of the response time contribution can be attributed to the EasyTravel-Business MongoDB service.
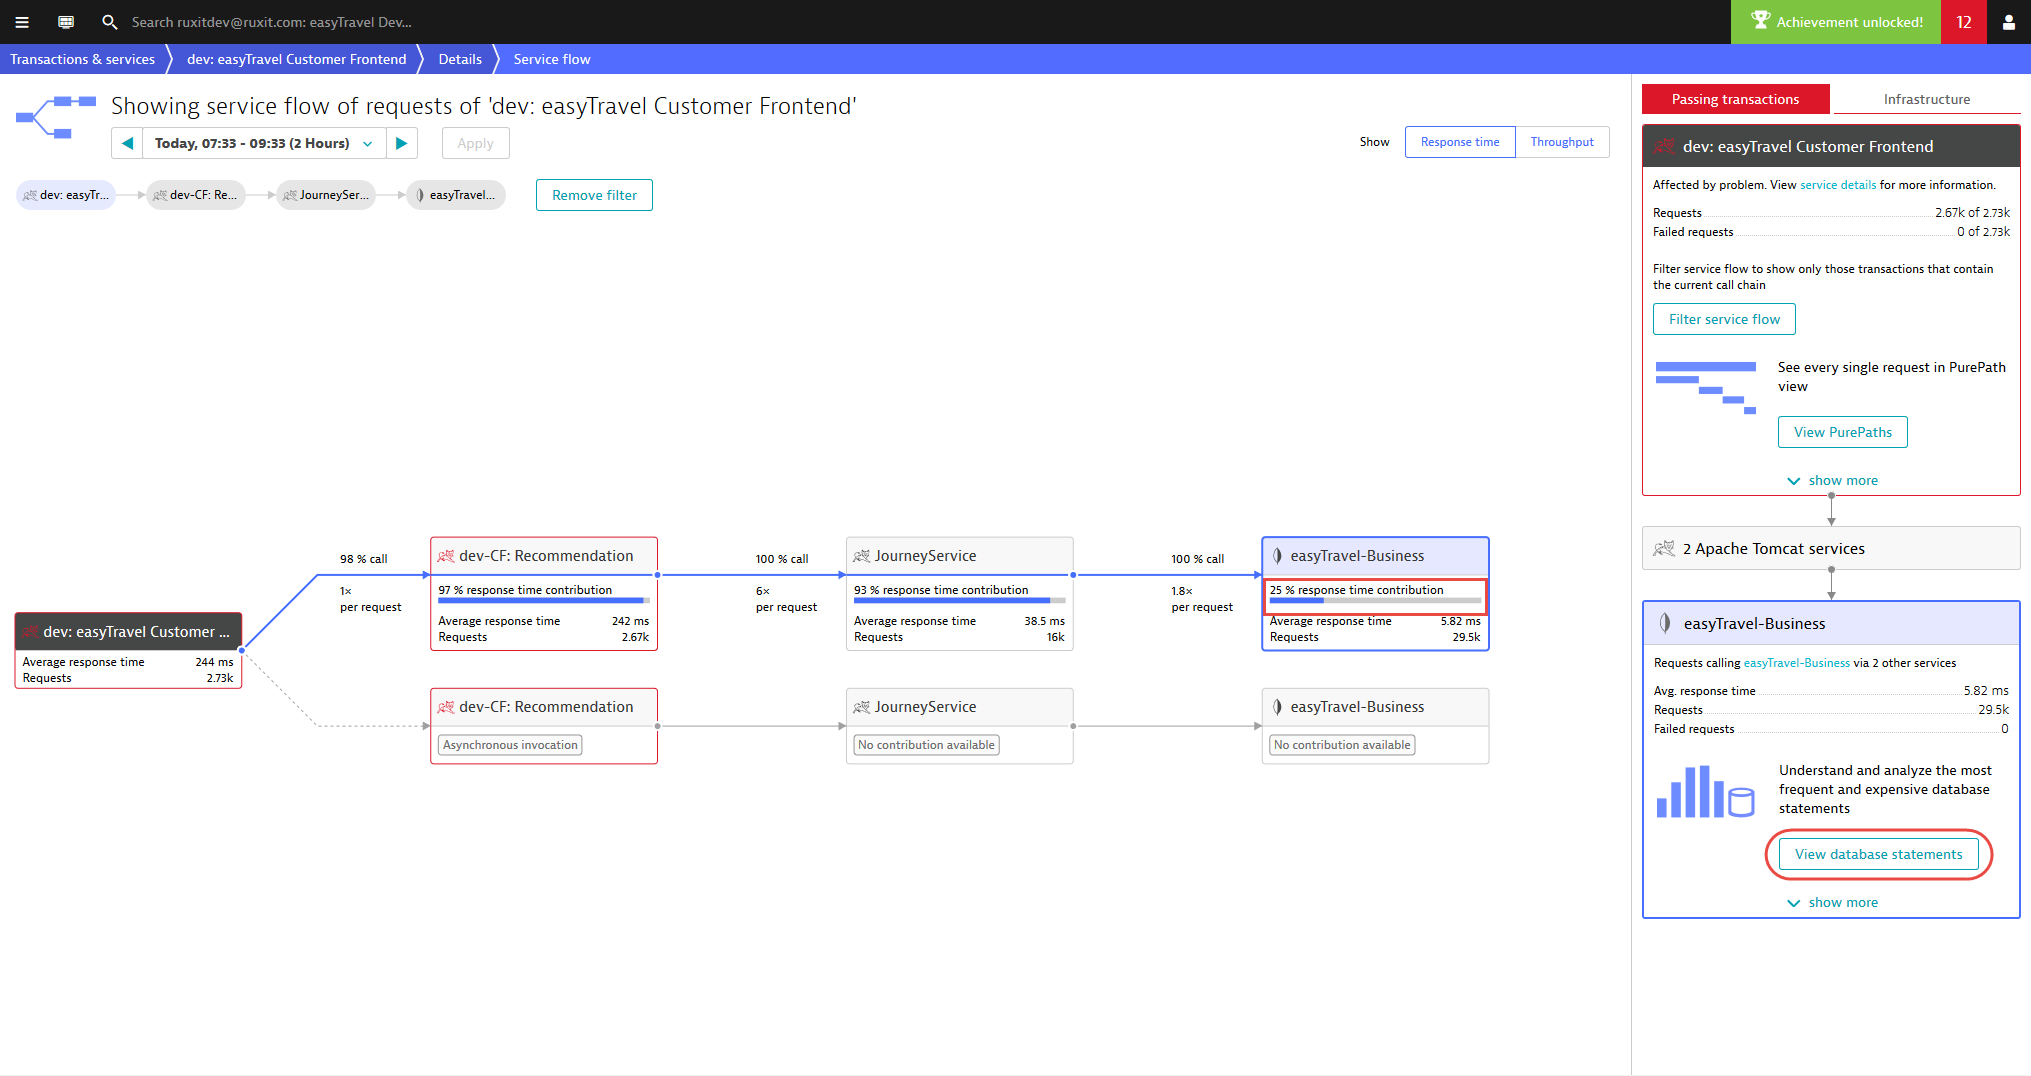
The default action has changed and now displays View database statements.
To further analyze a database statement:
- To see that the database statements that were executed by the selected flow within the analysis time frame, click the View database statements button. This can be tremendously valuable because you can now understand why a database contributes a specified amount of time.
- To reveal which statements have the highest overall response time, select Sort by total time from the Sort drop list.
-
You can perform your analysis in the following ways:
- To understand the spread of response times, click the Analyze outliers button.
- To understand the evolution of each individual SQL statement that undergoes over time along with the average Rows returned count, click Details.
- To understand the spread of response times, click the Analyze outliers button.
-
Click the Service backtrace button to see which user clicks led to the slowest executions of this MongoDB statement.
Using these new database-statement analysis features in conjunction with existing analysis capabilities provides powerful database-usage focused analysis.