A user session (i.e., a user visit) covers any interaction between an individual user’s browser and your applications. A user session includes at least one user action.
While analysis of the sessions of user groups and related cohorts based on aggregate monitoring results and calculated performance averages can be useful in some situations, such analysis is often incomplete. Individual users behave in unexpected ways, perform different tasks with different goals in mind, and reside in different geographic regions using different combinations of devices and browsers.
Effective user-session segmentation is the key to understanding how individual users who share common characteristics experience your application. DESK supports user-session segmentation through a powerful filtering mechanism. DESK user session analysis enables you to slice, dice, and combine your application’s user sessions into meaningful segments based on shared characteristics of individual user sessions (for example, OS, browser type, location, or user tag). For example, you might segment your analysis based on browser type (desktop browser, mobile browser, or synthetic browser). In this way, you can drill deeply into aggregate results to discover meaningful insights into performance problems that may only be experienced by a small subset of your users.
User session segmentation
To analyze user sessions
Select User sessions from the navigation menu.
Click in the text field at the top of the page (see 1 in the example below) and select one of the available filtering attributes. Once you select an attribute, the available values for that filter are displayed in a drop list. Select the attribute value you’re interested in. Some attributes provide text fields into which you can type specific values.
Repeat this process for as many attributes as you are interested in. Once you’ve defined your filter, click somewhere outside the text box.
What filtering attributes are available?
| Attribute category |
Attribute |
Description |
| Application |
Application name |
Select the name of the application you want to analyze. |
|
Application type |
Specify whether you want to analyze the sessions of a web or a mobile application. |
| Browser |
Browser family |
Filter sessions based on the browser that was used (Chrome, Safari, etc). |
|
Browser type |
Filter sessions based on whether they were performed with a desktop, tablet, or mobile browser, or virtually via synthetic tests or robots. |
|
Browser version |
Use this attribute if you want to filter sessions based not only on a specific browser but also on a specific browser version. |
| Location |
City |
Filter sessions based on the city where the sessions originate. |
|
Continent |
Filter sessions based on the continent where the sessions originate. |
|
Country |
Filter sessions based on the country where user sessions originate. |
|
Region |
Filter sessions based on the geographical region where sessions originate. |
| Mobile |
Crashes |
Select Yes or No to filter sessions that have or haven’t experienced a crash. |
|
Device |
Filter sessions based on the type of mobile device used for accessing the application. |
|
Manufacturer |
Filter user sessions based on a specific mobile device manufacturer. |
| Operating system |
OS family |
Filter sessions based on operating system family (Windows, Linus, iOS, etc). |
|
OS version |
Select a specific OS version. |
| Session |
Bounce |
Select Yes or No to filter sessions that either were or weren’t bounced sessions (i.e., sessions that are immediately abandoned). A bounce is a special type of user session comprised of only a single user action. High bounce rates are undesirable. |
|
Conversion goal |
Select a specific conversion goal to examine those user sessions where this goal was achieved. |
|
Converted |
Select Yes or No to analyze those user sessions where the associated conversion goal was or was not achieved. |
|
IPv4 |
Filter sessions based on IP addresses that rely on the IPv4 protocol. |
|
IPv6 |
Filter sessions based on IP addresses that rely on the IPv6 protocol. |
|
ISP |
Filter sessions based on a specific Internet Service Provider. |
|
JavaScript error count |
Specify a range of JavaScript error occurrences. Use this to focus on user sessions that have more than a certain number of JavaScript errors (if you leave the upper bound empty), less or equal to a value (if you leave the lower bound empty), or fall within a specific value range. |
|
JavaScript errors |
Select either Yes or No to explicitly filter sessions that did or didn’t encounter JavaScript errors. (Note: JavaScript error details are only stored for 10 days.) |
|
Screen resolution |
Filter user sessions based on a specific screen resolution. |
|
Session duration |
Specify a time interval in minutes. Use this to filter sessions that have a duration longer than or equal to a value (if you leave the upper bound empty), shorter than or equal to a value (if you leave the lower bound empty), or fall within a specific value range. |
|
User tag |
Select a user tag to analyze the sessions of a specific user. |
|
User type |
Choose whether you want to analyze user sessions of robots, synthetic users, or real users. |
|
Users |
Filter user sessions based on whether users are new or returning users. |
| User action |
User action count |
Specify a range of integers that represent the number of user actions performed within one session. This can help you to identify, for example, sessions that have a high number of actions. |
|
User action duration |
Specify a time interval in minutes. Use this to filter sessions that have at least one user action with duration longer than or equal to a value (if you leave the upper bound empty), shorter than or equal to a value (if you leave the lower bound empty), or fall within a specific value range. |
|
User action name |
Specify a user action so that you can analyze all sessions that include at least one instance of that action. |
Select a user session attribute around which you want to have the results charted, for example, location, JavaScript error count, or browser type (see 2 in the example below).
What charting options are available?
| Charting dimension |
Description |
| Application |
Renders a bar chart with the different applications depicted along the X-axis and the number of user sessions along the Y-axis. Hold your cursor over a specific bar to view the exact number of user sessions within that category. |
| Browser |
Renders a pie chart divided into the following categories: Desktop, Tablet mobile, Synthetic, and Robots. Click on a category to view details of the browser family. |
| Bounce |
Renders a bar chart with the values No and Yes on the X-axis and the number of user sessions along the Y-axis. Hold your cursor over a specific bar to view the exact number of user sessions within that category. |
| Converted |
Renders a bar chart with the values No and Yes on the X-axis and the number of user sessions along the Y-axis. Hold your cursor over a specific bar to view the exact number of user sessions in that category. |
| Conversion goals |
Renders a bar chart with the different conversion goals depicted along the X-axis and the number of user sessions along the Y-axis. Hold your cursor over a specific bar to view the exact number of user sessions in that category. |
| Browser type |
Renders a bar chart with the values Desktop, Tablet mobile, Synthetic, and Robots depicted along the X-axis and the number of user sessions along the Y-axis. Hold your cursor over a specific bar to view the exact number of user sessions in that category. |
| JavaScript error count |
Renders a bar chart with integers representing the number of JavaScript errors depicted along the X-axis and the number of user sessions along the Y-axis. Hold your cursor over a specific bar to view the exact number of user sessions in that category. |
| Location |
Renders a world map with the filtered locations colored with different shades of purple that indicate the number of user sessions. The darker shades signify areas with the largest number of sessions. Hold your cursor over a specific bar to view the name of that region as well as the number of sessions that occurred there. |
| ISP |
Renders a bar chart with the different ISPs depicted along the X-axis and the number of user sessions along the Y-axis. Hold your cursor over a specific bar to view the number of sessions in that category. |
| OS |
Renders a pie chart that’s divided based on operating system. Click a part of the pie chart that corresponds to a specific operating system to view fine-grained detail about the different versions of the specific operating system. |
| Time |
Renders a bar chart with time depicted along the X-axis and the number of user sessions along the Y-axis. You can choose among different time resolutions depending on the selected timeframe. For a timeframe of the last 2 hours, you can choose among 5 min, 15 min, 30 min, and 1 h resolution. If you select a timeframe of the last 30 days, the available time resolution options are 1 hour, 2 hours, 6 hours, 1 day, and 1 week. Hold your cursor over a specific bar to view the number of sessions within that category. |
| Hour |
Renders a 24-hour clock chart depicting the top 3 hourly intervals that included the most sessions. Darker shades of purple indicate intervals with higher numbers of sessions. |
| Screen resolution |
Renders a bar chart with the different screen resolutions depicted along the X-axis and the number of user sessions along the Y-axis. Hold your cursor over a specific bar to view the number of sessions within that category. |
| User action count |
Renders a bar chart with integers representing number of user actions depicted along the X-axis and the number of user sessions along the Y-axis. Hold your cursor over a specific bar to view the number of sessions within that category. |
| Users |
Renders a bar chart with the values Returning users and New users on the X-axis and the number of user sessions along the Y-axis. Hold your cursor over a specific bar to view the number of sessions within that category. |
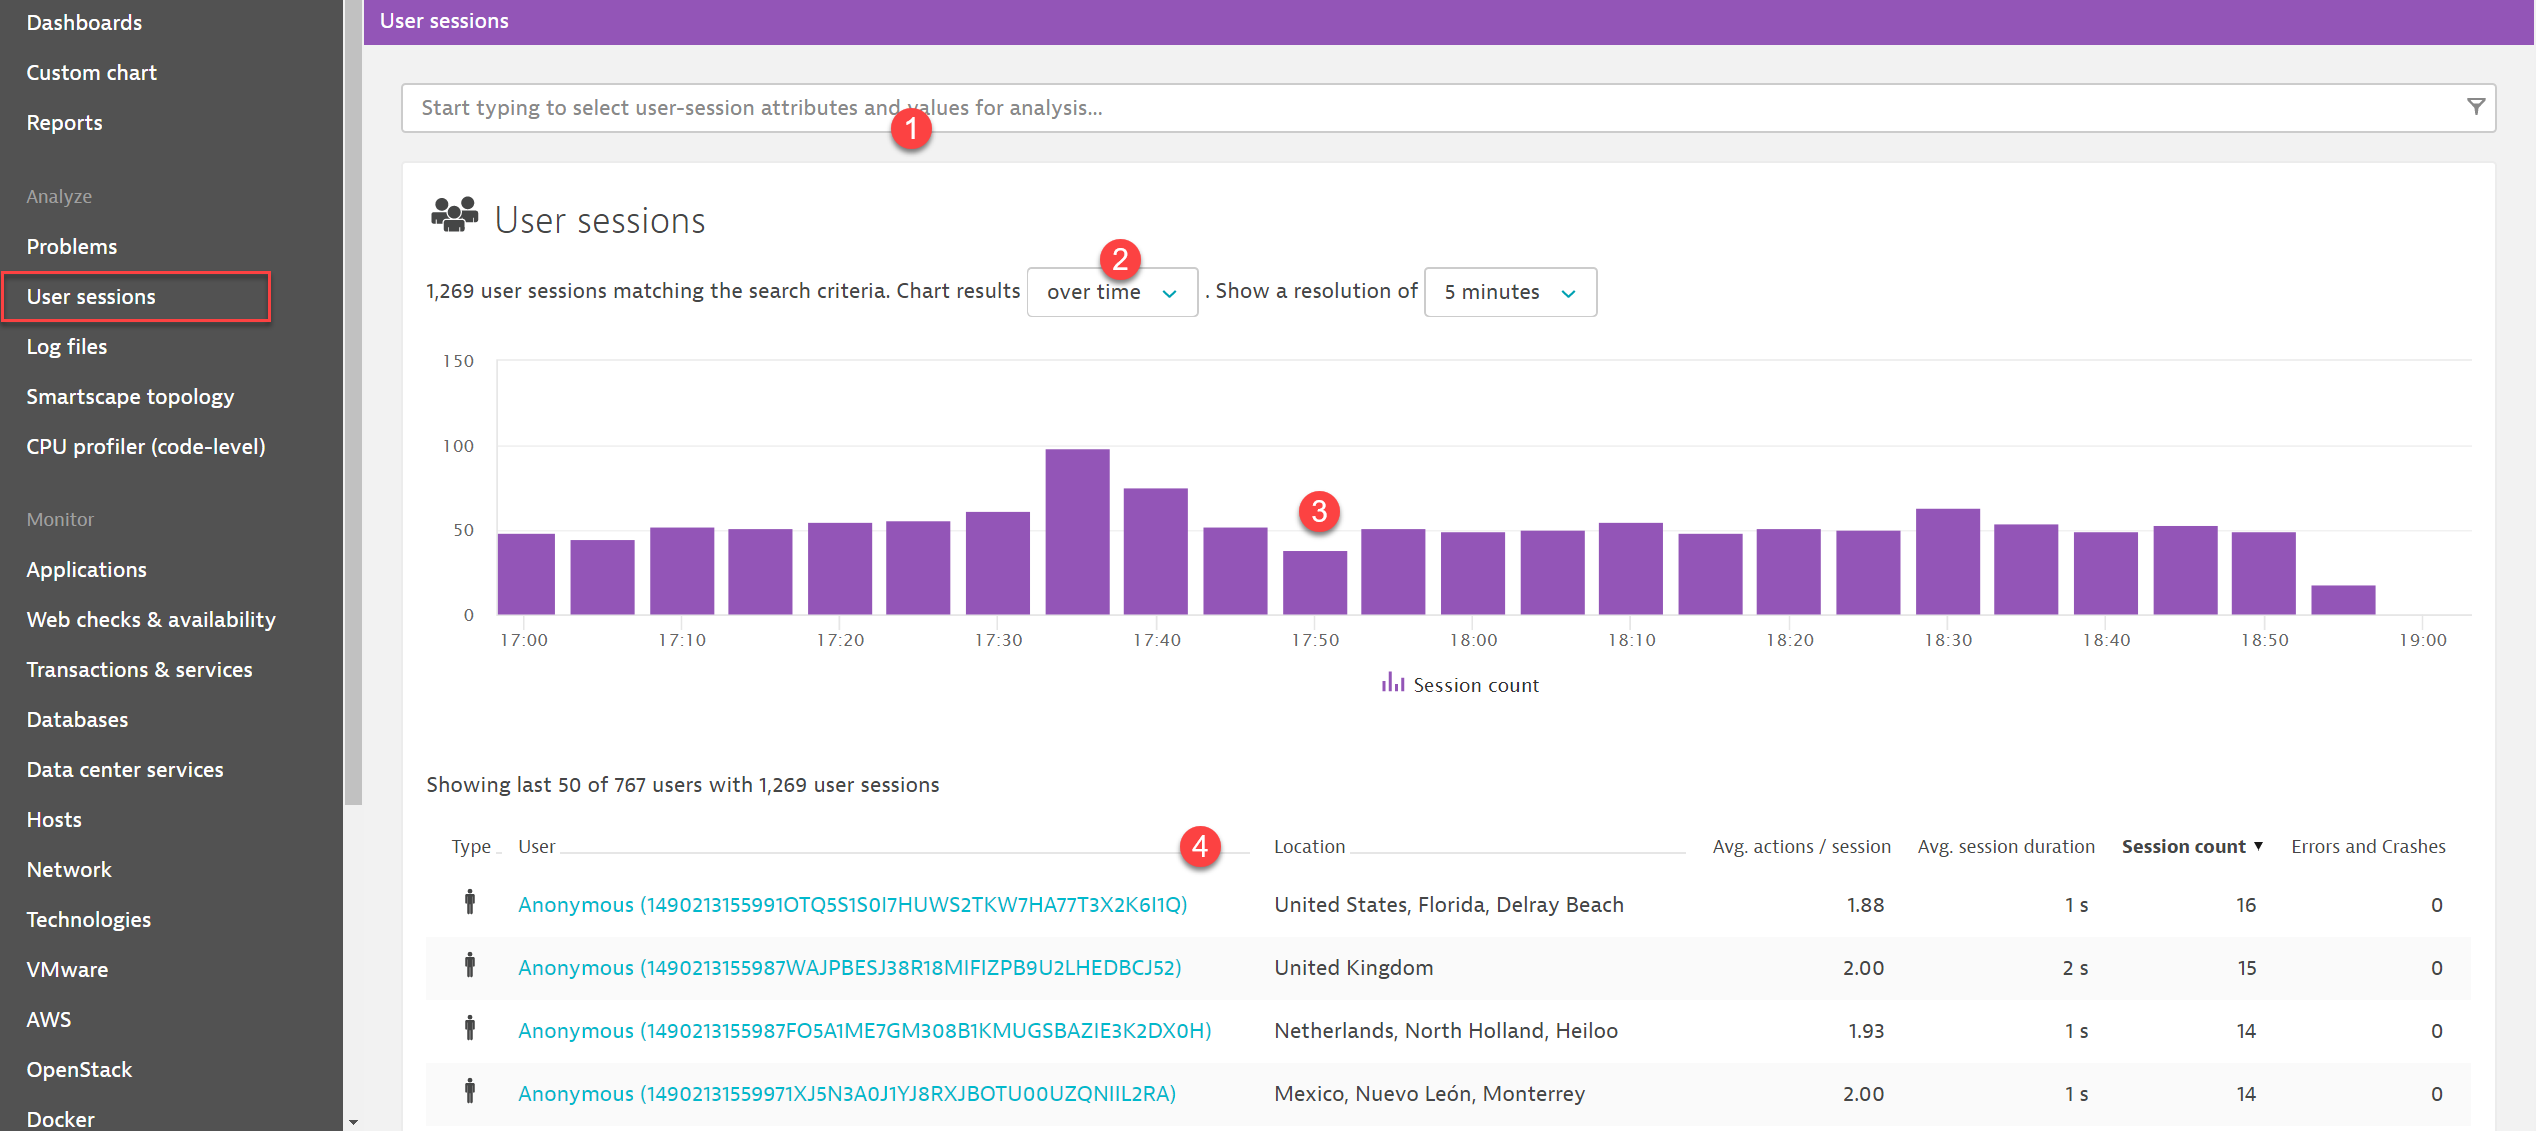
The results of your analysis are displayed in a clickable chart (see 3 in the image above). You can click any bar in the chart to focus your analysis on that subset of monitoring results (i.e, a specific increment of time, a specific browser type, or other value).
While the chart displays data for all user sessions that match the defined filter, the top user list (see 4 in the image above) shows data for only the top 100 users (i.e., those users who have initiated the most user sessions). The columns in the top user section are sortable. This enables you to, for example, sort the results based on Avg. session duration to see which users spent the most and least amount of time using your application. To analyze the sessions of a single user, click a username and navigate to that user's overview page.
What sortable attributes are available for top users?
| Attribute |
Description |
| Type |
Indicates whether a user is a real user, a synthetic browser, or a robot. |
| User |
Since users aren’t identified by default, each user is named in the top user list as Anonymous followed by a random ID. However, when user tags are defined for specific users, those users are identified based on their user tags. |
| Location |
Shows the list of places where the user sessions occurred. |
| Avg. actions/session |
States the average number of actions that a user performed during their sessions. |
| Avg. session duration |
Shows the average duration of a user’s sessions. |
| Session count |
States the total number of sessions performed by a user. |
| Errors and crashes |
Displays the number of errors or crashes that a user has experienced across all their sessions. |
Note that whenever a filter changes or a specific part on the chart is selected, the top user list is accordingly updated to reflect the top users belonging to the respective segment created through the definition of the specific filter as well as the selection of the corresponding chart section (in case a specific chart section has been clicked). At any time, the defined filter, the chart and the top user list are in absolute alignment.
Note: The timeframe selector (available in the menu bar) enables you to adjust the analysis timeframe of your user-session analysis.
Examples
Here are some indicative examples, showing how you can glean insights into your users' behavior through the DESK user session analysis feature.
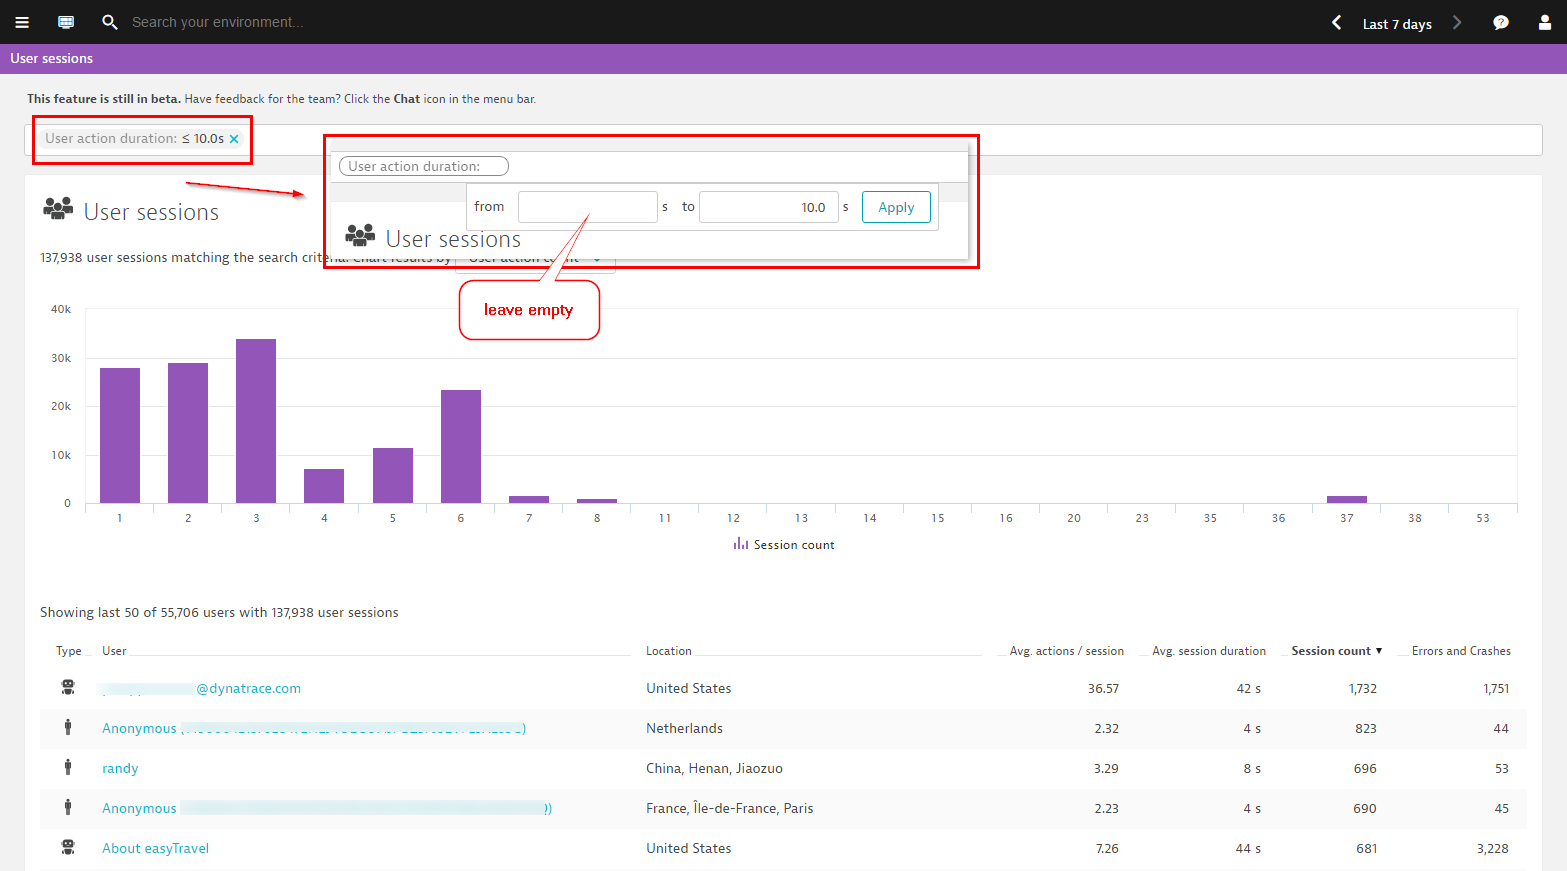
Filter user sessions based on user action duration
You can filter user sessions that have at least one user action with duration faster, within, or slower than a given value or value range. The example below filters user sessions that have at least one action that lasted up to 10 seconds.
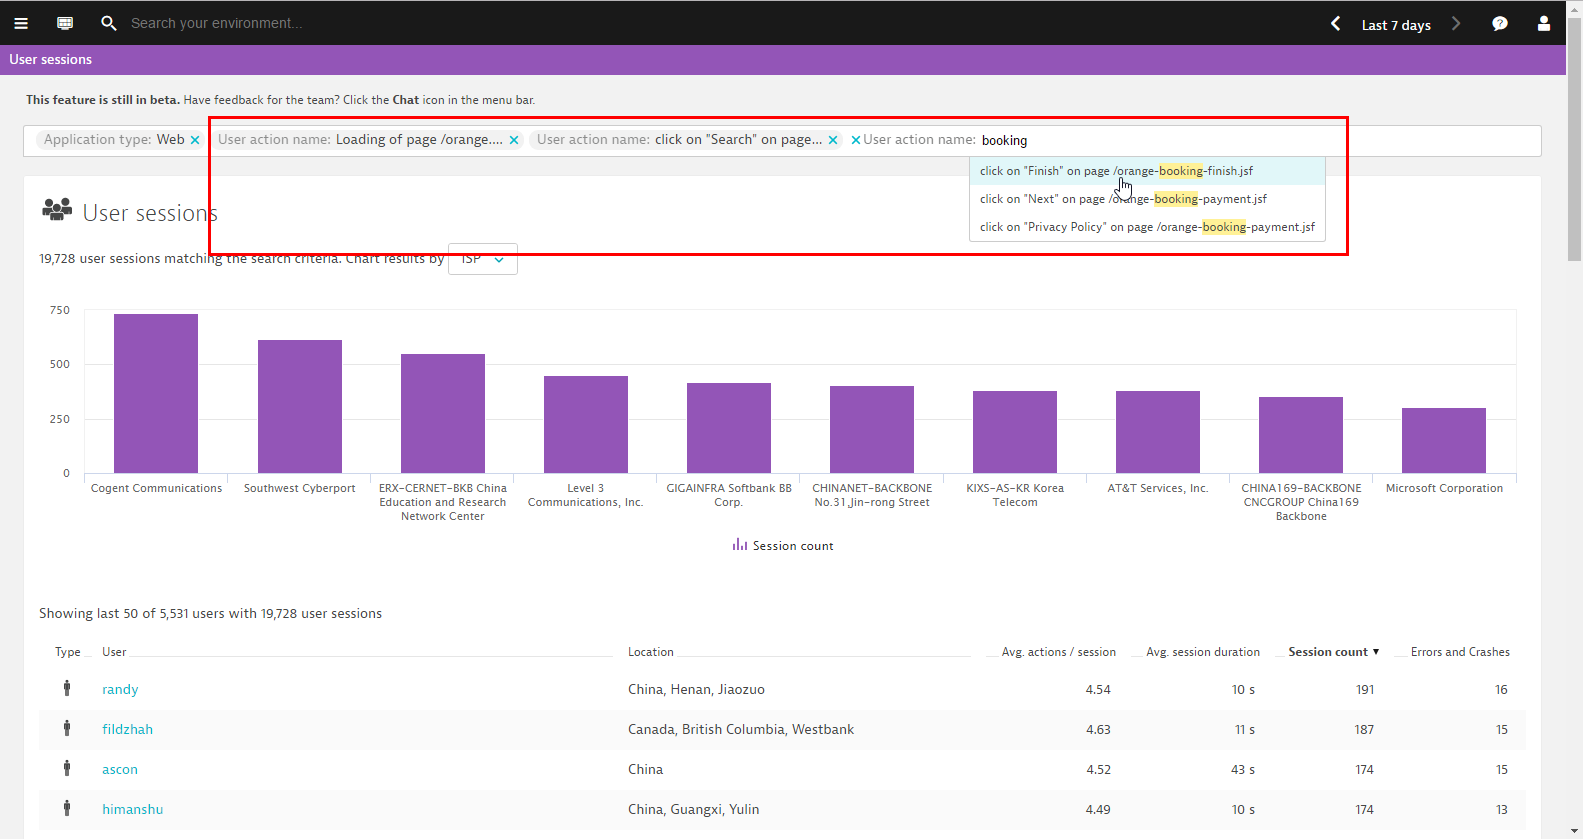
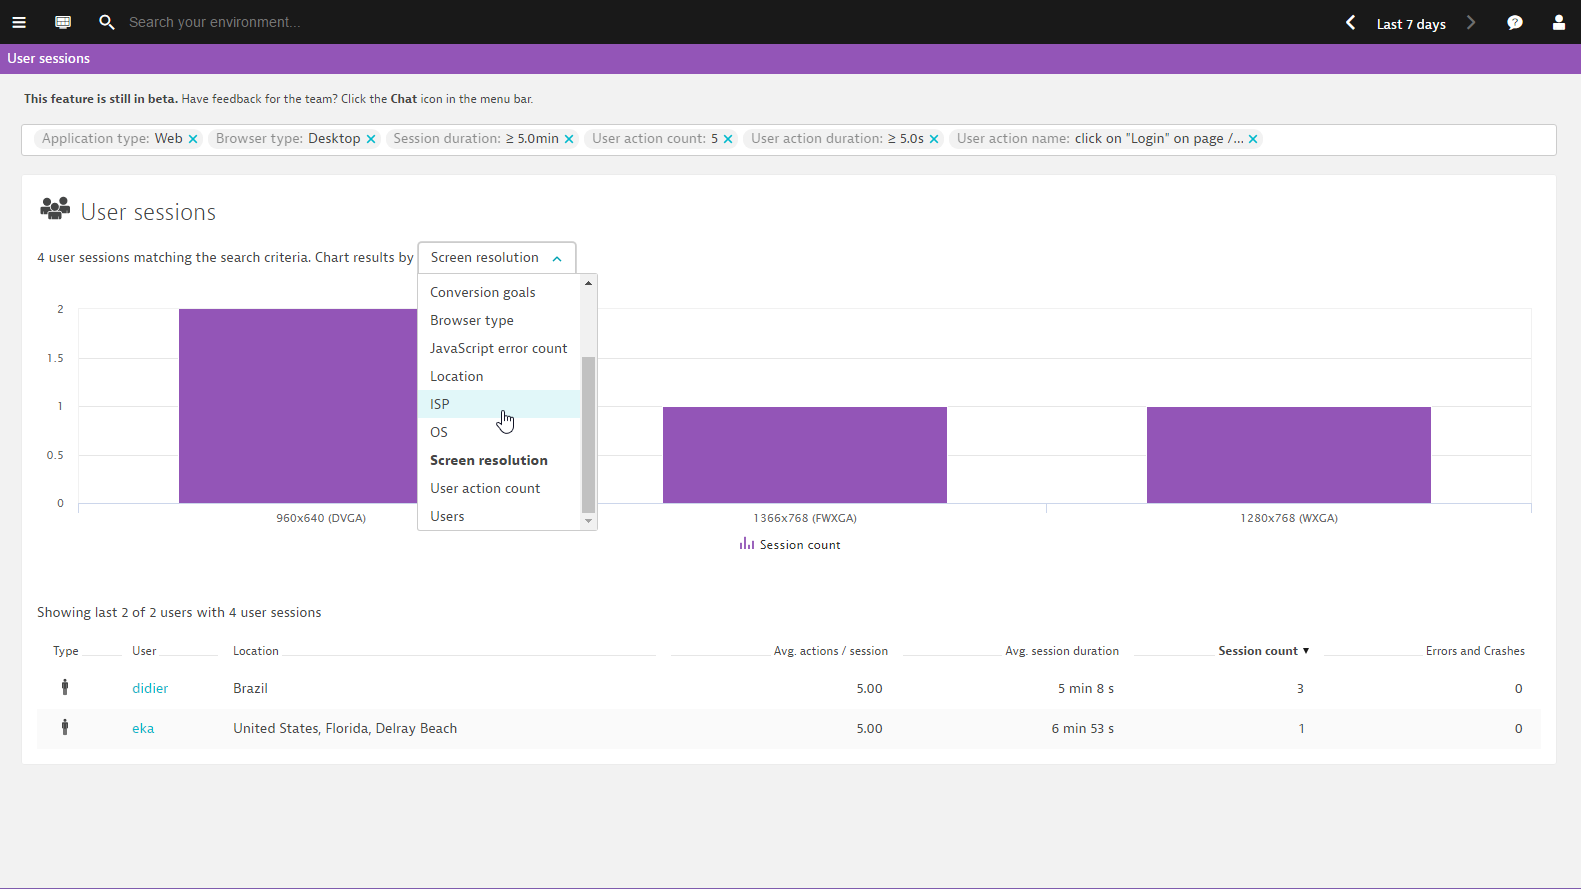
Create complex filters
The example below shows a search for user sessions that are accessed via a web application on a desktop browser and have session duration longer than 5 minutes. Further, the number of user actions for these user sessions must be 5 and there must be at least 1 user action longer than 5 seconds. Also, a user action called click on “Login” on page /orange.jsf must occur in the user session for the session to be a match.
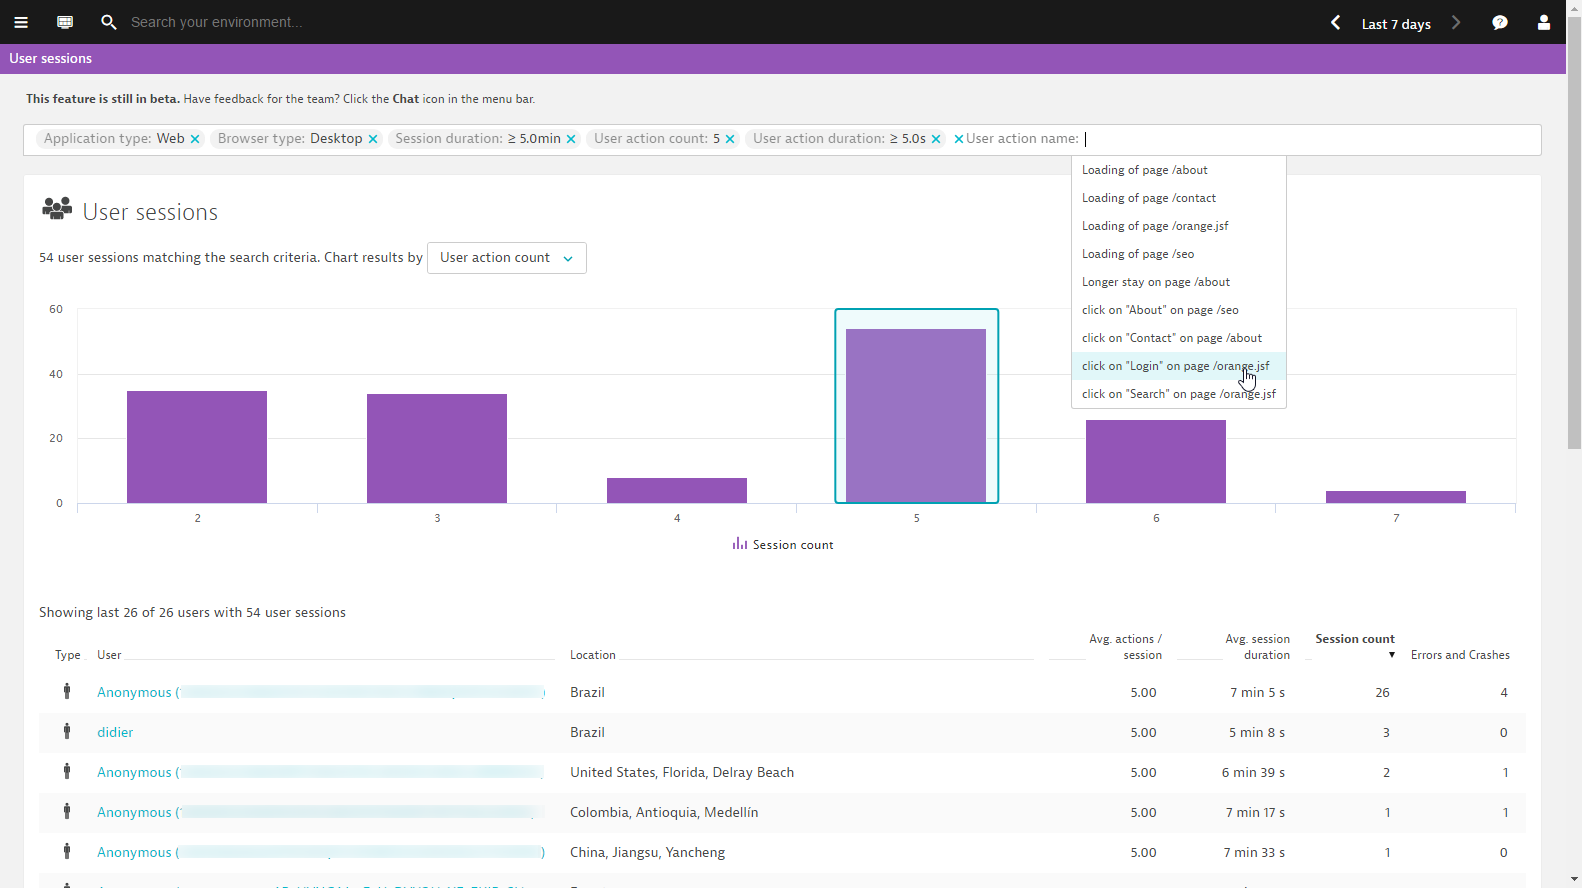
You can then chart the results based on different criteria.
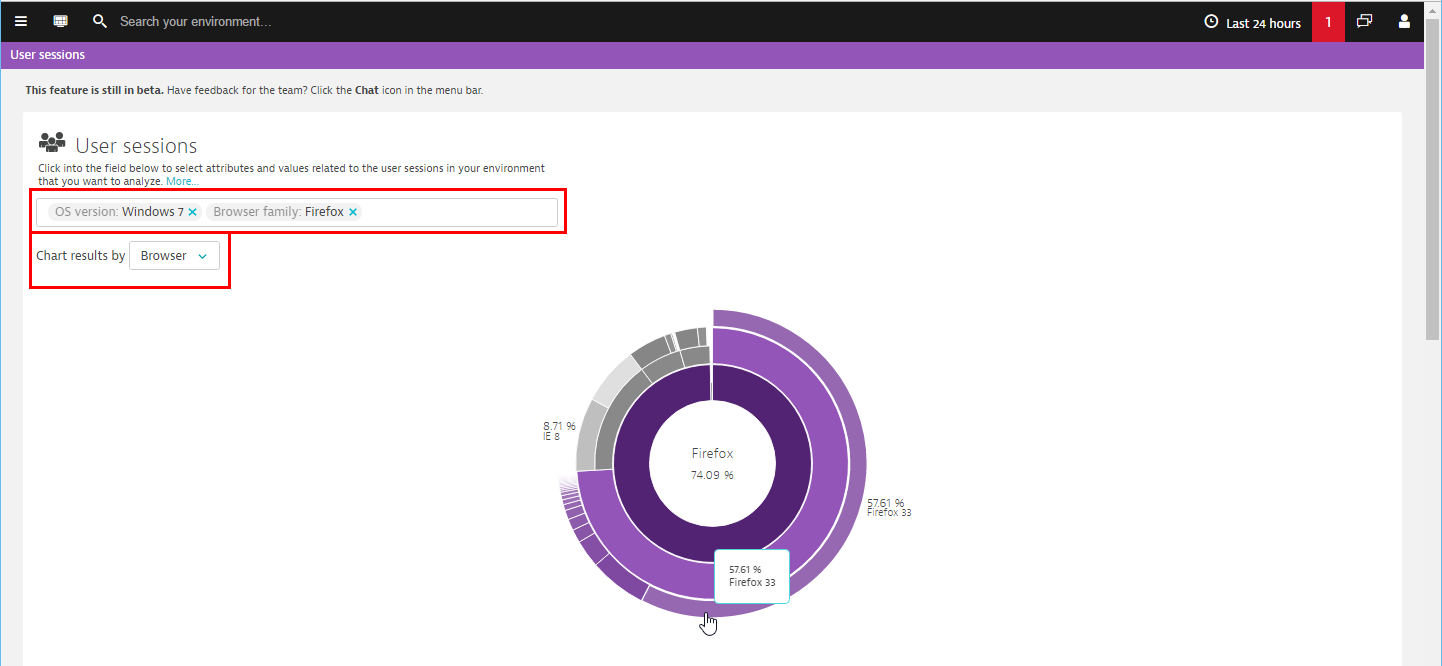
Focus on specific user profiles
In the example below, the returned results include only those users who have the Windows operating system and a Firefox v33 browser.