Configure browser monitors
DESK allows you to configure your browser monitors easily when first setting them up and at any time thereafter.
During browser monitor creation (single-URL or clickpath), configuration settings appear after you have clicked Create a browser monitor. These settings are a subset of the full set available in edit mode (described below) after the monitor has been deployed. For example, you can only set performance or availability thresholds after monitor creation.
To configure/edit an existing single-URL browser monitor or browser clickpath:
-
Select Synthetic from the navigation menu.
-
Click the browser monitor you want to configure.
-
Click the Browse button (...) and select Edit. You can also navigate to the Synthetic dashboard, check the monitor you wish to edit, and select Edit at bottom right.
-
Click through the Monitor settings tabs on the left to configure the available settings (explanations below—a subset of these settings are available when you first set up a monitor).
-
Click Save changes at bottom right when done editing your monitor.
Monitor setup
Specify the Monitor name. The name is limited to 500 characters.
Define device emulation settings
Emulated device properties are the Device profile/type, orientation, Screen size, Bandwidth, and User agent.
The default device profile is Desktop.
- For mobile device profiles (including tablets), you can select an orientation and bandwidth. The User agent is auto-selected but can be changed.
- For a Custom device, specify if the device is a Mobile device and select the orientation, Bandwidth, and Screen size. This profile uses the default DESK user agent, which can be changed.
- For desktop and laptop profiles, you can choose Bandwidth. These profiles use the default DESK user agent.
Select a key performance metric for this monitor
This setting is available in edit mode only.
You can choose one key performance metric for each load action and XHR action included in a browser monitor or clickpath.
Key performance metrics enable you to choose performance goals that best fit the variable needs of each application you monitor. For example, you might want to choose User action duration to optimize the performance of a traditional web application. For other applications where the speed of user interaction is more important than the UI, you might want to optimize the time it takes for JavaScript resources to load. The default is Visually complete for both load and XHR actions as it measures how long it takes for the visible portion of each user’s browser screen to be fully rendered.
As DESK captures a list of key performance metrics out of the box, you can switch your selection in monitor settings and immediately have historical data available.

The key performance metric is calculated and displayed as an average in the Synthetic details page in the performance visualizations and in the Synthetic events and actions card.
Assign a synthetic monitor to a web application
This setting is available in edit mode only.
If this synthetic monitor is associated with one of your monitored web applications, you can assign the monitor to the application so you can track application availability and performance. Detected problems are then automatically associated with your application. If monitor status is unavailable, the associated application is also considered unavailable.
Click Assign monitor to application and select an application from the drop-down list. You can assign a monitor to multiple applications, and an application can have several assigned monitors. Click Connect another application to add an additional application.
Recorded clickpath
You can edit a recorded clickpath.
Select Record again to re-record your clickpath. You can also perform local playback by clicking Play back clickpath so you can verify that your recorded clickpath plays back as expected.
Local playback in DESK is in emulation mode, based on the device profile and user agent you select during monitor configuration. That is, playback emulates your chosen device. If you navigate to the same URL or perform the same transaction outside DESK, your experience might vary.
You aren't limited to just one mode to view and edit your clickpath—you can switch back and forth between the UI and script modes by clicking the Clickpath/Script switch. For details on editing your clickpath in JSON format, see Script mode for browser monitor configuration.
In visual/UI mode, you can avail of these controls to edit events in your script:
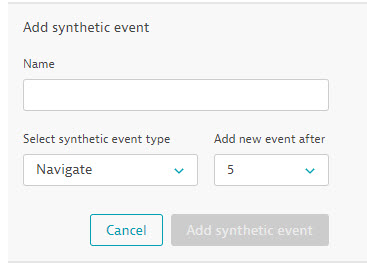
If necessary, you can delete unnecessary events from your clickpath by clicking x under Delete for the respective event. You can also add events—click Add synthetic event. Specify a name and the event it should follow.
Although we do our best to name events intuitively, you can edit event names as required—simply click in the field provided for each event name.
In addition, you can configure each individual event by hovering over it and clicking when your cursor changes to a finger pointer. From here, you can delete the event by clicking Delete synthetic event. Note that the initial Navigate event of a clickpath can't be deleted.

The fields available to edit depend on the event type—see Browser clickpath events for detailed descriptions. When you are done editing, click Close details.

A clickpath event is not the same thing as an action. See Number of actions consumed by browser clickpaths for details.
Frequency and locations
There are two factors that make up your monitoring schedule—how frequently your browser monitor runs and which locations it is executed from. The frequency and number of locations determine the number of runs each hour. For example, running a monitor from 3 locations every 15 minutes results in 12 executions per hour. Browser monitors are evenly spaced, running at 5-minute intervals.
You can choose a frequency of every 5, 10, 15, 30, or 60 minutes. You can also select multiple global locations from where your browser monitor is to be executed.
Validate content
For single-URL browser monitors, this tab appears in Monitor settings and is only available in edit mode.
For browser clickpaths, you can set up validation by selecting Recorded clickpath from the Monitor settings menu on the left. Click an event from the displayed event list to add validation for it. You can also set up validation to captured events during the recording workflow.
Content validation helps to verify that your browser monitor loads the expected page content or element. Validations are performed through validation rules—click Add custom content validation to define a validation rule.
In browser clickpaths, you define validations for each event; for single-URL monitors, you define validation for the monitor as a whole as they each contain a single event. You can define as many validation rules for an event/monitor as you want.
You can validate based on specific text on a web page, a specific element, or text included within an element. You can opt to pass or fail your monitor/event based on your validation criteria. If pass criteria are not met (or fail criteria are met), the monitor/event fails and the execution is aborted.
All validation is performed after following all redirects, even if the very first response delivers HTML content.
You can add more than one validation to an event/monitor. If you have defined multiple validation rules, you can reorder and delete rules as required.

If your validation is based on content (contains text) or the markup for an element (contains text in element), you must provide the text string (Specify text). Optionally, you can specify text as a regular expression (Evaluate as regular expression). You can also specify the tab (Target window) in which the element should be found.
If your validation searches for an element (contains element) or the markup text for an element (contains text in element), you must specify the CSS Selector or DOM locators to use during replay—click Add locator, then select DOM or CSS, and provide the locator reference. You can add as many locators as you like.

You can play back your single-URL browser monitor from here (Play back monitor). See local playback above
Outage handling
This setting is available in edit mode only.
These options determine what to do in the event of availability outages. You can disable both settings, which may be useful if you're testing a volatile site or you have scheduled downtime that you don't want to be alerted about.
-
Generate a problem and send an alert when this monitor is unavailable at all configured locations
With newly created browser monitors, this is enabled by default. It alerts you of a global availability outage when all locations experience an outage simultaneously. -
Generate a problem and send an alert when this monitor is unavailable for one or more consecutive runs at any location
This allows you to raise a problem when there are consecutive failures at one or more locations.In the example below, a monitor is configured for
4locations, and a problem will be generated if3of those4locations are unable to access your site during two or more consecutive runs.
Single-URL browser monitors and browser clickpaths automatically have free retry on error from the same location—DESK automatically retries a monitor when there is any kind of error. If there is a subsequent success, the initial error data point is discarded.
Retry on error occurs regardless of your availability thresholds.
The retry does not consume additional DEM units.
Performance thresholds
This setting is available in edit mode only.
Performance thresholds enable you to be proactive about site latency. When enabled, simply enter a performance threshold in seconds for single-URL browser monitors. You can see the 24-hour average performance up until that point to help you set a threshold.
In the case of browser clickpaths, click Add threshold to set thresholds for the monitor as a whole and/or individual actions.
DESK generates a problem if the monitor any of the performance thresholds in 3 of the 5 most recent executions, unless there is an open maintenance window for the monitor. The problem is closed if the performance thresholds are not violated in the 5 most recent executions.
You can delete or edit your performance thresholds at any time.

Monitor scripts
This tab appears for single-URL browser monitors and contains the script code of the monitor in JSON format. You can edit the script directly in the DESK Portal or Download the script to edit in a text editor of your choice. For details, see Script mode for browser monitor configuration.
Advanced setup
This tab contains controls for HTTP headers, request blocking, cookies, and in the case of single-URL browser monitors, login automation. During the creation of single-URL browser monitors or clickpaths, these controls are listed as Additional options for monitor configuration.
Automate login
DESK makes it easy to automate the login process for password-protected pages. This is achieved with DESK LoginSense TM technology, which enables intelligent and secure login to your web application each time a browser monitor runs.
Toggle Automate login (disabled by default) to automate logging in. If your web application requires authentication either via a web form or an HTTP authentication scheme, select Web form or Basic authentication respectively and enter credentials.
This setting is available for single-URL browser monitors. For browser clickpaths, login automation doesn't appear within Advanced setup. Only basic authentication is available for clickpaths and is included in the properties of the Navigate event.
Enable additional HTTP Headers
The monitor is created with a bare minimum set of headers required by the protocol. To enable custom headers:
- Select Set additional HTTP headers.
- Click Add header.
- Enter a Header name and Header value.
- Click Add another header as needed.
You can specify multiple HTTP headers. They will be set for all requests the monitor makes.
If you want to set headers only for specific requests, check Only apply headers to requests matching a pattern and then define a Pattern. After that, the header is only set for requests that match the pattern you’ve defined.

Block specific requests
You can block one or more requests by specifying complete URLs or match patterns. Blocking requests allows you to analyze how these requests affect your application's performance and optimize it accordingly.
Enable Block specific requests. You can then provide the complete URL as shown below.

You can also define patterns, for example, *://*/*.png to block all requests to PNG images.
Matching requests are blocked throughout monitor execution and aren’t dependent on events.
Set cookies
Cookies enable you to store browser state information on the client side so that each monitor execution is based on the same state and you can accurately monitor a performance baseline.
You can set cookies in Additional options when creating a browser monitor or in Advanced setup in edit mode. These cookies are valid for the entire monitor execution. If you want to set cookies only for a specific portion of your clickpath, you can use the Cookie event.
Click Add cookie. Then provide a Name and cookie Value. Every cookie must be unique within the list.
The following symbols are not allowed in the cookie value: ;,\". Provide the Domain of the cookie, and optionally, the Path to the cookie.
