Availability events
This page provides information about supported availability events, along with the logic behind raising them.
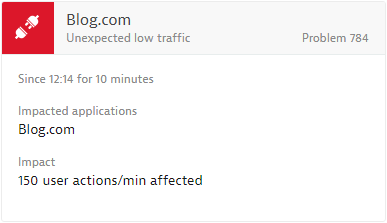
Unexpected low traffic
UNEXPECTED_LOW_LOAD
DESK collects a multidimensional baseline for application and user action traffic and therefore learns the typical traffic pattern of all your applications and user actions. Alerting on abnormally low application traffic is enabled by default as those situations can indicate full application outages! Refer to application anomaly detection settings at Settings > Anomaly detection > Applications to adapt the sensitivity of low-traffic alerting. When enabled, DESK follows a time-interval comparison pattern (daily or weekly) in alerting on abnormal traffic situations. The actual monitored application traffic is compared with the previous interval and alerts if the comparison reports unusually low traffic.
A typical example of an unexpected low traffic event is shown below.
Applicable DESK entities
The following DESK entities apply to this event:
- Service
- Application
- Mobile application
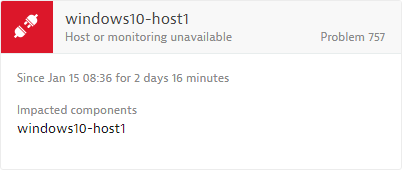
Host or monitoring unavailable
OSI_UNEXPECTEDLY_UNAVAILABLE
This event is detected when a host is abruptly shut down or DESK loses the network connection to the host’s OneAgent. If the operating system is shut down regularly, DESK won't open a problem. DESK will show the host in an unavailable state.
Condition:
- Network connection to the monitored host is lost unexpectedly while OneAgent and host are still running. The connection must be lost for more than 5 minutes, before OneAgent starts sending signals again and cached metric data fills in the missing chart data.
- OneAgent isn't able to catch and send the regular operating system shutdown message.
- Decommissioning of virtual hosts (for example, in AWS auto-scaling groups) when the operating system isn't shut down and therefore DESK detects this as a connection-lost event (event delayed up to 10 minutes after connection is lost).
Closing conditions:
- Event is resolved when the host is available again
- Timeout of event occurs after 12 hours (previous timeouts were 5 days for hosts and 3 days for virtualized hosts).
An example host unavailable event is shown below.
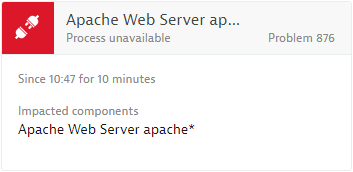
Process unavailable
PROCESS_UNAVAILABLE, PROCESS_GROUP_LOW_INSTANCE_COUNT
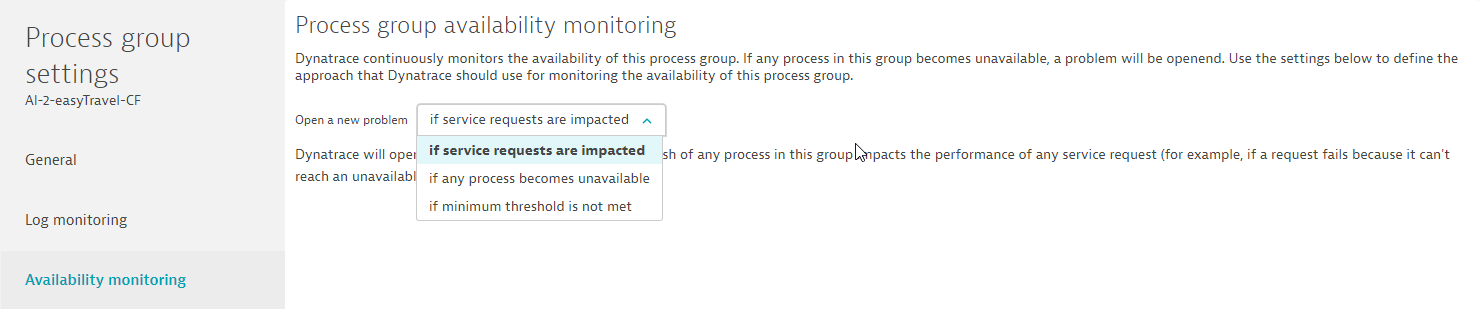
DESK OneAgent automatically detects each running process on hosts and reports the availability state of all processes. As many hosts run volatile processes that are restarted on a regular schedule, DESK doesn't open a problem for each process shutdown by default. However this event is shown as soon as any other triggered event is raised. Alerting on process unavailability is an opt-in setting available via process-group configuration. Process-group configuration allows you to choose between three options:
- If service requests are impacted: Open a process unavailable event only if DESK detects active client requests hitting the selected process.
- If any process becomes unavailable: Open the event if any of the processes within the process group become unavailable.
- If the minimum threshold isn't met: Open the event if a minimum number of running processes within that process group isn't met within an observation period of at least 2 minutes.
A typical example of a process unavailable event is shown below.
Applicable DESK entities
The following DESK entities apply to this event:
- Process group (
PROCESS_GROUP_LOW_INSTANCE_COUNT) - Process group instance (
PROCESS_UNAVAILABLE)
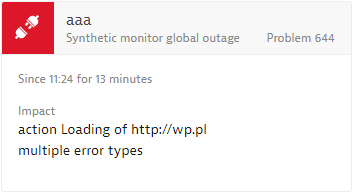
Synthetic monitor global outage
WEB_CHECK_GLOBAL_OUTAGE
Synthetic monitors check your websites from multiple geographic regions on a regular schedule. DESK raises a synthetic global outage event if your website stops responding from all configured geographic regions.
A typical example of a synthetic monitor global outage event is shown below.
Applicable DESK entities
The following DESK entities apply to this event:
- Synthetic monitor
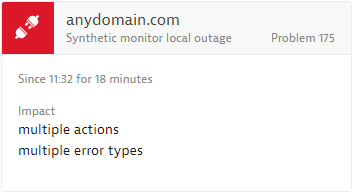
Synthetic monitor local outage
WEB_CHECK_LOCAL_OUTAGE
Synthetic monitors regularly check your websites from multiple geographic regions. DESK raises a synthetic local outage event in case that your Website is not responding from at least one configured geographic region. Once your Web application is not responding from all configured regions, a problem will be elevated to report a global outage.
A typical example of a synthetic monitor local outage event is shown below.
Applicable DESK entities
The following DESK entities apply to this event:
- Synthetic monitor
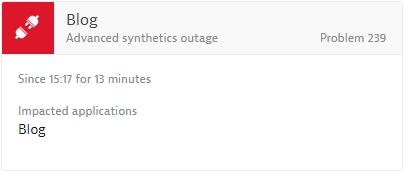
Synthetic monitor outage
SYNTHETIC_AVAILABILITY
The DESK API allows you to receive synthetic test results and synthetic events from DESK Synthetic Classic. This availability event is raised if the Synthetic Classic monitor reports the unavailability of a system under test. The lifespan of Synthetic Classic events is managed through the Classic monitor. Refer to your alerting settings within Synthetic Classic.
A typical example of a synthetic monitor outage event is shown below.
Applicable DESK entities
The following DESK entities apply to this event:
- External synthetic monitor
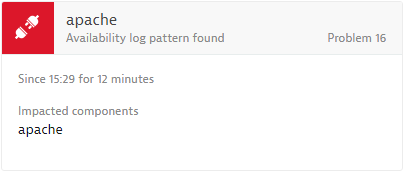
Availability log pattern found
HOST_LOG_AVAILABILITY
DESK Log Monitoring allows you to define log patterns that indicate availability related problems on a host. All detected pattern appearances are registered and if the number of detected pattern exceeds your critical threshold an availability log pattern event is raised.
A typical example of an availability log pattern found event is shown below.

Applicable DESK entities
The following DESK entities apply to this event:
- Host
Availability log pattern found
PROCESS_LOG_AVAILABILITY
DESK Log Monitoring allows you to define log pattern that indicate availability related problems on a process level. Every appearance of a configured pattern is counted over time and if the number of detected pattern exceeds your critical threshold an availability log pattern event is raised.
A typical example of an availability log pattern found event is shown below.
Applicable DESK entities
The following DESK entities apply to this event:
- Process group instance
Custom availability event
AVAILABILITY_EVENT
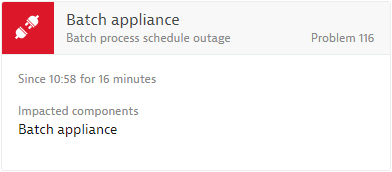
This generic availability event can be used by monitoring plugins or through the DESK REST API to raise a customized availability event with a user defined title.
An example of a custom availability event with a user defined title Batch process schedule outage is shown below.
Applicable DESK entities
All DESK entities apply to this event.