Search patterns in log data and parse results
Log files typically contain a lot of text. One way to handle a large amount of text is to group similar log entries together and parse them. The Log Viewer enables you to present raw log data in a sortable, filterable table format that is easy to work with.
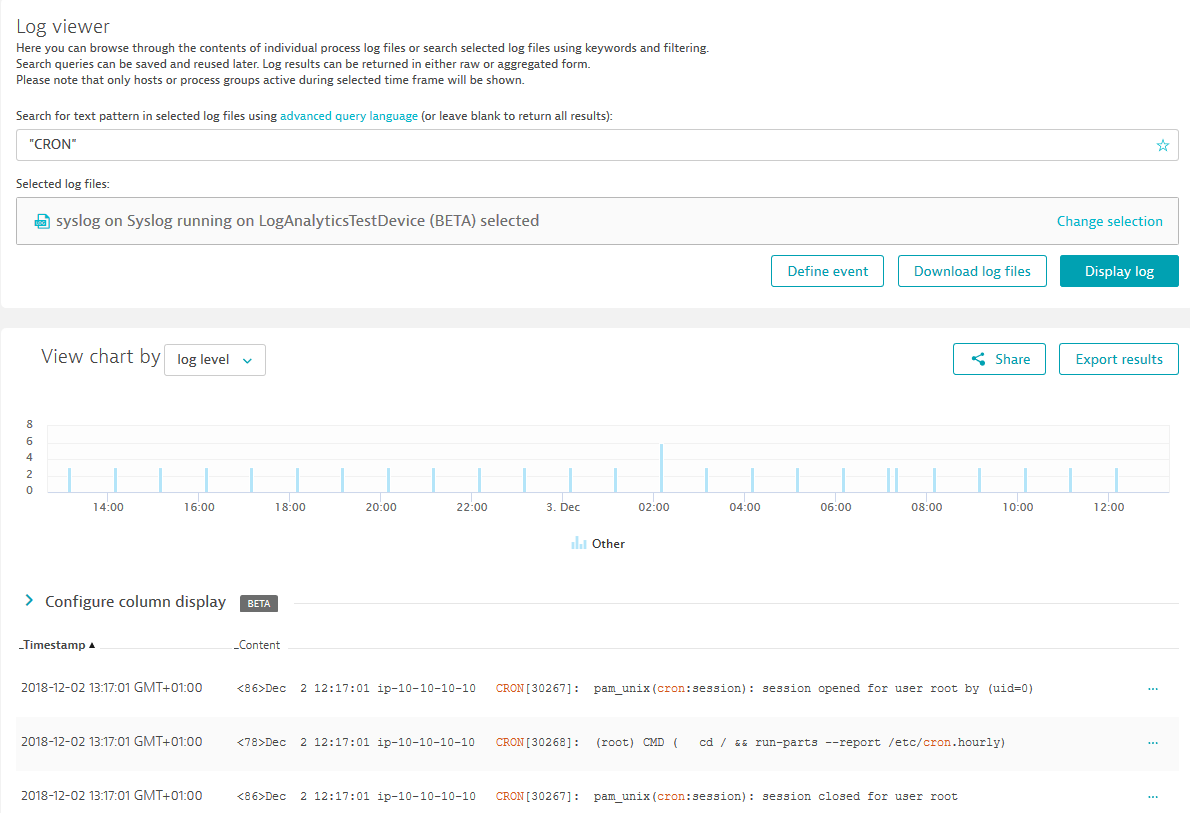
Use the Log Viewer to browse through the contents of individual process log files or search selected log files using keywords. Only hosts or process groups active during the selected time frame are shown. Log results can be returned in either raw or aggregated form. You can parse the result table and narrow down the text pattern search result, show and hide specific columns, and define your own custom columns.
Bookmarks
Use a bookmark to save and reuse your search queries and filters. Any changes you make during your log analysis (log parsing and column filtering) will be saved within the bookmark. Using bookmarks, you can return to the same settings later, but with the default time frame.
Share links
Sharing log analysis differs from bookmarks. The share link includes the selected time frame, so the person who receives the link sees exactly what you want to share in the time frame that you selected.
Search for text patterns in log files
To search log files for a text pattern, select the logs based on the host or process groups perspective, then search for a text pattern using the DESK search query language (or leave the query box empty to return all results).
Using combinations of keywords, phrases, logical operators, and parentheses, the DESK search query language provides you with complete flexibility over searches through important process-log content.
To return all results, leave the query box blank.
Sample queries
Error AND Module1?2
"Connection refused" OR Timeout
Procedure AND (started OR stopped)
Exception AND NOT repeat*
Note that not all parsing and filtering options are available with the free tier of Log Monitoring. Some analysis tools may not be available in your Log viewer.
See What data storage advantages does upgraded Log Monitoring provide?
Column display
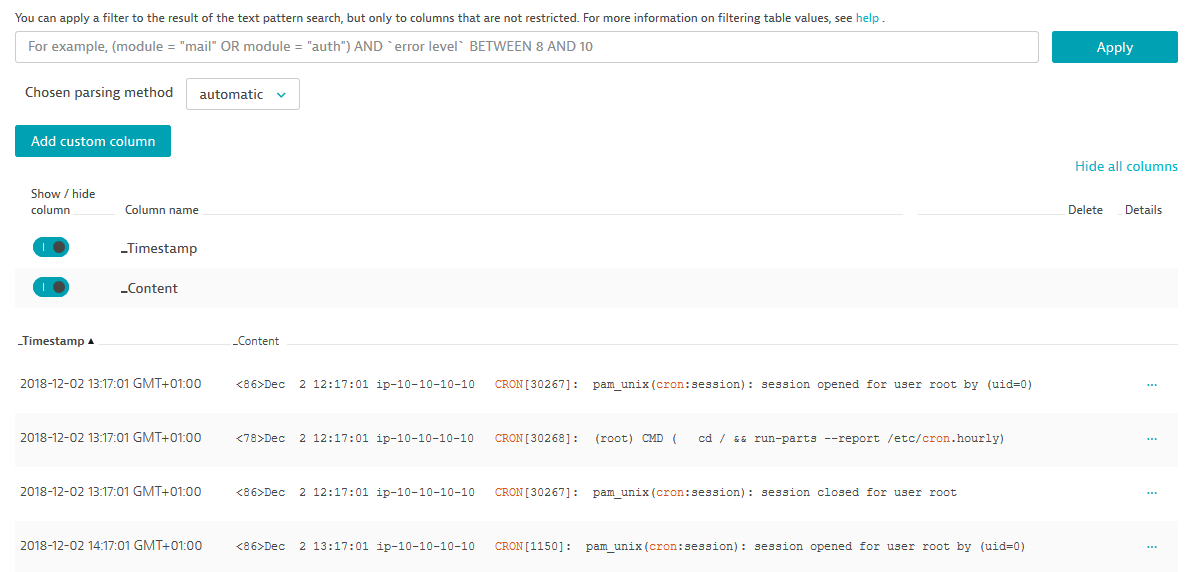
You can click on the Configure column display and apply a filter to the text pattern search, add custom columns, and show or hide any columns (including any custom columns you have added).
By default, the _Content column is set to show. Other automatically detected columns are set to show if the number of entries containing a value is high enough. If multiple columns have the same number of entries containing a value, the columns that appear higher on the columns list take precedence.
Parsing method
Early Adopter
-
automatic
DESK will read the log content and automatically determine the structure of the log, the type of data it contains, and how to present the results in columns. If more than 50 columns are detected, the displayed results will contain the 50 columns with the highest values count. -
JSON
DESK will read the content of selected logs, determine the structure of the log, and present the results in columns only for logs that contain JSON-format data. Each automatically parsed column will represent a JSON field detected in the log entry. -
none
The results reflect the actual log-file content.
If more than 50 columns are detected, the displayed results will contain the 50 columns with the highest values count.
Custom columns
Early Adopter
You can add, hide, or remove a custom column in your log display. Each column name must be unique. Don't use the name of any automatically detected column or repeat a custom column name you already used.
To indicate the section of a log entry that should be listed in your new column, type in the prefix and suffix, and select the type of value that you want to list in the custom column.
The matching value will be treated as the type you indicated. A text value is treated as text even when the value is a number. A number is used for general display of numbers (positive and negative). This is important for sorting purposes.
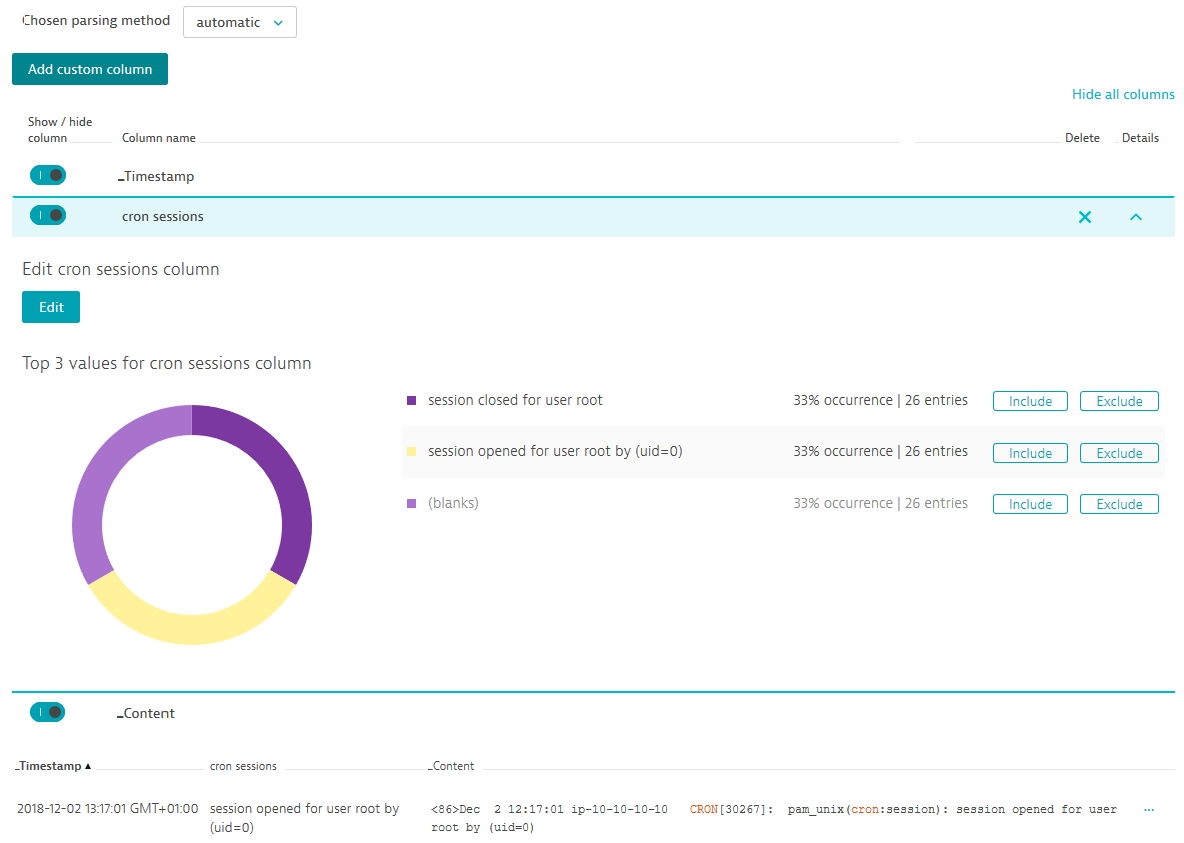
In this example, we have already selected a log file and searched for the CRON text pattern.
Click Configure column display and leave the default parsing method (automatic).
Click Add custom column, type in the column name (cron sessions) and value prefix ((cron:session):).
You can leave the suffix empty, as we want the rest of the line shown in the column, and make sure that the value type is set to text (string).
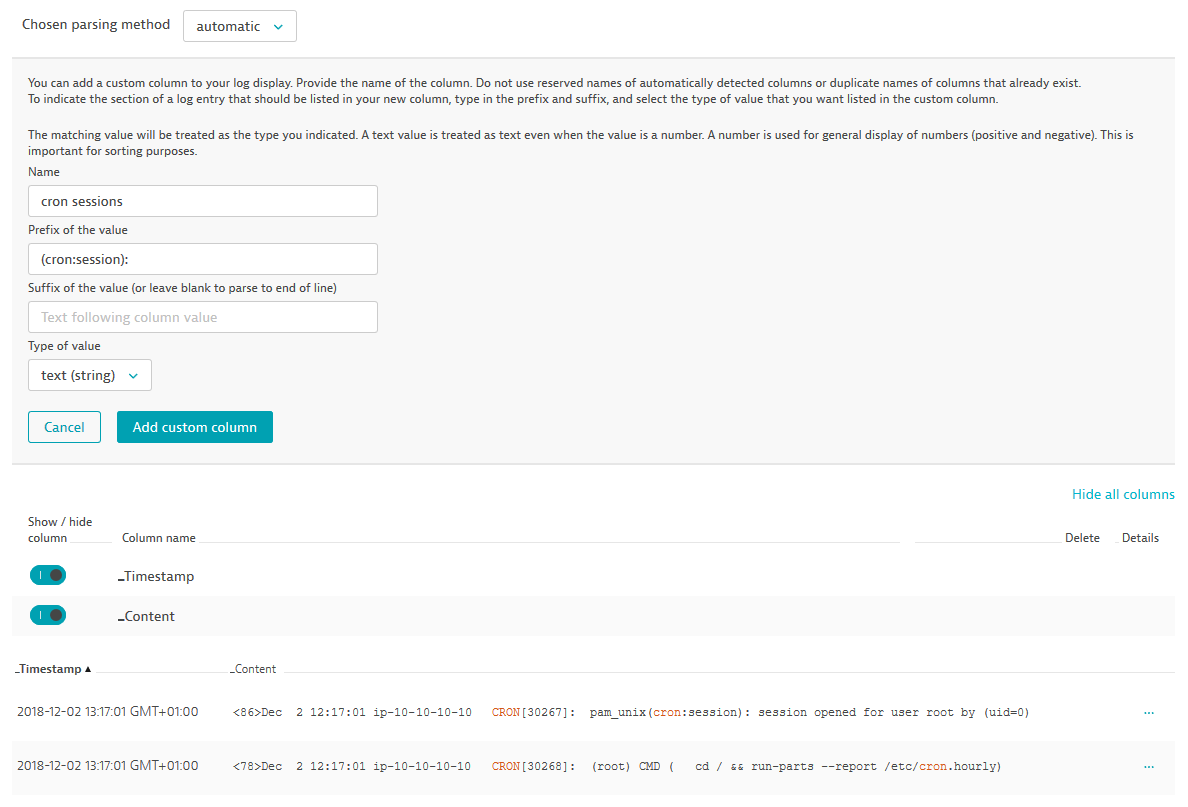
Click Add custom column to accept your column configuration.
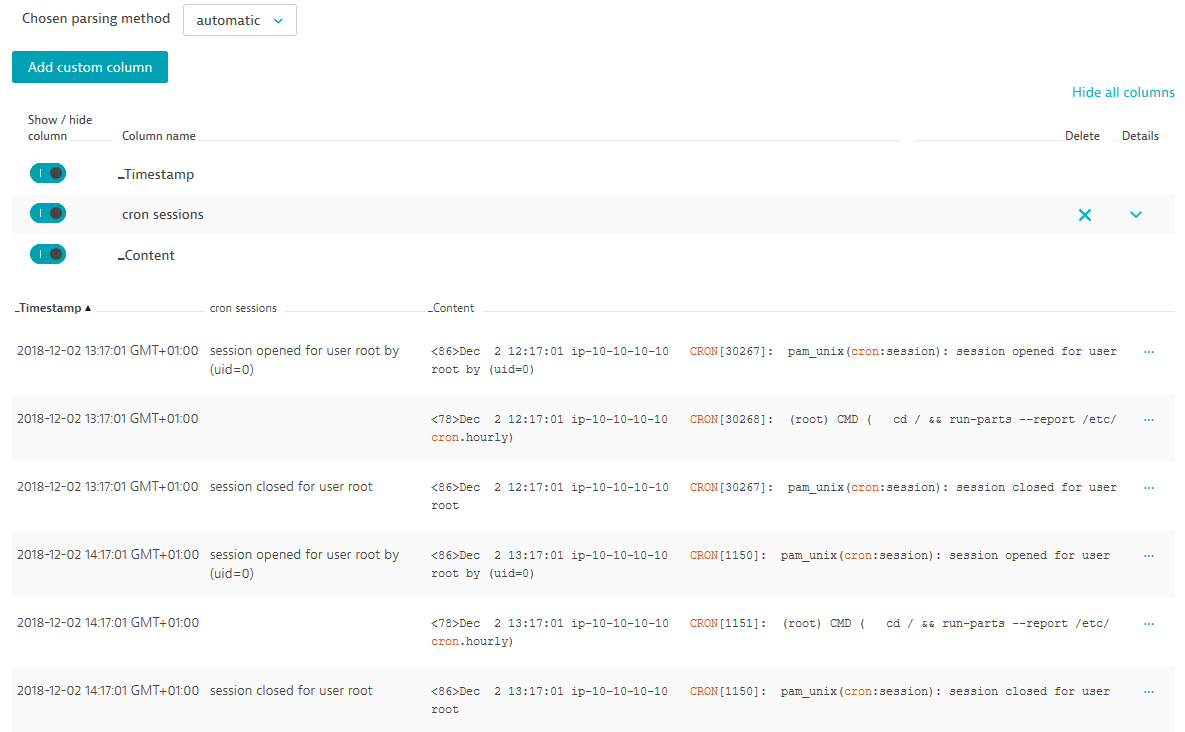
You newly added custom column will be listed along with default columns. You can show, hide, delete, and edit your custom column. Click Details for your new column to view the top values. In this case, you can easily see the number of opened and closed sessions.
Column values filter
Early Adopter
You can apply a filter to the results of the text-pattern search, but only to the columns that are not restricted (_Source, _Timestamp, _Content). Apply the filter to all manual and automatically parsed columns. Both column names and values used in the filter are case sensitive.
Every column contains a value of a specific type: text (string), number (integer), number (decimal), or Boolean true/false. Depending on the value type, the syntax of your filter can vary. For example, if the column is a number (integer) type and you assign a different value type (string, decimal, or true/false) in your filter, you will generate a parsing error.
-
Column names containing special characters (including spaces) must be enclosed in backticks.
For example:`integer Column # 2` = 20 -
Filtered values containing quotation marks must be enclosed in double quotation marks.
For example, the valuepath "test" errorshould be entered in the filter as:expath = "path ""test"" error" -
Column values where the sum of the column name and value length exceeds 8191 characters are shortened with an ellipsis.
An invalid column filter query will not be applied to already saved or shared bookmarks.
Top N occurrences
Early Adopter
Click on any column name to view the top 10 values with the most occurrences within that column. The value occurrence percentage is in relation to the result based on the column filter.
For example, if you Include in the filter only one value for a particular column, the occurrence of that value in that column will be 100%.
-
other
The remainder of the filtered values that do not qualify for the top 10 most occurring values within the column. -
(blanks)
A count of the filtered log records that contain no value in the selected column.
Use the Include and Exclude buttons to add or subtract the value in the column filter syntax. Click Apply to update the filter result.
If you Include the value in the filter, the result will display only the selected (included) values. If you Exclude the value in the filter, the result will display all values except the ones you have excluded in the filter. You can include and exclude multiple values in one filter.
To reset the filter, clear the filter syntax and click Apply.