Memory dump analysis
Memory dumps are first stored locally on the disk of the monitored application-server machine. OneAgent can subsequently upload the memory dumps automatically to an ActiveGate, which can act as a long-term storage center for memory dumps. The provided download links direct you to the ActiveGate that received that memory dump. This approach ensures that memory dumps are only available to users who have access to the network location of your ActiveGate. This precaution provides an additional security layer that ensures that no personal data leave your data center without you explicitly configuring it that way.
DESK can store and analyze memory dumps for Java and Node.js based applications. Since OneAgent version 1.165, DESK also stores and analyzes memory dumps for .NET based applications on Windows.
Enable memory dumps
To enable memory dumps, you need to appropriately configure an ActiveGate.
Trigger memory dumps
To trigger a memory dump:
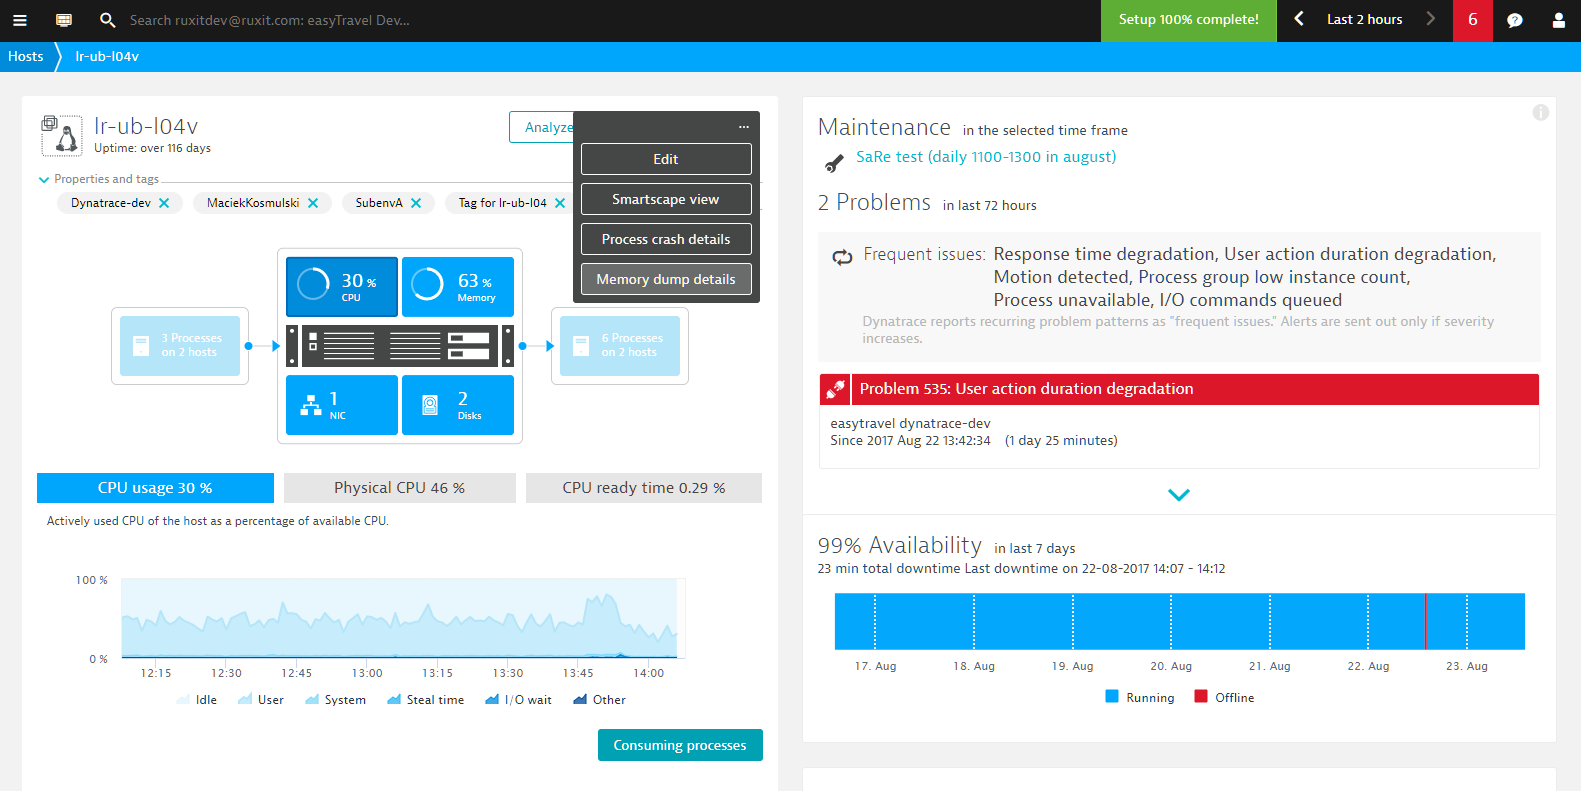
Navigate to the Host page, Service page, Process page, or Process group page of the entity that you want to analyze.
Click the Browse […] button and select Memory dump details.
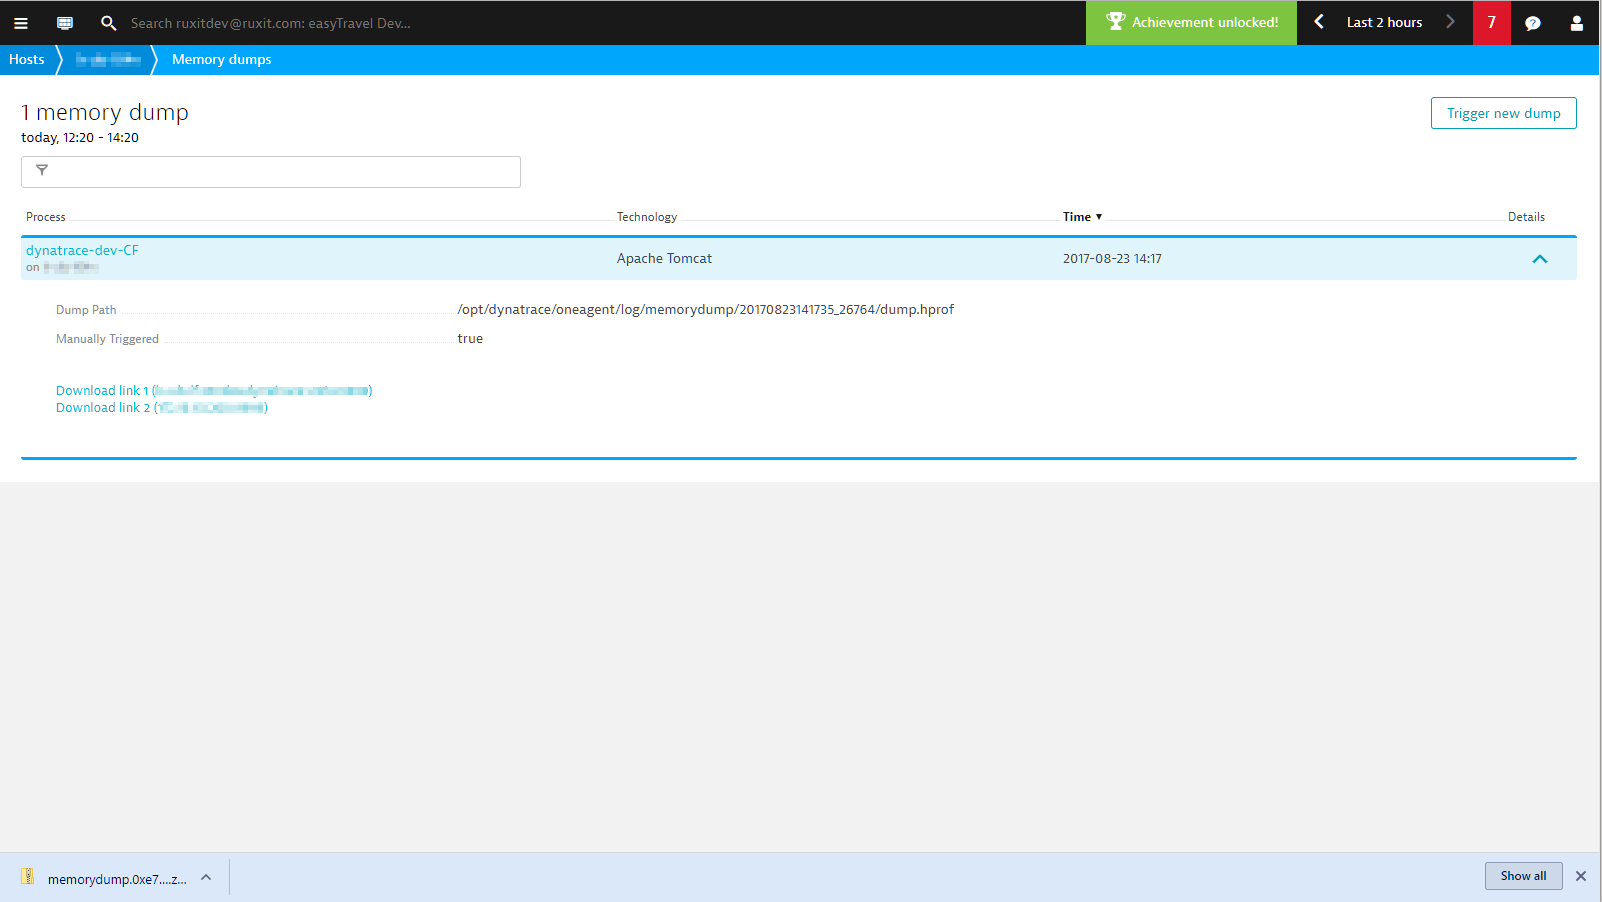
The Memory dumps page displays a list of the memory dumps that occurred during the selected timeframe for the selected entity (host, service, process, or process group).
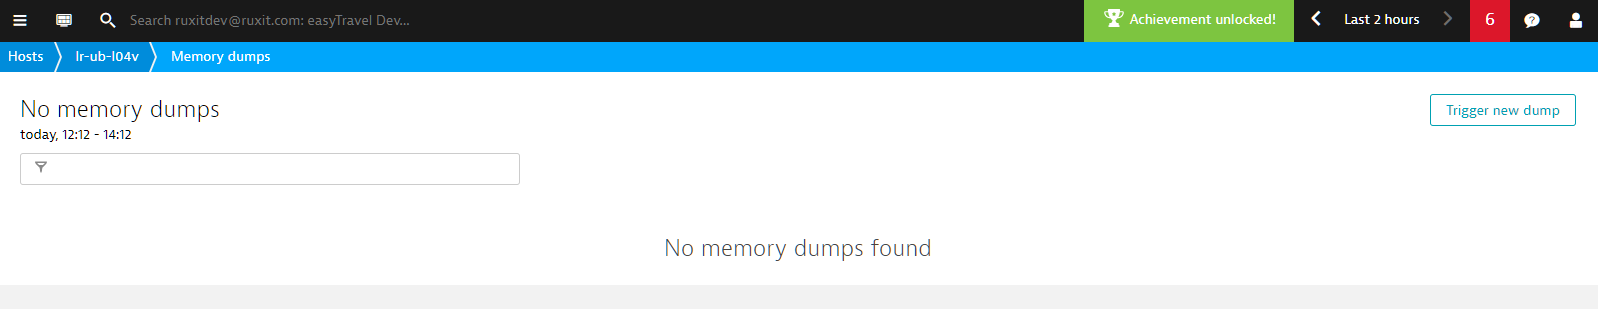
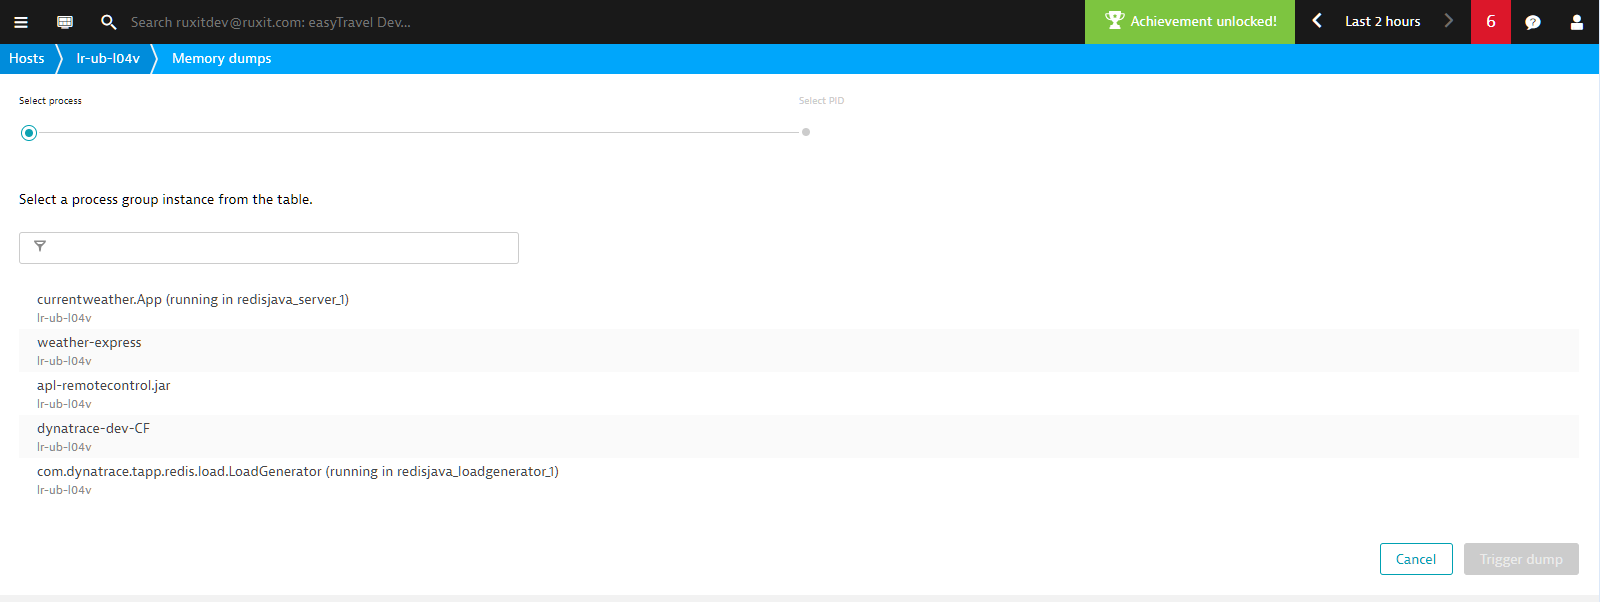
Click the Trigger new dump button to generate a new memory dump (you’ll need the Configure capture of sensitive data user permission to do this). To trigger a memory dump first select the process.
Click the Trigger dump button.
It takes a few minutes to generate a memory dump. The time required varies widely based on application type. Java applications that have multiple GBs of heap memory may take several minutes; smaller dumps will be available almost immediately.
Note for Java applications: DESK uses the JVM Tool Interface (JVM TI) to generate memory dumps. For this reason, your JVM may stall during memory-dump generation. Please restart your Java-based application following trigger of a memory dump.
Return to the Memory dumps page. The newly created dump now appears in the list.
Click the memory dump Download link to view the memory dump (see example below).
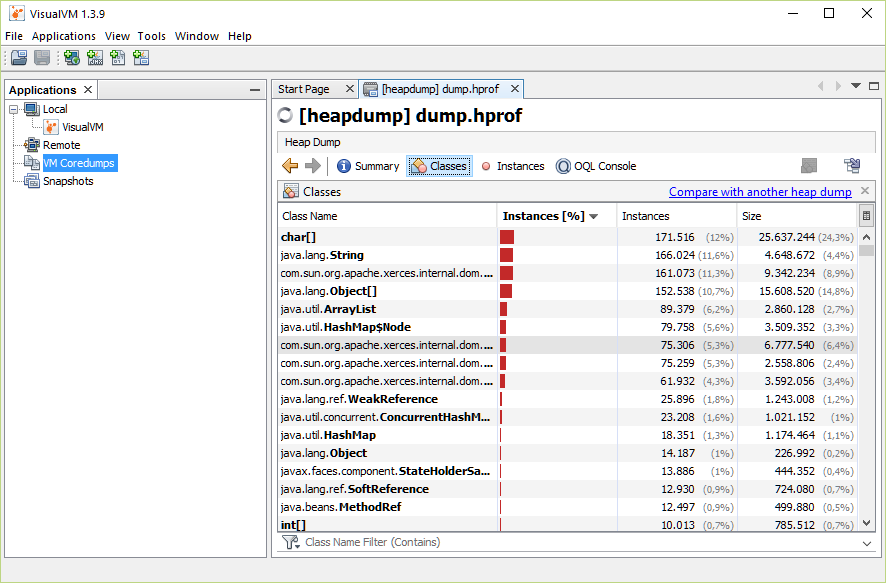
In the case of Java applications, the download provides the memory dump in hprof format, which can be analyzed using a number of tools, including Eclipse Memory analyzer and VisualVM (see example below). The IBM JVM doesn't support hprof but its own format called IBM Portable Heap Dump (PHD). This can also be analyzed by the Eclipse Memory analyzer.
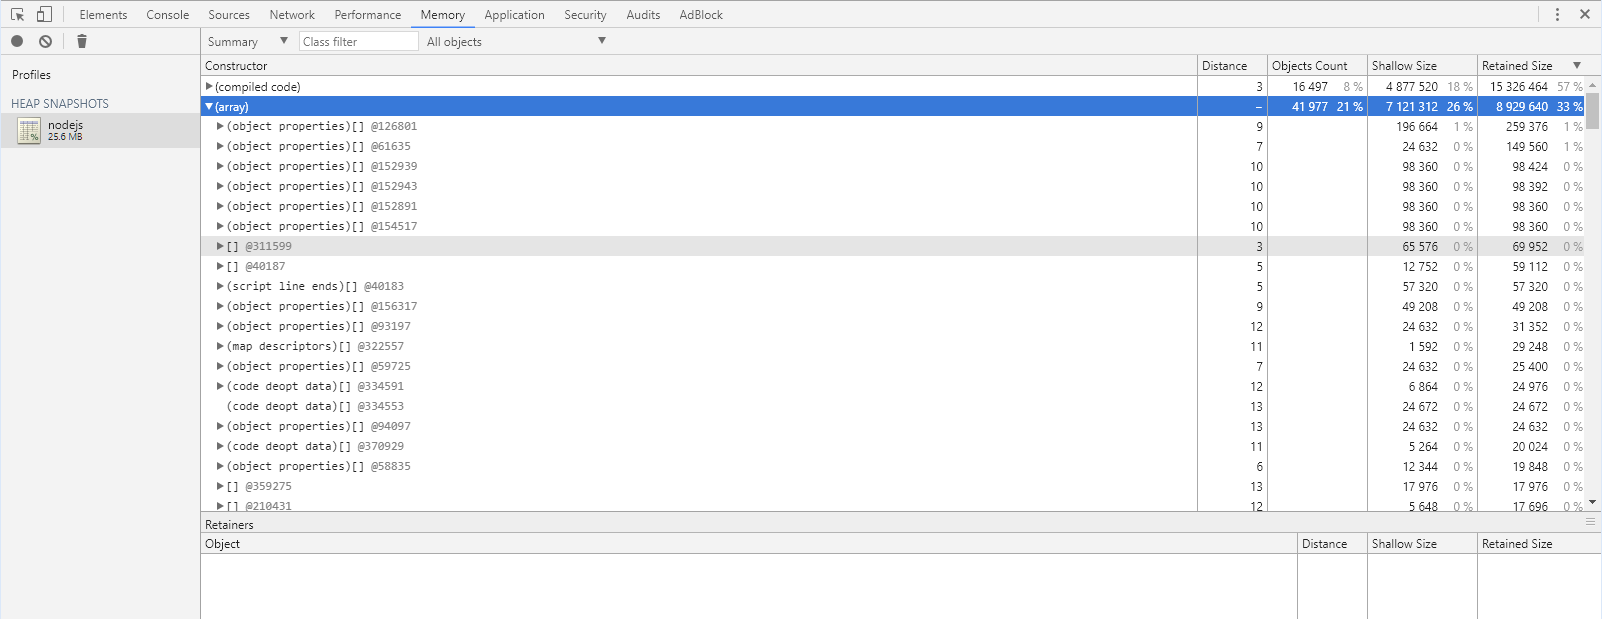
Node.js memory dumps can be opened in Google Chrome’s integrated memory heap snapshot analysis tool (see example below).